Research Article: 2021 Vol: 25 Issue: 1
How Much Efficient are the Fast-Food Restaurants to Achieve Customer Satisfaction in Bangladesh?
Fazlul Hoque, Sher-e-Bangla Agricultural University, Bangladesh
Tahmina Akter Joya, Jahangirnagar University, Bangladesh
Sajeeb Saha, Sher-e-Bangla Agricultural University, Bangladesh
Bisakha Dewan, Sher-e-Bangla Agricultural University, Bangladesh
Sauda Afrin Anny, Sher-e-Bangla Agricultural University, Bangladesh
Moriom Khatun, Sher-e-Bangla Agricultural University, Bangladesh
Abstract
The study aimed to assess the operational efficiency level of the fast-food in achieving customer satisfaction by applying the stochastic frontier approach. In addition, the study attempted to figure out the five dimensions of the SURVQUAL model with the food quality as factors affecting customer satisfaction toward a fast-food restaurant and sources of the inefficiency of the restaurant to ensure customer satisfaction. Data of 160 customers consuming or taking the fast-food from 160 fast-food restaurants’ outlets were collected by using a structured questionnaire and face-to-face interview method. The data were analyzed by using the software frontier version 4.1. The study revealed that the efficiency among the restaurants varied from 0.47 to 1.00 with a mean efficiency score of 0.77 which signaled that the fast-food restaurants are fulfilling the customer’s need or expectation up to 77% and 23% of the need or expectations of the customers toward the fast-food remains unsatisfied. After that, food quality, reliability, tangibility, assurance, and empath affected customer satisfaction significantly. Finally, the inefficiency model had identified a few variables such as professional training of the staff, location of the outlet, unique recipe, and brand popularity as sources of inefficiency among the restaurants serving the fast-food.
Keywords
Customer, Satisfaction, Efficiency, Fast-food, Bangladesh.
Introduction
Efficiency is referred to as a level of performance that employs the lowest amount of inputs to produce the greatest amount of outputs. This term is significant to any organizations such as social, business and governmental. Efficiency analysis is an essential issue due to the fact all inputs are scarce. Time, money and raw materials are limited, and it is necessary to preserve them whilst retaining an ideal level of output. An efficient society is capable to serve its citizens. An efficient governmental organization is capable to serve its stakeholders by ensuring the welfare and efficient business firm can produce goods and services by utilizing the lowest amount inputs. Although fast-food industry had been started in United States in the 19th century, it has been one of the most successful revenue generating sectors around the world. According to Statista (2020), More than 5.4 million people work in the fast-food industry that generates about $260 billion in the USA and globally it is the source of about $600 billion revenue with 10 million employment. Now-a-days, American based fast-food giant companies such as KFC, Pizza Hut, McDonald, Burger King etc. are serving the various types of fast food around the world. Globalization has spread out the fast-food restaurant here and there. Due to the globalization, fast food consumption in Bangladesh had started in the early nineties and after 2000 the fast-food consumption culture had enjoyed huge pace for the rapid access to information and communication technology (Islam & Ullah, 2010). In early 2000, KFC and Pizza Hut two renowned international fast-food brands entered into Bangladesh through Transcom Food Limited (TFL). Although fast-food culture started its journey in Bailey road of Dhaka city, it has been common to people living in sub urban and urban areas of Bangladesh. Once fast-food consumption was considered as a symbol of aristocracy but now people have taken it regularly to avoid the cooking in the house for being busy in various activities. Even few people take the fast-food frequently by cooking themselves being well known to fast food recipes and available materials to cook. Due to mass acceptance of fast-food culture and substantial market size, the local entrepreneurs have started the fast-food restaurant business and local entrepreneurs are playing the leading role in fast food industries in Bangladesh. The fast-food industry is going under a highly competitive environment in Bangladesh due to the presence of huge local brands and the presence of the few globally famous brands. Since the ultimate success of the fast-food industry depends upon customer satisfaction towards a brand. Hence, to be efficient dealing with the customers is mandatory to survive in the market. Even efficient local brand can expand into the international market where Bangladeshi communities are living around the world. This study aims to estimate the efficiency level of fast food by focusing the customer satisfaction.
Theoretical Frame Work
Customer Satisfaction
Customer satisfaction is an abstract concept which means to the extent a marketing offering of a company can fulfill the customer’s expectation. As customer satisfaction is an abstract term and difficult to quantify exactly, different researchers have defined it from various points of view. For example, Oliver (1981) stated ‘Satisfaction is a psychological state resulting when the emotion surrounding disconfirmed expectations is coupled with the consumer’s prior feelings about the consumption experience’. Similarly, customer satisfaction can be viewed as the result of a subjective process –customer compares his ideas with perceived reality (Anderson et al., 1994). Again, Hoyer and MacInnis (2001) said that satisfaction can be associated with feelings of acceptance, happiness, relief, excitement, and delight. Meanwhile, Jamal & Naser (2003), defined customer satisfaction as a feeling or evaluation by customers towards products or services after consumption. After that, Hansemark and Albinsson (2004) stated ‘satisfaction is an overall customer attitude towards a service provider, or an emotional reaction to the difference between what customers anticipate and what they receive, regarding the fulfillment of some need, goal or desire’. Customer satisfaction can be studied based on a single or whole marketing mix such as product, price, place, and promotional strategies (Suchanek & Kralova, 2015). They also found the positive impact of customer satisfaction on the company performance. Lastly, Philip Kotler (2016), the extent to which a product’s perceived performance matches a buyer’s expectations. If the product’s performance is less than expectations, the customer is dissatisfied. If performance is equal to expectations, the customer is satisfied. If performance exceeds expectations, the customer is highly satisfied or delighted. The higher level of customer satisfaction leads to brand loyalty and repurchase intention which ultimately increases the performance in terms of sale volume, market share (La Barbera & Mazursky, 1983; Heskett et al., 1997; Sivadas & Baker-Prewitt, 2000; Hoyer & MacInnis, 2001; Singh, 2006).
Hence, the success of the business depends upon how the customers perceive the products of the company. Customers either individual or business is treated as king for any business firm because all the participants or stakeholders in business take money from the treasury for their activities whereas only the customers pay to the treasury. Therefore, to evaluate customer satisfaction is one of the cutting-edge strategies which can create an opportunity for the company to deliver the superior value than the competitors.
Survqual Model
The SERVQUAL model has been adopted from the study of Parasuraman et al.,1985 and it is a multidimensional research technique, outlined to evaluate the quality of service by comparing the respondents’ expectations and perceptions based on the five dimensions of service quality. The model is built on the expectancy-disconfirmation paradigm, which means that service quality is accepted as the extent to which consumers’ pre-consumption quality expectations are confirmed or disconfirmed by their perceived benefits after service consumption.
Reliability
Reliability means the ability to deliver the promised services accurately, on time, and credibly (Parasuman et al., 1985). It is only possible when the service providers will have a standardized service or product policy and strictly implement the policy to deliver the service or product consistently.
Responsiveness
Parasuraman et al. (1988) stated that responsiveness is viewed as the level of willingness a company believe to provide prompt service and to solve the problem fast, deal with customers’ complaint effectively and efficiently to meet the customers’ requirements.
Tangibles
Tangibles are the collection of all the physical arrangements including equipment, machines, the attitude of staffs, materials, manuals, information systems, and images of the facilities to deliver service by a particular company (Parasuman et al., 1985; Sureshchandar et al., 2001). The physical atmosphere also called servicescapes influences directly both employees and customers in physiological, psychological, sociological, cognitive and emotional ways (Sureshchandar et al., 2001).
Assurance
The assurance generates the credibility and trust for customers, which is done through professional services, excellent technical knowledge, courtesy, and good communication skills of the staffs, consequently customers can believe in the service quality of a firm (Parasuraman et al., 1994).
Empathy
Empathy means how the company feels the customers’ need. The company needs to realize the customers’ need by sitting in the customers’ chair. Parasuraman et al. (1994) suggested that service providers should consider themselves as host and care the customers individually, deliver the customized service by treating them as guests. Finally, the marketing offerings of the fast-food restaurant combine both good (fast-food) and service. Consequently, only five dimensions of the SERVQUAL model cannot determine customer satisfaction perfectly. The food quality of the fast-food items has a significant influence on customer satisfaction toward the fast-food restaurants (Islam & Ullah,2010; Jun & Cai, 2010; Handoko, 2016; Kannan, 2017; Zhong & Moon, 2020). Given this situation, the study aims to estimate the customer satisfaction frontier by combining the five dimensions of the SERVQUAL model and food quality
Stochastic Frontier Approach
Aigner et al. (1977), Meeusen & Van den Broeck (1977) independently proposed the stochastic production or cost frontier models. Stochastic frontier model suits the specific parameterizations of the inefficiency term and can match the stochastic production frontier or cost frontier model. Suppose that a fast-food restaurant has a production function for a single output without any inefficiency (maximum possible feasible production frontier) as

In Equation (1) Yi indicates the customer satisfaction of the i-th restaurant, Xi denotes variable inputs with K inputs used by the restaurant to serve the fast food for the customers and β indicates (Kx1) vector of technology parameters to be estimated.
Stochastic Frontier Approach assumes that the restaurant cannot ensure the highest level of the customer satisfaction in the production frontier due to the degree of inefficiency. Stochastic production function can be written by adding error term for inefficiency as

Where, εi is composed of two independent elements νi and ui, such that εi =νi-ui; ui denotes one sided error while vi is two-sided error term. The random component νi is assumed to be identically and independently distributed as N (0, σv2) and is also independent of ui This random error represents random variations in output due to those factors are impossible to control for the restaurants such as a, natural disasters, sudden failure of cooking machines, mindset of the chef during cooking and quality of variable inputs (such as raw materials rice, flour, meat, fish, vegetables, oil, and etc. to prepare the fast food) as well as the effects of measurement errors in the output variable, statistical noise and omitted variables from the functional form (Aigner et al. 1977).
The ui is nonnegative random variable that represents the stochastic shortfall of the customer satisfaction from the most efficient production. The ui is the one-sided disturbance form used to represent technical inefficiency and are assumed to be independently and identically distributed with the half normal truncated distribution as N+(0, σu2) also independent of νi (Kumbhakar & Lovell, 2000).
Maximum Likelihood Estimation (MLE) technique is employed to estimate the parameters (β,σ,γ) of stochastic frontier. The variance of the parameters can be estimated as following way:
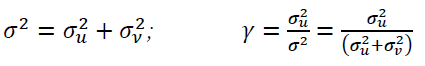
FRONTIER version 4.1software can be used to estimate all parameters of the SFA of the maximum likelihood function (Coelli, 1996b). This software estimates the γ = σ2u/σs2 parameter, which takes a value between zero (0) and one (1). When, γ = 0 denotes that deviations from the customer satisfaction frontier are due to noise. Whereas γ =1 represents that deviation from the frontier is due to technical inefficiency.
The efficiency of a firm involves the comparison between perceived and desired level of the output (Lovel, 1993). Similarly, the efficiency of the i-th fast-food restaurant is understood as the ratio between the perceived customer satisfaction and the desired level of customer satisfaction. Hence technical efficiency denoted by TE_i is given by:


TEi ranges the value between 0 and 1. If ui = 0; the farm is operating on the satisfaction frontier and obtaining the highest possible satisfaction. If ui > 0; the farm is inefficient to operate on satisfaction frontier as a result of inefficiency.
Hypothesis
H0: All the fast- food restaurants are equally efficient to achieve the optimum level of customer satisfaction.
H1: All the fast- food restaurants are not equally efficient to achieve the optimum level of customer satisfaction.
Material and Methods
This study was carried out following the quantitative and explorative research process to evaluate the efficiency level of the fast-food restaurant in achieving customer satisfaction. I have selected the Dhaka city for the study because more than 85% fast-food restaurants of the country including the foreign brands and local brand are conducting their business in Dhaka city due to having the major customer segments here. The study followed both probability and non-probability sampling procedure to pick up the respondents for data collection. The respondents were the customers who were found to purchase fast-food from the restaurants or eating fast food in the restaurants. Data were collected from 160 customers of 160 fast-food restaurants’ outlet by face-to-face interviews following the structured questionnaire. All variables were considered by following the literature of the SERVQUAL model and determinants of customer satisfaction in the fast-food industry around the world. The first section of the questionnaire included the socio-economic aspects of the customers going to the fast-food restaurants.
The second part consisted of questions relevant to factors determining the customer satisfaction of the fast-food restaurants and questions were designed following the 5-points Likert scale ranging from 1=strongly disagree to 5=strongly agree. The collected data were subsequently processed, tabulated and analyzed for the study. The stochastic customer satisfaction frontier with inefficiency model assuming a Cobb-Douglass functional form was be employed to estimate the technical efficiency and determinants of inefficiency of the restaurant. The stochastic customer satisfaction frontier was estimated using a single-stage maximum likelihood function estimation procedure and carried out by the Frontier Version 4.1(Coelli, 1996).
Empirical Model
Following Coelli (1996), the stochastic customer satisfaction frontier with a Cobb-Douglas functional form was proposed in the following way in Figure 1.

Figure 1 Customer Satisfaction Frontier

Where,
Y= customer satisfaction; FQ= Food Quality; T= Tangibility; Em= Empathy;
Res= Responsiveness; As= Assurance; Re= Reliability
The inefficiency model (ui) is defined by:

Where, ui =Profit inefficiency score; R1 =Schooling (Years); R2 = Sales Promotion (yes=1, otherwise = 0); R3 = Location (1=Convenient, otherwise=0); R4 = Brand Popularity (yes=1, otherwise = 0); R5 = Training (yes=1, otherwise = 0); Unique Recipe Dummy (1= yes,0= otherwise).
Results and Discussion
Table 1 has illustrated the few demographic aspects of the customers who were purchasing or consuming the fast-food from various fast-food restaurants in Dhaka city. Few points are highly remarkable here.
| Table 1 Demographic Features of the Customer | ||
| Age | ||
| Range | Frequency | Percentage |
| <20 | 48 | 30.00 |
| 21-30 | 65 | 40.63 |
| 31-40 | 20 | 12.50 |
| 41-50 | 16 | 10.00 |
| >51 | 11 | 6.88 |
| Total | 160 | 100.00 |
| Gender | ||
| Male | 90 | 56.25 |
| Female | 70 | 43.75 |
| Total | 100 | 100.00 |
| Occupation | ||
| Student | 82 | 51.25 |
| Service Holder | 41 | 25.625 |
| Business | 24 | 15.00 |
| Other | 13 | 8.125 |
| Total | 160 | 100.00 |
Firstly, customers of all ages are found to prefer the fast-food item. About 30% of customers were less than 20 years old and 40.63% of customers belonged to the age group of 21-30 years. Most of the customers who prefer to take the fast-food frequently are young people (Akbay et al., 2007; Islam & Ullah, 2010; Lalnunthara & Kumar, 2018).
Secondly, the researcher observed that customers consuming fast-food belong to both male and female. It is noteworthy that the percentage of the male customer was higher than female. Male people prefer to take the fast-food being busy at the workplace, staying outside and avoid cooking at the house (Lalnunthara & Kumar, 2018).
Finally, the customers belonged to various occupation takes the fast-food items. The largest group taking the fast-food was student (school going, college-going and university level). Being busy at institutes, passing time with classmates and finally being unaware of health issues, students prefer to eat the fast-food items regularly instead of a regular meal. The similar result was reported by (Islam & Ullah, 2010; Lalnunthara & Kumar, 2018).
Table 2 presented the list of fast-food items commonly consumed by the customers. Although customers prefer the various items of the fast-food, few items such as Fried Chicken, Pizza, Burger, Hot dogs and French fry are consumed frequently by the customer in Dhaka city Bangladesh.
| Table 2 Most Commonly Preferred Fast-Food Item | |
| SL. No | Particulars |
| 1 | Fried Chicken |
| 2 | Nugget |
| 3 | Chicken Ball |
| 4 | French Fry |
| 5 | Pizza |
| 6 | Burger |
| 7 | Hotdogs |
| 8 | Shawarma |
| 9 | Grilled Chicken |
| 10 | Chow mein |
| 11 | Chinese set |
| 12 | Soup |
| 13 | Pasta |
The descriptive summary of the variables has been shown in table 3. The study has presented the maximum, minimum, and mean value of the variables such as food quality, tangibility, reliability, empathy, assurance and responsiveness to explain customer satisfaction whereas schooling year of the staff, the professional training of the staff, location, sales promotion, unique recipe, and brand popularity are assumed as sources of the operational inefficiencies among the restaurants serving the fast-food in Dhaka city of Bangladesh.
| Table 3 Summary Statistics | |||
| Variable(s) | Maximum | Minimum | Mean |
| Customer Satisfaction | 5 | 1 | 3.75 |
| Food Quality | 5 | 1 | 4.00 |
| Tangibility | 5 | 1 | 4.25 |
| Reliability | 5 | 1 | 3.25 |
| Empathy | 5 | 1 | 3.75 |
| Assurance | 5 | 1 | 3.50 |
| Responsiveness | 5 | 1 | 3.00 |
| Restaurant Specific features | |||
| Schooling year(s) of the staff | 17 | 2 | 7.25 |
| Professional training of the staff (1= yes, 0= otherwise) | 1 | 0 | 0.51 |
| Location Dummy (1= convenient, 0=otherwise) | 1 | 0 | 0.72 |
| Unique Recipe Dummy (1= yes,0= otherwise) | 1 | 0 | 0.67 |
| Sales Promotion Dummy (1=yes, 0=otherwise) | 1 | 0 | 0.54 |
| Brand Reputation Dummy (1=popular brand, 0=otherwise) | 1 | 0 | 0.63 |
The Log-Likelihood Ratio (LR) test was applied to test the hypothesis in Table 4. LR= - 2 {log [L (H0) – log [L (Ha)]} formula was employed to carry out the likelihood ratio test. The null hypothesis was that all the fast- food restaurants are equally efficient to achieve the optimum level of customer satisfaction. The calculated Loglikelihood Ratio (LR) was 34.82 which is higher than the tabulated value 2.71 and significant at 5% probability level that means the null hypothesis is rejected. So, there are inefficiencies among the fast-food restaurants which indicates all the restaurants are not operating on the customer satisfaction frontier.
| Table 4 Test of Hypothesis | ||||||
| Null hypothesis | Log Likelihood (Ho) | Log likelihood (Ha) | No. of Restrictions (df) | Test statistics (LR) | Critical value (5%) | Decision |
| H0: γ = 0 | -112.30 | -94.89 | 1 | 34.82 | 2.71 | Rejection |
Table 5 presented the estimation of the customer satisfaction frontier with Cobb-Douglass functional form through MLE for total of150 respondents of the study area. The sigma-Squared (σ2) was found 0.88 and statistically significant at the 1%probability level. Again, the calculated value of the gumma parameter (γ) was found 0.93 and was significant at 1% probability level. It means that 93.00% variation in customer satisfaction from satisfaction frontier among the fast-food restaurants occurred due to the specific characteristics of the restaurants rather than random variability.
| Table 5 MLE Estimated Results | ||||
| Parameter | Coefficient | Standard Error | t-ratio | |
| Constant | -4.18 | 0.78 | -5.33 | |
| Food quality | 0.46** | 0.16 | 2.82 | |
| Tangibility | 0.19* | 0.13 | 1.52 | |
| Responsiveness | 0.05 | 0.18 | 0.27 | |
| Empathy | 0.48*** | 0.09 | 5.43 | |
| Reliability | 0.30** | 0.15 | 2.01 | |
| Assurance | 0.62* | 0.37 | 1.68 | |
| Inefficiency Model | ||||
| constant | 0.12 | 0.053 | 2.264 | |
| Schooling Year | -0.09 | 0.140 | -0.642 | |
| Training of the staff | -0.29 | 0.141 | -2.056** | |
| Sales Promotion | -0.182 | 0.241 | -0.755 | |
| Location | -0.253 | 0.086 | -2.961** | |
| Unique Recipe | -0.150 | 0.047 | 3.191*** | |
| Brand Popularity | -0.314 | 0.199 | -1.577* | |
| Sigma Squared | 0.88 | 0.15 | 5.82 | |
| Gumma | 0.93 | 0.04 | 24.62 | |
The coefficient of the food quality was of 0.46 and statistically significant 5% probability level which indicates that the quality of the food influences the level of customer satisfaction significantly. The estimated result suggests that the restaurants serve the fast-food having better quality in term of fresh raw materials, cleanliness are efficient to deliver the higher customer satisfaction than the restaurants do not care of the food quality. The finding was consistent with the previous studies (Islam & Ullah, 2010; Jun & Cai, 2010; Ryu et al., 2012; Handoko, 2016; Kannan, 2017; Zhong & Moon, 2020).
Similarly, the reliability was found to affect customer satisfaction at 5% level of significance. This implies that the restaurants having the capability to deliver the promised fast-food items accurately, on timely and credibly are more efficient to ensure the higher level of customer satisfaction than others and vice-versa (Parasumann et al., 1985; Parasumann et al., 1988; Andaleeb & Conway, 2006; Qin & Prybutok, 2009; Kant & Jaiswal, 2017)
Again, the coefficient of empathy was of 0.48 and statistically significant at 1percent level. The finding means that empathy plays a significant role in determining customer satisfaction. When any restaurants have better strategies to feel the need and requirements of the customers by the employees are efficient to provide a higher level of satisfaction than others and vice-versa. When a service providing firm or fast-food restaurant’s staffs feel the need of the customers by sitting in the position of the customer which helps them to deliver the superior food and service (Sultana et al., 2016; Qin & Prybutok, 2009).
The coefficient of tangibility was found to have a positive sign and statistically significant at 10 % level, which denotes that the higher tangibility level of the restaurants leads to the higher customer satisfaction and vice versa. The physical arrangements of the restaurants such as interior and exterior decoration, equipment, machines, the attitude of staffs, materials, manuals, and information system are important to shape customer satisfaction. The restaurants with well interior or exterior design, clean & comfortable environment, staff with the neat and clean dress, beautiful food menu and others facility always attract and retain the customer (Qin, & Prybutok, 2009; Ryu et al., 2012; Sabir et al., 2014; Zhong & Moon, 2020).
Finally, the coefficient of assurance carrying positive value 0.62 and was statistically significant at 10 % probability level which implies that the higher assurance increases customer satisfaction and vice-versa. The restaurants having professional chefs, waiters are more efficient to deliver the higher level of customer satisfaction. The similar result was reported by the following studies (Sultana et al., 2016; Qin & Prybutok, 2009).
Sources of the Inefficiency among the Fast-Food Restaurants
The purpose of estimating the inefficiency model was to identify the sources of inefficiency or to show the relationship between efficiency and characteristics of the fast-food restaurants for the policy recommendation. Galawat & Yabe (2012) opined that the sign of the coefficient in the inefficiency model is very important in describing the obtained level of the efficiency score. A negative sign on the coefficient indicates that the variable had an effect to minimize inefficiency, while a positive coefficient means the effect of increasing the inefficiency.
The coefficient of the location was of-0.253 and found to affect the operational inefficiency for achieving customer satisfaction negatively at a 5% level of significance. The fast-food restaurants having a convenient location can reduce the inefficiency to achieve customer satisfaction than other vice-versa. The convenient location minimizes the search cost and transportation cost of the customer. As a result, the customers go to the restaurants frequently which increases the sale volume and ultimately create strong customer equity. Islam & Ullah (2010) and Xu et al., (2020) found the positive relationship between customer satisfaction and convenient location of the restaurants.
The unique recipe of the fast-food restaurant affected the operational inefficiency significantly at 1%probability level. This finding indicates that the restaurants with the unique recipe to create the different taste are more successful to secure higher customer satisfaction easily than the restaurants follow the conventional recipe. Hence, the unique recipe declines the operational inefficiency of the fast-food restaurant (Khan et al., 2013).
Similarly, the training of the staffs found to have a significant declining effect on operational inefficiency to achieve customer satisfaction. According to Chow et al. (2007) and Kanyan et al. (2016) training and development are essential for all of the staff in a restaurant because it improves the ability of staff to deliver high-quality service and to fulfil the requirements of customers more efficiently. The training also makes the staff more innovative and skilled which ultimately helps to deliver service with consistent quality.
After that, the coefficient of the brand popularity was of-0.314 and was statistically significant with operational inefficiency to ensure customer satisfaction at 10% probability level. The estimated result suggests the customers express the higher-level satisfaction to the well-known fast-food restaurant because the customers feel the higher level of the psychological benefit taking the food from the reputed restaurants. In addition, the well-known restaurants always try to improve the food and service quality which ultimately promotes the operational efficiency. That’s why brand popularity always influences customer satisfaction (Islam & Ullah, 2010; Khan et al., 2013).
Finally, the sale promotion strategy and schooling year of the staff found to affect the operational inefficiency negatively to achieve customer satisfaction but those were insignificant.
The frequency distribution of the fast-food restaurants’ specific efficiency score in Bangladesh, is presented in table 6. The finding illustrates that the operational efficiency score ranges from 47% to 100% with a mean efficiency of 77% which means fast food restaurants bellow by 23% from the customer satisfaction frontier. It is signaled from the result that the fast-food industry has failed to deliver the highest customer satisfaction due to the presence of the restaurant-specific characteristics. However, the least efficient fast-food restaurant should increase the efficiency score of 53% [(1.00 – 0.47/1.00) *100] by utilizing the existing resources available to the fast-food restaurants to be on the customer satisfaction frontier.
| Table 6 Efficiency Score | |||
| Range | Frequency | Percentage | Cumulative Percentage |
| 0.41-0.50 | 20.00 | 12.50 | 12.50 |
| 0.51-0.60 | 13.00 | 8.13 | 20.63 |
| 0.61-0.70 | 10.00 | 6.25 | 26.88 |
| 0.71- 0.80 | 34.00 | 21.25 | 48.13 |
| 0.81-0.9 | 51.00 | 31.88 | 80.00 |
| 0.91-1.00 | 32.00 | 20.00 | 100.00 |
| Total | 160.00 | 100.00 | 100.00 |
| Maximum | 1.00 | ||
| Minimum | 0.47 | ||
| Standard Deviation | 0.29 | ||
| Mean | 0.77 | ||
Policy Recommendation
As 50% population of Bangladesh is young who is less than 30 years old (world Bank, 2019) and this segment of the population is a customer of the fast-food and other restaurants because this group of people have better access to information technology and prefer to make a tour to the various corners of the world which leads them to be a global customer who tastes the commonly available fast-food items . In addition, people working in public and private sector also rely on fast-food instead of cooking at house. As a result, the fast-food industry in Bangladesh has been enjoying significant growth since early nineties and it has become one of the significant sectors of the Economy. Khurshid Irfan Chowdhury, Executive Director of Transcom Beverage Limited mentioned that the market value of the fast-food industry is going to be BDT 450 crores in 2020. As the fast-food market is highly potential in Bangladesh, few global fast-food brands like KFC, Pizza Hut, Burger King etc. along with lots of national fast-food company is doing business in various corners of the country profitably. The study found that the fast-food industry is not operating on the customer satisfaction frontier and restaurants has failed to ensure the highest level of customer satisfaction. That’s why the finding has suggested the following issues to improve the operational efficiency which will boost up the customer satisfaction level.
1. The study found that professional training of the staff reduced the inefficiency significantly. Although the fast-food and restaurant industry is increasing day by day in terms of market size, employment and contribution to GDP, there is no professional training arrangement for uneducated or less educated people working in the fast-food and restaurant industry. The government should set up professional training facilities for people working in restaurants or prepare manpower to work effectively and efficiently for maintaining the standard of fast-food to ensure the highest of customer satisfaction.
2. The study discovered the average schooling years of the staff working in the fast-food restaurants only 7.25 year which is too low in comparison to the neighboring countries. Due to lower schooling year, the staff do not understand the real need of the customers and behave as usual without caring for the customer as a guest. As a result, the fast-food restaurants should employ the people having professional experiences and higher schooling year with standard compensation packages.
Conclusion
Bangladesh is considered as the tiger economy in Asia due to the higher economic growth rate and recently the country has entered into the lower-middle-income group because of the development in standard of living and rise of disposable income. Due to the increasing economic activity, many foreign people are living in Bangladesh for their job in the public and private sectors. These foreign nationals are the customers of the national and global fast-food brands in Bangladesh. The customers of the fast-food restaurant industry are increasing rapidly because of the mass acceptance of fast-food by young people in Bangladesh and the continuous rise of foreign nationals in Bangladesh. But the study found that fast-food restaurants are not fully successful to ensure customer satisfaction optimally and 23% of expectations or demand of the customers remains unfulfilled. Only a few fast-food restaurants run on the customer satisfaction frontier. Given this situation, the fast-food restaurant should run efficiently and effectively to deliver the highest customer satisfaction if this industry wants to enjoy positive growth and contribute to our economy as one of the dominant sectors.
References
- Aigner, D., Lovell, C.K., & Schmidt, P. (1977). Formulation and estimation of stochastic frontier production function models. Journal of econometrics, 6(1), 21-37.
- Akbay, C., Tiryaki, G.Y., & Gul, A. (2007). Consumer characteristics influencing fast food consumption in Turkey. Food Control, 18(8), 904-913.
- Andaleeb, S.S., & Conway, C. (2006). Customer satisfaction in the restaurant industry: an examination of the transaction‐specific model. Journal of services marketing.
- Anderson, E.W., Fornell, C., & Lehmann, D. R. (1994). Customer satisfaction, market share, and profitability: Findings from Sweden. Journal of marketing, 58(3), 53-66.
- Chow, I.H.S., Lau, V.P., Lo, T.W.C., Sha, Z., & Yun, H. (2007). Service quality in restaurant operations in China: Decision-and experiential-oriented perspectives. International Journal of Hospitality Management, 26(3), 698-710.
- Coelli, T. (1996). A computer program for stochastic frontier production and cost function estimation. Department of Economics, University of New England, Armidale, Australia.
- Han, X., Xu, S., Xiong, Y., & Zhao, S. (2020,). The Relationship between Customer Satisfaction and Location of Restaurant. In Proceedings of the 2020 11th International Conference on E-Education, E-Business, E-Management, and E-Learning (pp. 385-395).
- Hansemark, O.C., & Albinsson, M. (2004). Customer satisfaction and retention: the experiences of individual employees. Managing Service Quality: An International Journal.
- Heskett, J.L., Sasser, Jr.W.E., & Schlesinger,L.A.(1997). Service Profit examination of the transaction specific model. Journal of Services Marketing, 20(1), pp.3-11.
- Hoyer, W.D., & MacInnis, D.J. (2001). Consumer Behaviour. 2nd ed., Boston: Houghton Mifflin Company. https://www.statista.com/statistics/252290/estimated-employment-of-the-us-quick-service-restaurant-industry
- Jun, M., & Cai, S. (2010). Examining the relationships between internal service quality and its dimensions, and internal customer satisfaction. Total Quality Management, 21(2), 205-223.
- Kannan, R. (2017). The impact of food quality on customer satisfaction and behavioural intentions: a study on Madurai restaurant. Innov. J. Bus. Manag, 34-37.
- Kant, R., & Jaiswal, D. (2017). The impact of perceived service quality dimensions on customer satisfaction. International Journal of Bank Marketing.
- Kanyana, A., Ngana, L., & Voonc, B.H. (2016). Improving the service operations of fast-food restaurants. Procedia-Social and Behavioral Sciences, 224, 190-198.
- Khan, S., Hussain, S.M., & Yaqoob, F. (2013). Determinants of customer satisfaction in fast food industry a study of fast-food restaurants Peshawar Pakistan. Studia commercialia Bratislavensia, 6(21), 56-65.
- Kumbhakar, S.C., & Lovell. A.K. (2000). Stochastic frontier analysis: an econometric approach. Cambridge University Press, Cambridge. 87-89.
- LaBarbera, P.A., & Mazursky, D. (1983). A longitudinal assessment of consumer satisfaction/dissatisfaction: the dynamic aspect of the cognitive process. Journal of Marketing Research, 20(4), 393-404.
- Lalnunthara, R., & Kumar, N. J. Demographic Profile and Consumption Patterns of Fast Foods among College Students in Lunglei Town, Mizoram.
- Lovell, C.K. (1993). Production frontiers and productive efficiency. The measurement of productive efficiency: Techniques and applications, 3, 67.
- Meeusen, W., & van Den Broeck, J. (1977). Efficiency estimation from Cobb-Douglas production functions with composed error. International Economic Review, 435-444.
- Oliver, R.L. (1980). A cognitive model of the antecedents and consequences of satisfaction decisions. Journal of Marketing Research, 17(4), 460-469.
- Parasuraman, A., Zeithaml, V., & Berry, L. (2002). SERVQUAL: a multiple-item scale for measuring consumer perceptions of service quality. Retailing: Critical Concepts, 64(1), 140.
- Parasuraman, A., Zeithaml, V., & Berry, L. (2002). SERVQUAL: a multiple-item scale for measuring consumer perceptions of service quality. Retailing: critical concepts, 64(1), 140.
- Parasuraman, A., Zeithaml, V.A., & Berry, L.L. (1994). Reassessment of expectations as a comparison standard in measuring service quality: implications for further research. Journal of marketing, 58(1), 111-124.
- Peng, L.S., & Moghavvemi, S. (2015). The dimension of service quality and its impact on customer satisfaction, trust, and loyalty: A case of Malaysian banks. Asian Journal of Business and Accounting, 8(2).
- Qin, H., & Prybutok, V.R. (2009). Service quality, customer satisfaction, and behavioral intentions in fast‐food restaurants. International Journal of Quality and Service Sciences.
- Ravichandran, K., Mani, B.T., Kumar, S.A., & Prabhakaran, S. (2010). Influence of service quality on customer satisfaction application of servqual model. International Journal of Business and Management, 5(4), 117.
- Ryu, K., Lee, H.R., & Kim, W.G. (2012). The influence of the quality of the physical environment, food, and service on restaurant image, customer perceived value, customer satisfaction, and behavioral intentions. International Journal of Contemporary Hospitality Management, 24(2), 200-223.
- Sabir, R.I., Irfan, M., Akhtar, N., Pervez, M.A., & Rehman, A. (2014). Customer satisfaction in the restaurant industry; examining the model in local industry perspective. Journal of Asian Business Strategy, 4(1), 18.
- Selvakumar, J.J. (2015). Impact of service quality on customer satisfaction in public sector and private sector banks. PURUSHARTHA-A journal of Management, Ethics and Spirituality, 8(1), 1-12.
- Shanka, M.S. (2012). Bank service quality, customer satisfaction and loyalty in Ethiopian banking sector. Journal of Business Administration and Management Sciences Research, 1(1), 001-009.
- Singh, S. (2006). Impact of color on marketing. Management decision.
- Sivadas, E., & Baker‐Prewitt, J.L. (2000). An examination of the relationship between service quality, customer satisfaction, and store loyalty. International Journal of Retail & Distribution Management.
- Suchánek, P., & Králová, M. (2015). Effect of customer satisfaction on company performance. Acta Universitatis Agriculturae et Silviculturae Mendelianae Brunensis, 63(3), 1013-1021.
- Sureshchandar, G.S., Rajendran, C., & Kamalanabhan, T.J. (2001). Customer perceptions of service quality: a critique. Total quality management, 12(1), 111-124.
- Sureshchandar, G.S., Rajendran, C., & Kamalanabhan, T.J. (2001). Customer perceptions of service quality: a critique. Total Quality Management, 12(1), 111-124.