Research Article: 2020 Vol: 24 Issue: 4
Impact of type Fonts on Branded Product Purchase in Sustainable Emerging Economies of African Region Evidence from Mauritius on a Gendered Based Study
Thanika Devi Juwaheer, University of Mauritius
Sharmila Pudaruth, University of Mauritius
Rajesh Sannegadu, University of Mauritius
Kooldeep Sahye, University of Mauritius
Abstract
The purpose of this paper is to explore the influence of type fonts on the purchase of branded products from a gendered point of view and whether type fonts used by brands can be utilized in brand re-gendering of a product in emerging economies. Four quantitative studies were conducted, collecting data from people aged 18 and above in Mauritius. In total, 150 valid questionnaires were used in the analysis of data using the statistical package for the social sciences. The results have revealed that brand femininity is associated with ‘script’ type fonts and brand masculinity is paired with ‘display’ type fonts in an emerging country such as Mauritius. Further outcomes of the research have indicated that product categories do not impact on type fonts being used for brands and consumers do not classify products in different genders based on their product category. Moreover, men and women are not much influenced by type fonts when purchasing and recommending products in emerging countries such as Mauritius. Finally, the results have also revealed that type fonts do not assist in brand re-gendering and more branding cues need to be altered to successfully change the existing brand gender perceptions of a product for emerging economies. This present research has several practical implications for brand managers and businesses and the way they communicate their brand gender using type fonts to customers of emerging countries in African region.
Keywords
COVID-19, Shopping Values, Shopping Intention, Shopping Attitude, Technology Acceptance Model (TAM), PLS-SEM Techniques.
Introduction
India is at the cusp of a digital revolution. The Internet has become an integral part of the growing urban Indian population. India is more than 1.3 billion people country with a mobile penetration of almost 80%. Today, the e-commerce industry is one of the fastest-growing sectors in India. E-commerce platforms are providing many advantages to the customers, such as: (1) it helps to compare one product with the competitive products based on price, colour, size and quality, (2) e-commerce shopping is available for customers around the clock compared to a traditional store, (3) it trims down the cost of product and service delivery and brings buyers and sellers together. In-spite of customers rarely have a chance to touch and feel product and service online before they make a decision; e-commerce sellers usually provide more product information that customers use during a purchase decision.
On the other hand, the novel coronavirus disease (COVID-19) pandemic has induced social and psychological disorder among peoples (Pera, 2020). Peoples are in different mindsets towards shopping except for daily needs (Mayer, 2020). The E-commerce market also witnessed the inevitable chaos and compulsive calm due to the prevailing novel coronavirus disease (COVID) lockdown restriction, particularly in India (Sanjanwala & Issac, 2020). The Ministry of Home Affairs ("MHA") had issued guidelines to limit the activities in the e-commerce sector during Lockdown 1.0 and Lockdown 2.0. These restrictions have been eased later phases of lockdown. The MHA guidelines issued on March 24, 2020 (further modified on March 25, 2020, March 26, 2020, and April 02, 2020) permitted delivery of essential goods such as food, groceries including hygiene products (as clarified on March 29, 2020), fruits and vegetables, dairy and milk products, meat and fish, animal fodder, seeds, fertilizers and pesticides, agriculture produce, drugs, pharmaceuticals, medical devices, their raw material and intermediaries during the lockdown by companies operating under e-commerce sector.
With more relaxation in later lockdown phases, the e-commerce sector has witnessed a high demand even in non-essential goods. Therefore, several e-commerce platforms have tied-up with entities to cope up with the increased demand. ITC Foods Limited has partnered with Dominos Pizza Inc., Flipkart tied up with Tata Consumer Products Limited, Spencer Retail Limited and Uber Technologies Inc. (Kang, 2020). In the same time, e-commerce companies are also facing several challenges to match the demand-supply chain in India. The mismanagement of logistics, understaffing of employees/labour, and continual demand of goods by customers have led to an uneven supply to the needy in time. As a measure to address these challenges, many e-commerce giants (e.g. Amazon etc.) have undertaken several steps like suspension of 6000 sellers for price surging and hiring additional 75,000 individuals to meet customer demand (ETech, 2020). The Government of India has further eased the restriction in Lockdown 3.0, Lockdown-4, Unlock-1, Unlock-2 and Unlock-3. This step was much needed not just from a convenience perspective; it helped sellers of non-essential goods and the e-commerce entities through increased sales.
The preventive health measures like social distancing during lockdown phases have increased hygiene consciousness among costumers. This will also have an impact on the way consumers will shop shortly. This would also result in an increased shift in consumers, particularly young consumers, buying from traditional shopping methods to shopping digitally. From the online shopping perspectives, e-commerce entities required to will adopt innovative ideas to meet the change in consumer behaviour during COVID-19 lockdown. Government of India also is providing impetus to the digital space by introducing guidelines to encourage more and more retail traders to use e-commerce platforms effectively (MyGov, 2020). COVID-19 already brought a sea change in not just day-to-day lives across the world but also in the way we shop. Hence with removal of restriction in e-commerce, the e-commerce industry may not only witness changes in the approach of customers in terms of buying pattern of such customers but also face challenges due to the after-effects of lockdown.
From the above discussion, the imposition of lockdown measures by the government makes people prefer online shopping over traditional shopping. So, understanding shopping attitude during and post COVID-19 would help e-commerce industries to push the online sellers. Studying online consumer shopping attitude, shopping intention, and shopping values are not new phenomena (Pera, 2020; George et al., 2020; Lim et al., 2014; Mutlu & Tufan, 2015; Umit & Ozan, 2015; ?brahim & Yavuz, 2016). But studying consumer behaviour towards online shopping during COVID-19 can help all the e-commerce stakeholders to make better strategies to increase profit and provide better shopping experiences to the consumers. Therefore, this study investigates the link between online consumer attitude, intention and the moderating effect of gender in uncertain COVID-19 environment.
Literature review
Two basic formats of shopping exist in today's shopping environment are store format and non-store format. Due to COVID-19 pandemic preventive measures, the Internet has become an effective means for carrying out commercial transactions online (Mayer, 2020; Pera, 2020; Sanjanwala & Issac, 2020). The main motivations for consumers to shop online during the COVID-19 are the personal safety along with other benefits like diversified selection, convenience, information, customization, interaction and time efficiency (Mayer, 2020; Pera, 2020). Globally, India is one the youngest online population and expected to continue in coming years. Understanding the nature of motivations, perceptions, attitudes, shopping values and intentions among young Indians during a pandemic are essential for all the stakeholders. But, from the past literature, it was evident that: (1) the relations between consumers shopping attitude, shopping values and shopping intention have not been explored in the pandemic situation like COVID-19; (2) the demographic factors and their relationship with different costumer behaviours have not been generalized so far due to conflicting results in the past studies (George, 2020; Al-Shukri & Udayanan, 2019; Hernández et al., 2011; Bridges & Florsheim, 2008). Therefore, a comprehensive study is required to understand how the shopping attitude, shopping values and shopping intention related to each other and varies with demographic factor like gender. Some of the essential characteristics of shopping behaviour are being discussed below.
Shopping Attitude
Consumer's attitude towards online shopping refers to their psychological state in terms of making purchases over the Internet. Huang & Liaw (2005) define online shopping attitude as "an individual's overall evaluation of online shopping as a way of shopping." Chiu et al. (2005) defined attitude towards online shopping as "a consumer's positive or negative evaluations, emotions, or action tendencies related to the purchasing behaviour on the internet". Yang & Wu (2007) indicate attitude towards online shopping is a significant predictor of online shopping intentions. Gender also plays an essential role in shopping attitude (George et al., 2020). According to Li et al. (1999), men have accepted the use of technology and favouring the Internet as a shopping intermediary compared to women. Awad & Ragowsky (2008) suggested that one of the main reasons for this is that men do not associate shopping with emotion. Women tend to look for a review of the product more than men before online purchasing. Doolin et al. (2005) had also confirmed the above findings. Men perceive the convenience and easiness of the process to be more valuable. The issues women have with online shopping are generally not applicable to men. Hasan (2010) believed that men are more engaged with online shopping is due to factors such as specific personal attributes, behaviours and attitudes. Dennis & McCall (2005) argued that men are engaged online because of the technological element. Zhou et al. (2007) suggested that there is a negative perception surrounding women and technology. It has been reported that women more than men are doubtful about the authenticity of online shopping and sometimes shy away from the unknown. Kaplan (2011) also suggested that the emergence of social networks has engaged more women in online shopping because of the availability of conversing, liking and giving feedback about products efficiently and effectively. Various past researchers have established that the relationship between consumers' online retail shopping attitudes and retail purchase intentions is moderated by gender (George et al., 2020; Arora & Aggarwal, 2018; Noble et al., 2009; Argo et al., 2006; Ng, 2004; Sengupta et al., 2002).
Utilitarian and Hedonic Shopping Values
According to Babin et al. (1994), hedonic and utilitarian outcomes affect many shopping activities. Therefore, there is an increasing need to assess consumers' perceptions of both utilitarian and hedonic shopping values. Some consumers see shopping at work and do not consider the entertaining aspect of shopping. Many consumers shop because they enjoy the activity. Such perspectives reflect utilitarianism and hedonism behaviour of shopping. The utilitarian perspective assumes the buyer as a logical problem solver (Sarkar, 2011). According to To et al. (2007), Utilitarian motivation emphasized whether the mission is completed or not. In online shopping literature, "perceived utilitarian value" is an important variable that affects online shopping intentions. Many researchers (Parasuraman & Grewal, 2000; Chiu et al., 2005; Hume, 2008) indicate that perceived utilitarian value has a positive relationship with the intention to purchase/repurchase. Several studies have observed that the perceived utilitarian value can affect an individual's need to seek alternatives. That means when the perceived value is low, customers can switch to other product/service providers (Anderson & Srinivasan, 2003; Chang, 2006), but when a purchase offers high level of perceived Utilitarian value, this will improve the future purchase and repurchase.
In contrast to the Utilitarian perspective, hedonic shopping value is viewed as a positive experience. Kim (2006) observed that in Utilitarian shopping activities, consumers enjoy an emotionally satisfying experience related to the shopping activity, regardless of whether or not a purchase is made. The hedonic aspect of shopping includes happiness, fantasy, awakening, sensuality, and enjoyment. If a consumer has a hedonic motivation, he or she receives benefits from the experiential and emotional aspects of shopping. Hirschman & Holbrook (1982) suggest that the utilitarian and hedonic buying models differ in four main areas: mental constructs, product classes, product usage, gender and individual differences. Various past studies have established the role of shopping attitude to determine shopping values; the influence of shopping values to predicts shopping intention; and the mediating role of gender (Chen et al., 2019; Nopnukulvised et al., 2019; Chung, 2015; Olsen & Skallerud, 2011).
Shopping Intention
Shopping intention defined as "consumers' willingness to purchase certain products or services from the online buying website" (Ailawadi et al., 2001). Purchase intention has been broadly used as a focal construct to indicate consumers' buying behaviour in market research (Yang & Mao, 2014). Purchase intention also can be defined as "the probability that customers will aim or be disposed to buy any product and service later" (Wu et al., 2011). According to Huang & Su (2011),
"consumers' purchase intention can be classified as a part of a consumers' cognitive behaviour that discloses the way of a person is expected to purchase any specific product".
Moreover, measurement of purchase intention indicates future purchasing behaviour of customer (Grewal et al., 1998). The results of the purchase intention are used to predict the demand for new products. Bai et al. (2008) stated that final purchasing behaviour could be derived from consumer intention. Therefore, it is essential to understand the purchase intention. Currently, online sellers are not only focusing on convincing consumers to use the websites that sell their goods but also influencing the consumers to repeat purchasing their products through the channels (Chiu et al., 2012; Raman, 2019).
According to He et al. (2008) the main barrier to the growth of the online business is the lack of consumer intention to shop online. According to the theory of planned behaviour (TPB), it indicates that the intention to do online shopping is mostly affected by the consumers' behaviour and the behaviour from the people around them. Moreover, Jamil & Mat (2011) also presented that consumers purchase intention positively affects the expected online purchasing response. In different researches, the attitude toward online shopping had a significant effected on online purchase (Limayem et al., 2000). Various other studies also supported the same results for the relationship between attitude and online shopping intentions (Arora & Aggarwal, 2018). Many researchers argue that, although the attitude is a good proxy for measuring intention but still different external variables like gender influence the intention of a person to perform the behaviour (George et al., 2020; Arora & Aggarwal, 2018).
Many scholars explained the interrelation between shopping attitude, shopping values and shopping intention using different theories. Davis (1986; 1989) introduced the Technology Acceptance Model (TAM), which is based on the Theory of Reasoned Action (TRA). The Technology Acceptance Model (TAM) assumes technological acceptance/adoption/intention of individuals in online shopping. Some scholars (e.g. Rafique et al., 2020; Portz et al., 2019; Sun & Zhang, 2006) accept TAM as one of the most successful theories for analyzing technology acceptance of individuals relating attitude and intention-behaviour. Many of the have used the TAM by extending the theory with new dimensions studies (Rafique et al., 2020; Ha & Stoel, 2009).
The conceptual framework guides the researchers in determining the result and the statistical relationship that will be examined between the dependent variable and independent variables. Figure 1 depicted the proposed theoretical framework based on the basic principle of TAM and consumer value theory. The conceptual framework is proposed to identify the significant relationship between independent and dependent variables (e.g. shopping intention, shopping values and shopping intention). It also showed the moderating effect of gender on the relationship between shopping attitude, shopping value and shopping intention during COVID-19.

Figure 1: Conceptual Model
Research Methodology
Based on the proposed theoretical framework (Figure 1) and understanding from the past literatures, the following research hypothesis are proposed:
H1: Online shopping attitude has a statistically significant influence on utilitarian online shopping value.
H2: Online shopping attitude has a statistically significant influence on hedonic online shopping value.
H3: Gender significantly moderates the relation between attitude and utilitarian online shopping values
H4: Gender significantly moderates the relation between attitude and hedonic online shopping values
H5: Utilitarian online shopping value has a statistically significant influence on online shopping intention.
H6: Gender significantly moderate the relationship between Utilitarian shopping value and shopping intention
H7: Hedonic online shopping value has a statistically significant influence on online shopping intention.
H8: Gender significantly moderates the relationship between Hedonic shopping value and shopping intention.
H9: Shopping attitude significantly affects shopping intention.
H10: Gender significantly moderates the relationship between shopping attitude and shopping intention.
Sample
Theoretically, the population of this study consists of the online student shopper who is between 21-28 years old. A survey was conducted during April 01, 2020, to July 31 2020, among postgraduate business management students in different universities and institutions from central India to test the proposed framework using stratified sampling. Only those students who indicated they had used the online platform for shopping more than two years are considered for further analysis. Initially, a total of 360 responses were collected, and 316 were found suitable for further analysis. Demographics of the respondents revealed that 146 are female, and 170 are male (Table 1).
| Table 1: Demographic Information Of Sample | |||
| Attribute | Characteristics | N | (%) |
|---|---|---|---|
| Gender | Male | 170 | 58 |
| Female | 146 | 42 | |
| Academic Background | Technical | 180 | 54 |
| Non-Technical | 136 | 46 | |
Source: Author
Results
A self-administered questionnaire was used for this research to obtain data. The questionnaire was carefully designed in English to meet the requirements of the research. It was divided into two sections. The first section covered demographic information (gender, academic background, and online spending per month, online shopping experience). Section-2 contained twenty-five items measuring different independent and dependent variables used in the proposed model. The questionnaire is comprised of items related to online shopping attitude, shopping satisfaction and online shopping intention. The items are taken from previous literature, and some were self-structured to cover the diversity of the research problem. Consumers' attitude towards online shopping is measured with five item questions developed by (Ranganathan, & Ganapathy, 2002). The online shopping intention is measured by 4 item questions developed by (Zarrad & Debabi, 2012). Utilitarian shopping values (six items) and Hedonic shopping values (ten items) are measured by the scales developed by (Babin et al., 1994; O'Brien, 2010). The five-point Likert scale ranged from (1) 'Strongly disagree' to (5) 'Strongly agree' is employed in this study. A pilot study was conducted on a small number of respondents (20) to assess the possibility of misinterpretation as well as any spelling or grammatical errors. The suggestions were subsequently incorporated into the final questionnaire.
Structural Equation Modeling (SEM) techniques are used to test the proposed model. SEM recently has gained popularity among researchers due to its flexibility and generality. The research hypotheses of this study are analyzed using Partial Least Squares (PLS) Structural Equations Modelling (PLS-SEM). PLS-SEM is a second-generation structural equation modelling technique developed by (Word, 1974). PLS-SEM has significant advantages over other SEM techniques in different ways (Hair et al., 2014). First, PLS-SEM works efficiently with small sample sizes and complex models. PLS-SEM makes no distributional assumptions (normal distribution) about underlying data. Second, PLS-SEM can easily handle reflective and formative measurement models, as well as single-item constructs, with no identification problems. Third, PLS-SEM provides more accurate estimates of moderation and mediation effects. Finally, PLS-SEM has higher statistical power in parameter estimation than other structural equations modelling techniques (Chin, 1998; Henseler et al., 2009). Due to the features mentioned above, PLS-SEM analysis method was preferred over regression-based techniques to test research hypotheses in this research model. R packages plspm (Sanches et al., 2015) and semPLS (Monecke, 2013) is used to obtain results in the study. Confirmatory Factor Analysis (CFA), Discriminant Validity, Path Analysis, and Chi-Square test are carried out in this study.
Confirmatory Factor Analysis (CFA) is a special form of factor analysis, most commonly used in social science research. It is the extended analysis of Exploratory Factor Analysis (EFA) and used to test whether measures of a construct consistent with a researcher's understanding of the nature of that construct (or factor). As such, the objective of the confirmatory factor analysis is to test whether the data fit a hypothesized measurement model. Model fit measures could then be obtained to assess how well the proposed model captured the covariance between all the items or measures in the model (Zainudin, 2012). All redundant items exist in a latent construct were either removed or constrained. The detailed of the model fitness estimations were presented in Table 2.
| Table 2: Pooled CFA and Discriminant Validity | |||||
| Construct | Item | Factor Loading | Cronbach Alpha | CR | AVE |
|---|---|---|---|---|---|
| Shopping Attitude | ATT1 | 0.71 | 0.71 | 0.72 | 0.56 |
| ATT2 | 0.77 | ||||
| ATT3 | 0.79 | ||||
| ATT4 | 0.69 | ||||
| ATT5 | 0.67 | ||||
| Shopping Intention | SI1 | 0.75 | 0.76 | 0.75 | 0.57 |
| SI2 | 0.76 | ||||
| SI3 | 0.79 | ||||
| SI4 | 0.76 | ||||
| Utilitarian Shopping Value | USV1 | 0.66 | 0.71 | 0.70 | 0.53 |
| USV2 | 0.67 | ||||
| USV3 | 0.66 | ||||
| USV4 | 0.69 | ||||
| USV5 | 0.65 | ||||
| USV6 | 0.66 | ||||
| Hedonic Shopping Value | HSV1 | 0.66 | 0.72 | 0.73 | 0.55 |
| HSV2 | 0.71 | ||||
| HSV3 | 0.76 | ||||
| HSV4 | 0.72 | ||||
| HSV5 | 0.69 | ||||
| HSV6 | 0.74 | ||||
| HSV7 | 0.65 | ||||
| HSV8 | 0.64 | ||||
| HSV9 | 0.69 | ||||
| HSV10 | 0.65 | ||||
Source: author
The other essential techniques used in this research was discriminant validity. Discriminant validity is the degree to which scores on a test do not correlate with scores from other tests that are not designed to assess the same construct. Correlation coefficients between measures of a construct and measures of conceptually different constructs are usually given as evidence of discriminant validity. If the correlation coefficient is high (>0.85), then the discriminant validity is considered weak (depending on the theoretical relationship and the magnitude of the coefficient). On the other hand, if the correlations are low to moderate, this demonstrates that the measure has discriminant validity. However, this threshold may be meaningless if the correlation matrix and square root of Average Variances Extracted (AVE) do not meet the requirement, especially during the implementation of the second-order construct in CFA. The detailed of CFA and discriminant validity is shown in Table 2.
The table above Table 2 showed the Factor Loading, Cronbach Alpha, Composite Reliability (CR) and Average Variance Extracted (AVE) values for all latent constructs after Pooled CFA. All constructs have achieved the minimum estimation required, i.e. 0.70(Cronbach Alpha), 0.60 (CR) and 0.50 (AVE). Therefore, it is concluded that Convergent Validity (AVE > 0.5), Internal Reliability (Cronbach Alpha > 0.7) and Construct Reliability (CR> 0.6) of all constructs are achieved. Therefore, the proposed model is good enough for further analysis.
Further, to verify the discriminant validity of constructs used in the proposed model, the detailed analysis is conducted and shown in Table 3.
| Table 3: Detailed Discriminant Analysis | ||||
| Construct | Shopping Attitude | Shopping Intention | Utilitarian Shopping Value | Hedonic Shopping Value |
|---|---|---|---|---|
| Shopping Attitude | 0.748 | |||
| Shopping Intention | 0.71 | 0.754 | ||
| Utilitarian Shopping Value | 0.67 | 0.65 | 0.728 | |
| Hedonic Shopping Value | 0.68 | 0.66 | 0.62 | 0.741 |
Source: author
From Table 3, it is found that all latent exogenous constructs are correlated with the correlation strength of less than 0.85. Therefore, the discriminant validity is achieved, and all latent exogenous constructs are kept in the full model. The diagonal values (in bold) are the square root of AVE (Table 3). The discriminant validity is generally achieved when a diagonal value (in bold) is higher than the values in its row and column. From the above result, it is concluded that the discriminant validity for all constructs is achieved. Finally, the fitness index of the model is presented in Table 4.
| Table 4: Model Fitness Indexes | |
| Model Indices | Values |
|---|---|
| Chi-square/degrees of freedom | 1.8 |
| Goodness-of-fit index (GFI) | 0.95 |
| Adjusted goodness-of-fit index (AGFI) | 0.91 |
| Normed fit index (NFI) | 0.94 |
| Tucker–Lewis index (TLI) | 0.95 |
| Comparative fit index (CFI) | 0.96 |
| Root mean square error of approximation (RMSEA) | 0.06 |
Source: author
Table 4 shows that all fitness indexes values have achieved the required level (Hair et al., 2014). Therefore, the model is good enough for further analysis.
Structural Model Assessment
After confirming the reliability and validity of the proposed constructs, the next step is to evaluate the structural model results. It involves examining the model's predictive capabilities and the relationships between the constructs. According to Hair et al. (2014), the key criteria for evaluating the structural model are the significance of path coefficient, the level of R2 values, the f2 effect size, the predictive relevance (Q2), and Q2 effect size. After running the PLS-SEM algorithm, the path coefficients estimates are obtained for the structural model relationships. The path coefficients and statistical significance are obtained utilizing the bootstrapping. Besides, to assess the model's predictive relevance, Stone-Geisser's Q2 values are also obtained by using the blindfolding procedure. Tables 5 and 6 show the results of the hypothesis testing, structural relationships, p-value, and Stone-Geisser's Q2 values.
| Table 5: PLS Results For Structural Model And Hypothesis Testing | ||||||
| Path | Path Coefficients | Std. Error | T-statistics* | P-value | Hypothesis | Decisions |
|---|---|---|---|---|---|---|
| SA→ UV | 0.67 | 0.06 | 4.67 | 0.00 | H1 | Accepted |
| SA→HV | 0.59 | 0.07 | 3.89 | 0.01 | H2 | Accepted |
| UV→SI | 0.47 | 0.05 | 6.34 | 0.02 | H5 | Accepted |
| HV→SI | 0.53 | 0.09 | 5.89 | 0.00 | H7 | Accepted |
| SA→SI | 0.52 | 0.02 | 5.17 | 0.00 | H9 | Accepted |
* t-values for two-tailed test: 1.65 (sig.level 10%), 1.96 (sig.level 5%), 2.58 (sig.level 1%).
Source: author
| Table 6: PLS Results For Endogenous Latent Constructs R2 And Q2 | |||
| Endogenous Latent Constructs | R2 | Q2 | Effect Size |
|---|---|---|---|
| SA | 0.51 | 0.46 | Large |
| UV | 0.46 | 0.34 | Medium |
| HV | 0.49 | 0.31 | Medium |
| SI | 0.52 | 0.41 | Large |
*Assessing predictive relevance (Q2) value of the effect size: 0.02= Small, 0.15= Medium, 0.35= Large. Source: author
According to the obtained results (Table 5), the shopping attitude had a positive and statistically significant effect on the Utilitarian shopping value (β=0.67, P<0.01). This result empirically supported Hypothesis 1. Also, the shopping attitude has a positive and statistically significant effect on hedonic shopping value (β=0.59, P<0.05). This result empirically supported Hypothesis 2. The result is also revealed that the perceived utilitarian value construct has a positive and statistically significant effect on online shopping intentions (β=0.47, P<0.05). Hence empirically supported Hypothesis 5. Furthermore, the perceived hedonic value construct has a positive and statistically significant effect on online shopping intentions (β=0.53, P<0.01). Thus Hypothesis 7 is found valid. Finally, the online shopping attitude has a positive and statistically significant effect on online shopping intentions construct (β=0.52, P<0.01). So, the result of empirically supported Hypothesis 9. Similar findings were reported by various researchers (Mutlu & Tufan, 2015; Arpita & Sapna, 2011; Teo & Liu, 2007; Reynalds & Arnold, 2006; Anderson & Srinivasan, 2003; Devaraj et al., 2003) in their studies. In contrary, Umit & Ozan (2015) showed no significant relationship between Utilitarian value and buying intention.
Further, to examine the predictive strength of the relationship between the dependent and independent variables, the coefficient of determination (R2) values are considered (Hair et al., 2014). This coefficient is a measure of the model's predictive accuracy. The R2 value represents the amount of explained variance of the endogenous constructs in the structural model. In general, the R2 values of 0.75, 0.50, and 0.25 for the endogenous constructs can be considered substantial, moderate, and weak, respectively (Hair et al., 2014). The R2 values of Online Shopping Attitude (0.51), Online Shopping Intentions (0.52) is considered large, while the R2 value of Hedonic Online Shopping Value (0.49) and Utilitarian value (0.46) are moderate (Table 6). The R2 values of endogenous latent variables are range from 0.46 to 0.52, which indicates the model's predictive accuracy.
Again, Stone-Geisser's Q2 values are also examined to assess the model's predictive relevance. Q2 value more than zero for a specific reflective endogenous latent variable indicates the model's predictive relevance for a particular construct. Table 7 shows the results of Stone-Geisser's (Q2) values for endogenous constructs using the blindfolding procedure. The predictive relevance (Q2) values of Online Shopping Attitude (0.46) and Online Shopping Intentions (0.41) are considered as a large effect size. Utilitarian Online Shopping Value (0.34) is considered a medium effect size, and Hedonic Online Shopping Value (0.31) is considered a medium effect size (Hair et al., 2014). From the above results, it is observed that the Q2 values of all the endogenous latent variables are above zero (ranging from 0.31 to 0.46), which supports the model's predictive relevance for the endogenous constructs.
| Table 7: Bootstrap Analysis For The Overall Sample | |||
| Overall Sample | Original Sample (O) | Sample Mean (M) | Standard Error (STERR) |
|---|---|---|---|
| SA→ UV | 0.171 | 0.179 | 0.125 |
| SA→HV | 0.161 | 0.163 | 0.119 |
| UV→SI | 0.156 | 0.161 | 0.110 |
| HV→SI | 0.143 | 0.144 | 0.109 |
| SA→SI | 0.182 | 0.184 | 0.131 |
Source: author
Moderation Effect
According to Preacher et al. (2007), moderation occurs when the strength of the relationship between two variables is dependent on a third variable. Moderator (W), interacts with X in predicting Y if the regression weight of Y on X varies as a function of W. Moderation is typically assessed with the regression equation:
Y = a0 + a1 X + a2 W + a3 XW + r (1)
Where W is considered the moderator, the above equation may be expressed as
Y = (a0 + a2 W) + (a1 + a3 W) X + r (2)
Equation (2) shows how the simple slope of Y regressed on X. (a1 + a3 W) is the function of the moderator. T-statistics was used to calculate the difference in paths between groups of the sample. In this study, the equal variance of the t-test is implemented. The equation (3), shows the formula to calculate t statistics.
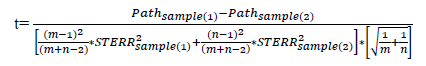 (3)
(3)
Where:
m = number of samples 1
n = number of samples 2
Pathsample (i)= sample mean for i group(s)
STERRsample (i)= the square of standard error for i groups(s)
The best fit model for all samples is analyzed using CFA, Discriminant Analysis and Path Analysis. In this study, Pooled CFA is used. For moderation analysis, first, the data is divided into two groups (i.e. male and female groups). Following the above step, the Bootstrap Analysis is applied to the overall, male and female samples separately. The difference of results before and after the data separation is recorded. The sample size, the sample mean (M) and sample standard error (STERR) for male and female samples are determined for moderation analysis. The t-statistics are also determined based on the procedure suggested by (Chin, 2000).
Table 7 shows the original sample (O), sample (M) and standard error (STERR) for the overall sample. The values presented in the Table 7 describes the path coefficients for the overall sample without including the heterogeneity factor existing in the model.
Table 8 shows the original sample (O), sample (M) and standard error (STERR) for male. From the results, it can be observed that the scores obtained for the male sample are different from the overall sample. Taking sample mean (M) scores into consideration for prior analysis, scores for all exogenous latent constructs for male sample compared to overall sample are: 0.119 < 0.179 (SA→ UV), 0.169 > 0.163 (SA→HV), 0.111< 0.161 (UV→SI), 0.114 < 0.144 (HV→SI) and 0.108< 0.184 (SA→SI).
| Table 8: Path Coefficient For Male | |||
| Overall Sample | Original Sample (O) | Sample Mean (M) | Standard Error (STERR) |
|---|---|---|---|
| SA→ UV | 0.110 | 0.119 | 0.102 |
| SA→HV | 0.163 | 0.169 | 0.112 |
| UV→SI | 0.106 | 0.111 | 0.104 |
| HV→SI | 0.103 | 0.114 | 0.097 |
| SA→SI | 0.122 | 0.108 | 0.114 |
Source: author
Table 9 shows the original sample (O), the sample mean (M) and standard error (STERR) for female samples. It can be seen that the scores obtained for the female sample are different from the overall sample. Taking sample mean (M) scores into consideration, scores for all exogenous latent constructs for female sample compared to overall sample are: 0.117 < 0.179 (SA→ UV), 0.141< 0.163 (SA→HV), 0.112 < 0.161 (UV→SI), 0.115< 0.144 (HV→SI) and 0.109< 0.184 (SA→SI). Substituting the values of Sample Mean (M) and Standard Error (STERR) of Path Coefficient of male and female samples into equation (1), (2) and (3), the significance of path coefficients is presented in Table 10.
| Table 9: Path Coefficient for female | |||
| Overall Sample | Original Sample(O) | Sample Mean(M) | Standard Error (STERR) |
|---|---|---|---|
| SA→ UV | 0.115 | 0.117 | 0.112 |
| SA→HV | 0.171 | 0.141 | 0.103 |
| UV→SI | 0.113 | 0.112 | 0.109 |
| HV→SI | 0.112 | 0.115 | 0.102 |
| SA→SI | 0.123 | 0.109 | 0.107 |
Source: author
| Table 10: Significance Of Path Coefficient Difference | ||
| t- statistics | Hypothesis Decisions | |
|---|---|---|
| SA→ UV | 1.06 | H3 Rejected |
| SA→HV | 1.11 | H4 Rejected |
| UV→SI | 0.89 | H6 Rejected |
| HV→SI | 1.14 | H8 Rejected |
| SA→SI | 2.01 | H10 Accepted |
Source: author
The t-values of all exogenous latent constructs toward endogenous latent construct (i.e. SA→ UV, SA→HV, UV→SI, HV→SI) are less than 1.96 (Table 10). So, moderation effects are not significant. Hence H3, H4, H6 and H8 are rejected. But the significance moderation effect (t=2.01) is observed for the relation (SA→SI). That is gender plays a significant moderation role in the relationship between shopping attitude and shopping intention. Thus hypothesis (H10) is accepted.
Discussion
Theoretical Foundation
In today's digital economy, the Internet has become an essential tool for online purchasing. Online retailers are trying to influence consumers' shopping attitude and behaviour by creating an enhanced shopping experience. But the COVID-19 pandemic has induced fear among e-shoppers, particularly among young people. Firstly, due to the contagious nature of the virus, as the COVID-19 virus can live on packaging surfaces from three hours to up to three days, depending on the packaging material. Secondly, the delay in delivery of the products due to lockdown measures taken by the authorities is another concern among costumers. At the same time, people's are reluctant to go out due to the lockdown measures and fear, therefore mostly preferring online shopping. All of the above factors have primarily influenced shopping behaviour among shoppers. Therefore, the present study is designated to reassess the antecedents of consumer online shopping intention during COVID-19 lockdown. This study extended the existing Technology Acceptance Model (TAM) and consumer value theory, by including consumer utilitarian and hedonic value, shopping attitude to determine the effects of consumer' perceived online shopping intentions during COVID-19. The results found in this research provided strong support for the proposed research model of online shopping intentions even during COVID-19. The results revealed that the perceived online shopping attitude significantly determine the consumer perceived utilitarian and hedonic value. Again, consumers' perceived utilitarian and hedonic value significantly determines the consumers shopping intention. The results are consistent with the findings of previous research on online shopping intentions (e.g., Lim, 2015; Teo & Liu, 2007). Therefore, to improve consumer perceptions of utilitarian value during COVID-19, online retailers must provide the consumers' a more diversified products selection at a lower cost, quick access to large volumes of product and service information, and a more comfortable and convenient shopping environment. Further, during COVID-19 pandemic, consumers are demanding more pleasure and entertainment from the online retailer beyond the utilitarian value. Hence, this study suggests that to improve consumer perceptions of utilitarian value, online retailers must provide consumers with the more pleasurable shopping experience with utmost care. Furthermore, the results also revealed that the perceived hedonic value, online shopping attitude and perceived utilitarian value are significant determinants of consumer Intention. The findings are consistent with the findings of previous research on online customer shopping or repurchasing intentions (e.g., Anderson & Srinivasan, 2003; Devaraj et al., 2003; Reynalds & Arnold, 2006). Hence, this study suggests that to generate online shopping intentions and to ensure consumers continue to shop from online retailers, the service providers must satisfy customers' expectations and generate high-level utilitarian and hedonic value during the pandemic.
Role of Gender
This study also observed the difference in online shopping intention among male and female during COVID-19. Recently, Mayer (2020) found a significant impact of gender on shopping behaviour during COVID-19. The study showed that the shopping behaviour of male impacted more by COVID-9 than female. It was also observed that men prefer online shopping, avoiding in-store shopping more than women. Lim & Rashad (2014) also found similar results in their research in the non-pandemic situation. They found that the consumer attitude, which influences future intentions of online purchasing, is different concerning gender. According to Hernandez et al. (2010), females are less likely to change their future intentions in comparison to males. However, according to Garbarino & Strahilevitz (2004), females more easily changed their perceptions than males because of various factors like their friend's recommendation and suggestion etc. On the other hand, males showed a higher intention of online purchasing after they purchased online (George, 2020; Fang, 2016; Hernandez et al., 2010). Therefore, it was observed that there was no difference in shopping intentions among male and female before and during COVID-19 pandemic.
Contributions and Implications
Concerning the theoretical academic contribution, this study whilst contributing to a growing body of work on online shopping behaviour offers a diverse perspective on the different factors that trigger the usage and adoption of Internet shopping during the pandemic situation. Additionally, with the continuous growth of Internet use and adoption during COVID-19, a review of Internet shopping specific concepts or factors (stimuli) would offer a better explanation of online shopping intention. On the other hand, Asia e-commerce continues its rapid expansion in the last few years. The e-commerce sales forecast for Asian region is projecting an annual average increase of 14% estimated over the term (2020-2022). Asia provides investors with a large consumer base, favourable young adult demographics and growth in consumer spending. India's e-commerce market is also growing at a CAGR of 30% for gross merchandise value (Chandra, 2020). But India has a lot of potentials to boost e-commerce value further. Therefore, all the stakeholders should create a conducive environment based on the finding of this study to attract more young e-shoppers during and post COVID-19. The finding of this study has shown that the consumer's attitudes, which influences future intentions of online purchasing, are different vis-à-vis gender. Hence, all stakeholders should formulate different strategies to attract male and female shoppers separately.
The Strength, Weaknesses, Opportunities and Threats of e-commerce due to COVID-19 pandemic are presented below:
- Strengths: Due to the announcement of lockdown measures by the authorities, all the physical stores were closed. Therefore, e-commerce platforms provide an alternative source of shopping for the peoples.
- Weaknesses: Security is the biggest challenge into the progress of e-commerce even during COVID-19. The customer always found themselves insecure, especially about the integrity of the payment gateways and process. During COVID-19 lockdown, the product delivery takes longer due to the shortage of staffs and unavailability of transportation facilities. Only a limited number of products and their varieties are provided due to closure of factories and supply chain.
- Opportunities: During COVID-19, peoples don't want to go out for shopping due to fear and lockdown down restrictions. So, e-shopping remains only alternatives to meet people’s needs. It is an opportunity for e-commerce stakeholders to increase e-commerce penetration in India.
- Threats: During COVID-19 pandemic lockdown, the only threat to e-commerce is a fake and fraud e-commerce portal, which can affect the peoples' faith in e-shopping.
Conclusion, Limitations and Future Directions
As peoples around the globe embraced social distancing as a way to slow the spread of the COVID-19 pandemic, there has naturally been a drop-off in brick-and-mortar shopping. That would seem to increase online shopping activities. To understand the antecedent of online shopping intention, this study successfully extended the technology acceptance model (TAM) and consumer value theory in the context of online shopping. The analyses result provided strong support for the proposed research model of online shopping intentions during COVID-19. Finally, analysis of the findings suggested that consumer beliefs, attitudes toward online shopping, perceived hedonic and utilitarian value to explain consumer online shopping intentions even during COVID-19.
The findings of this study give some useful insights into the consumers' online shopping intentions during COVID-19. However, the results of this study should be viewed with some limitations. First, the data were obtained only from central India, which may lead to sampling bias. Therefore, future research should extend this study to pan India, having different societies and cultures. Secondly, the antecedents of online shopping intentions explained a significant amount of its variance in this research model. Still, other important factors during COVID-19 (e.g. such as consumers shopping satisfaction, consumer perceived risk and trust dimensions), which have not been included in the model, may help to explain online shopping intentions better. Concerning these considerations, the results of this study will provide a useful source for further research study.
References
Keywords
Brand Gender, Type Fonts, Product Purchase, Brand Re-gendering, Branding Strategies.
Paper Type
Research paper.
Introduction
Brand gender forms part of brand personality which consists of two dimensions: brand masculinity and brand femininity – and describes gender traits that consumers associate with brands (Grohmann, 2009; Grohmann et al., 2013). Brand gender is important for brand managers for two main reasons: firstly: brands use masculine/feminine cues to express their masculinity/femininity and enhance the relationship they have with their consumers (Fournier, 1998). Secondly, brand positioning with regards to brand gender is an important strategy in many product categories in which consumers are segmented as per their gender (Grohmann, 2009; Grohmann et al., 2013; Lieven et al., 2019).
International Context
Type fonts (which form part of brand design) are a crucial element to consider when planning brand gender positioning strategies as they add to competitive advantage, promote brand recognition and recall, influence brand personality and works with other brand design components such as colours, pictures and layouts as clearly specified in several studies carried out in an international contexts (Childers, 2002; Brumberger, 2003; Doyle, 2004, Grohmann et al., 2013; Evans, 2014; Puškarevi? et al., 2014; Lieven et al., 2019). Type fonts are important brand cues as they can influence people’s behavior and promote positive attitudes towards a brand, event, cause or service (Haenschen, 2019). European consumers seek products which are congruent to their gender and previous studies have suggest that brands using gender-congruent type fonts enjoyed better success in several international contexts (Thangaraj, 2004; Grohmann et al., 2013; Peate, 2018; Lieven et al., 2019). Lieven et al. (2015) have narrowed down brand gender perceptions when using type fonts and classified them into highly feminine, feminine, neutral, masculine, highly masculine and stated that type fonts influence brand emotion such as excitement, sincerity and sophistication as outlined in another research study conducted by (Henderson et al., 2004).
African Context
With globalization happening at a fast pace, many firms and businesses from emerging countries are having better chance to develop their brand positioning. It has been that by 2025, 85% of the global economic growth will come from emerging economies such as African and Asian countries (Coffie, 2018), the recent global pandemic has made it very difficult for emerging African economies to meet their prior expectation while having sustainable growth. The Global Economic Prospects Anon, (2020) has suggested that emerging market and developing countries will face major economic challenges from various sectors: weak healthcare systems, decrease in foreign trade and tourism, subdued capital flows, tight financial conditions and lower purchasing power amongst others. Along these lines, businesses operating in emerging African economies are in a more vulnerable position for sustainable growth or development. In a similar vein, there is no research on the influence of type fonts on product purchases from a gendered perspective for emerging economies. This research represents one of the pioneer studies that is addressing this research gap in gendered brand purchases for emerging states in African context.
Sheth & Sinha (2015) identified four critical skills that businesses will need to favour to ensure competitive positioning of their brands on the market which are 1) collaborations – the ability to collaborate with every stakeholders to ensure the brand perceptions are seen in a similar light across all platforms and communication, 2) network building – the ability to develop long-lasting relationship with key partners in foreign countries or locally who can help promote the brand and ensure sustainable development, 3) patience – the ability to take time to research and understand the market in which the business is operating in to better position the brand and leverage sustainable growth, and 4) practice – the ability to realize that branding is not a one-shoe-fits-all process and should constantly be revised to adapt to new situations.
Based on the importance of brand gender and type fonts for consumers’ self-expression, it is crucial for brand managers of emerging African countries to know how to go about designing brands that convey the right brand gender. The main objective of this paper is to investigate whether type fonts affect consumers’ perceptions of brand gender in situation when consumers are not familiar with a brand name (for instance, newly introduced products) and may have little information to classify the brand with a specific brand gender which could ultimately influence product purchase. Specifically, the objectives are as follows:
1. To find out whether type fonts influence gender perception of brands.
2. To investigate whether type fonts affect product purchase and recommendation of products by men and women.
3. To analyze whether type fonts can assist in the brand re-gendering (changing the initial brand gendered perception of a product or service) of a product or service.
To measure each of these objectives, four quantitative studies were carried with 150 respondents using quota sampling to avoid any biases. The first study investigates whether type fonts affect brand gender perceptions when consumers are exposed to unfamiliar brands and have only the brand type font to make up their perception. Results show that when exposed to brand names with different type fonts, consumers classify brand gender inferences on the brand’s appearance using type fonts as their guide. In study 2, consumers are provided with a little information about the brand (i.e., product category) and they still relied on type fonts when judging brand gender. Study 3 aims to understand product purchase from a gender perception view by asking consumers to choose the brands they would buy from by taking into consideration the type font of the brand. Results show that consumers are typically not influence by type fonts when purchasing products. The final study analyzed whether brand re-gendering is possible by changing the type font of an existing brand name.
This research seeks to contribute to the literature by (1) examining consumers’ processes to determine and classify brand gender based on appearance cues (type fonts); (2) adding to the research of type fonts, brand gender perceptions and product purchase; (3) investigating the influence of type fonts in a variety of contexts (i.e., limited information about the brand in Study 1, existing brand information in Study 2, product purchase and recommendation to other consumers based on type fonts in Study 3 and type fonts contributions to brand re-gendering in Study 4) that adds to previous studies and by (4) considering the effects of type fonts to increase the generalizability of findings and its applicability in branding practice.
Theoretical Background
Brand Personality Based on Appearance
Brand personality is the human traits (i.e., caring, funny, trustworthy, creative, adventurous and more) that consumers associate with a brand. Aaker (1997) identified four main types of brand personality models (sincerity, excitement, ruggedness and sophistication), and Machado (2018) associated different aspects to brand personality such as target market, brand values, brand name and logo, quantity and variety of product offered to each targeted gender, brand style and product design, intrinsic product characteristics, product category, people representing the brand, and advertising methods. In terms of brand gender perception, Grohmann (2009) further states that the spokesperson representing the brand influences the brand gender perceptions and personality.
Brand gender forms part of brand personality which consists of 2 dimensions: brand masculinity and brand femininity (Grohmann, 2009). Ulrich (2011) came up with 6 dimensions of brand gender, namely The Gender of the Typical User of the Brand, Gendered Personality Traits of the Brand, Gendered Attributes of Brand Communication, Gender of the Brand name, Gendered Attributes of the Logo, and The Gendered Attributes and Benefits of Brand Products. Brand gender congruency is formed from various advertising cues namely: brand name, brand logo, product attributes and category, advertising methods used, and type fonts used. Lieven et al. (2011; 2015) stipulate that brands that position themselves into a particular gender enjoy higher equity than brands that follow an undifferentiated or androgynous approach. Brands having some gender congruent attributes (i.e., positioning themselves as either masculine or feminine) are also easier to market, have more positive responses from consumers, receive higher brand loyalty, and prosper better among buyers (Grohmann, 2009; Oakenfull, 2012; Abdullah, 2014; Tilburg et al., 2015; Neale, 2016; Machado, 2018). However, this is contradictory to what Sultana & Shahriar (2017) discovered when it comes to millennials as the latter target audience are more influenced by gender neutral communications. Existing literature suggests that masculine brands are perceived as adventurous, aggressive, brave, daring, dominant and sturdy while feminine brands are deemed as tender, fragile, graceful, sensitive and sweet (Grohmann, 2009; Lieven et al., 2015; Machado, 2018). Based off Grohmann’s 2009 study on masculine and feminine brands, the following conclusions are drawn when classifying brands as either masculine or feminine (Table 1):
| Table 1: Feminine And Masculine Brand Personality Traits By Grohmann (2009) In Gender Dimensions Of Brand Personality | |
| Feminine Brand Personality | Masculine Brand Personality |
|---|---|
| Express tender feelings Fragile Graceful Sensitive Sweet Tender |
Adventurous Aggressive Brave Daring Dominant Sturdy |
Brand Perceptions Based on Type Fonts
Another thing to consider when thinking about brand gender is the type fonts used to represent the brand. Typography is the art or skills of developing communications by using printed words and consumers associate brand personality and brand gender perceptions with different type fonts (Thangaraj, 2004). Type fonts form part of the brand design elements and add to competitive advantage, promote brand recognition and recall, positively influence brand harmony and equity and complements other brand design aspects such as colours, pictures and designs (Childers, 2002; Brumberger, 2003; Doyle, 2004; Thangaraj, 2004; Puškarevi? et al., 2014; Peate, 2018). Type fonts trigger different emotions and consumers respond more to type fonts that depict harmony, flourishment, excitement, sincerity, sophistication, ruggedness and competence. Previous research findings suggest that type fonts depicting harmony were more liked by consumers but showed little engagement and prominence. Henderson et al. (2004) investigated on 6 types of type fonts and their responses in his empirical study and discovered that ‘script’ type fonts enjoyed more pleasing responses and were more engaging while ‘serif’ type fonts were more prominent. Type fonts such as ‘Stencilset’ and ‘Industria Inline’ were deemed not effective and rather dull-looking while type fonts such as ‘Baphomet’ and ‘Chiller’ were seen to be highly engaging but not really prominent. Other type fonts such as ‘BigDaddy’ and ‘Maiden Word’ were seen as engaging and pleasing respectively. This is further supported by the empirical findings of Grohmann (2012) which suggests that increased type font enhances ruggedness and competence while the reverse signals sincerity, excitement, and sophistication. Some fonts and their perceptions are listed in Table 2.
| Table 2: Type Fonts And Their Perceptions By Henderson et Al. (2004) In Impression Management Using Typeface Design | |
| Fonts | Perceptions |
|---|---|
| ‘Baphomet’, ‘Bandstand’ | Sincere |
| ‘Paintbrush’, ‘Chiller’, ‘Ranson’ | Exciting |
| ‘Playbill’, ‘Stencilset’ | Rugged |
| ‘Schcherozack’, ‘Author’ | Sophistication |
| ‘Janson Text’, ‘Ancient Script’ | Competent |
Interestingly, Velasco et al. (2018) found that type fonts can even convey taste attributes, with curved or symmetrical shapes being associated with sweetness and angular or asymmetrical shapes being paired with other tastes such as sour or bitterness. There are typically 2 types of fonts; ‘Serif’ and ‘Sans-Serif’. ‘Serif’ fonts usually have a small ‘tail’ on the edges of the alphabet while ‘sans-serif’ fonts do not have any small lines projecting from the corners (Mawhinney, 2014). Peate (2018) and Pahwa (2019) came up with more in-depth analysis on different type fonts and their examples, along with the meanings associated with them and which companies make use of which type fonts. Their theoretical findings are summarised in Table 3.
| Table 3: Type Fonts, Meanings, And Usage From Peate (2018) In Font Psychology And Typography Inspiration In Logo Design And Pahwa (2019) In Font Psychology – Use The Right Typeface For Your Logo | |||
| Types of Fonts | Examples | Meanings Associated | Companies Using the Fonts |
|---|---|---|---|
| ‘Serif’ | ‘Times New Roman’, ‘Georgia’, ‘Garamond’, ‘Baskerville’, ‘Book Antiqua’ | Reliable, Respectable, Dependable, Reputable, Conventional, Neutral, Trust, Formal | HSBC, Wikipedia, The New York Times, Yale, Time |
| ‘Slab Serif’ | ‘Courier’, ‘Rockwell’, ‘Museo’ | Confidence, Solidity, Boldness | SONY, HONDA, VOLVO |
| ‘Sans Serif’ | ‘Arial’, ‘Century Gothic’, ‘Helvetica’, ‘Calibri’ | Clean, Simple, Contemporary, Straight-Forward, Futuristic, Neutral, Engaging, Sensible | Microsoft, Chanel, Facebook, Google, Evian, Nike |
| ‘Script’ | ‘Lucida Script’, ‘Lobster’, ‘Zapfino’, ‘Sofia’, ‘Pacifica’ | Creative, Interest, Feminine, Emotional, Fancy, Elegance | Coca Cola, Instagram, Ford, Oglivy |
| ‘Modern’ | ‘Matchbook’, ‘Politica’, ‘Klavika’, ‘Futura’, ‘Bedini’, ‘Bodoni’, ‘Empire’, ‘Orgreave’ | Elegance, Intelligent, Distinct, Determination, Forward-Looking, Simple, Legible, Exclusive | Hulu, Red Bull, Calvin Klein, Shutterfly |
| ‘Display and Decorative’ | ‘Bombing’, ‘Jokerman’, ‘Gigi’ | Fun, Unique, Casual, Direct, Stylized | McDonald, Disney, Fanta, Lego |
Type Fonts and Brand Gender
Men and women interpret language and type fonts differently (Bromberg, 2003) and type fonts used for brand logos affect the product and brand gender perceptions. Lieven et al. (2015) identified a set of neutral, highly feminine, feminine, masculine, and highly masculine fonts in their empirical study which are summarised in Table 4.
| Table 4: Type Fonts And Gender Associations By Lieven et al. (2015) In The Effect Of Brand Design On Brand Gender Perceptions And Brand Preference | |
| Gender Association | Type Fonts |
|---|---|
| Neutral | ‘Arial’, ‘Courier’ |
| Highly Feminine | ‘Monotype Corsiva’, ‘Rage Italic’ |
| Feminine | ‘Gigi’, ‘Kristen ITC’ |
| Masculine | ‘Agency FB’, ‘Courier New’ |
| Highly Masculine | ‘Rockwell Extra Bold’, ‘Impact’ |
Previous empirical findings point to the fact that display type fonts (‘Agency FB’, ‘Courier New’, ‘Rockwell Extra Bold’, ‘Impact’) are perceived as more masculine while script type fonts (‘Gigi’, ‘Rage Italic’, ‘Kristen ITC’, ‘Monotype Corsiva’) are considered as more feminine (Grohmann, 2016; Browne, 2017; Yildrim & Büyükate?, 2020). Further empirical findings suggest that type fonts such as ‘Arial’ and ‘Serif’ are perceived as neutral type fonts and can be used as controls during research for type fonts and brand gender. This mainly reinstates that brand name does not influence brand gender perceptions but type fonts play a major role in the brand gender perceptions among consumers. Further empirical findings from Doyle’s 2004 research proved that consumers choose products in appropriate type fonts as evidenced by 67% of respondents who answered that type fonts are important when choosing products. Moreover, consumers want brands to be type font conformant as per the product category they are in and brand gender they are perceived as. Interestingly, Doyle’s research also suggests that women does not prefer lighter, more scripted and scrolled type fonts and that gender does not influence type font choices at all, thus suggesting that gender does not inform brand gender perceptions.
The existing literature suggests that script type fonts (‘Gigi’, ‘Monotype Corsiva’, ‘Rage Italic’, ‘Lucida Handwriting’) are perceived as feminine, whereas display type fonts (‘Agency FB’, ‘Courier New’, ‘Impact’, ‘Rockwell Extra Bold’) appear more masculine (Bromberg, 2003; Lieven et al., 2015; Grohmann, 2016; Browne, 2017). However, it was also noted by Doyle (2004) that women do not have a preference for script type fonts. Based on these findings, this present research focuses on whether type fonts (i.e., script and display) influences brand gender perceptions. It is expected that type fonts affect brand gender perceptions such that script type fonts promote perceptions of brand femininity and display type fonts increase perceptions of brand masculinity.
Hence, the following hypothesis was developed based from the preceding evidence whereby the independent variable is type fonts and the dependent variable is gendered brand perceptions:
H1: Type fonts have an impact on gendered brand perceptions, such that script type fonts increase brand femininity and display type fonts enhance brand masculinity.
Type Fonts, Product Gender and Purchase Intentions
The gender perception of a product is influenced by one’s gender, sexual orientation, educational level, cultural belonging, demographics and more (Güngör, 2016). Product gender perceptions are influenced by the overall brand gender perceptions and consumers classify products as either masculine or feminine based on various marketing cues such as advertising method used, the brand colours, the product design and shape and the brand name (Fugate & Philips, 2010). Fugate & Philips (2010) classified products such as beer, car, coffee, athletic shoes, lawn mower and potato chips as masculine products and products such as bath soap, wine, digital camera, facial tissue, food processor, frozen vegetables and hairspray as feminine in their empirical study on product gender. Brand name influences brand gender perceptions such that brands with more back vowels are perceived as more masculine while brands with more front vowels are perceived as more feminine (Klink, 2012). That may be because back vowels require a deeper voice to pronounce compared to front vowels, and deeper voice is most of the time associated to masculinity. Brand designs and name influences brand gender perceptions such that brands using letters like ‘k’ or ‘b’ are perceived as masculine and brands using letters like ‘f’ and ‘s’ are perceived as more feminine (Klink, 2009; Wu, 2013; Grohmann, 2015; Lieven et al., 2015). Although there exists the brand gender perception among consumers, existing knowledge suggests that consumers associate brand names with masculinity more often than with femininity and that masculine brands fair much better than feminine ones (Fugate & Philips, 2010; Ridgway, 2014; Lieven et al., 2015; Neale, 2016; Browne, 2017; Machado, 2018).
Consumers associate different products with different type fonts and classified them as per their brand gender perceptions. Previous empirical findings suggest that consumers respond more to type fonts that are in harmony with the product types being advertised and tend to choose products that use type fonts that are complement to the product they are purchasing (Childers, 2002; Bromberg, 2003; Brumberger, 2003; Doyle, 2004; Thangaraj, 2004; Henderson et al., 2004; Fugate & Philips, 2010; Grohmann, 2016; Peate, 2018). The current research aims to identify if consumers select type fonts as per the product category and product being advertised. It is expected that script type fonts are selected for products having high feminine perceptions while display type fonts are associated with products having high masculine perceptions (Fugate & Philips, 2010). Although, Yildrim & Büyükate? (2020) suggest that cross-gender strategy can be applied whereby masculine brands are marketed to women and feminine brands are marketed to men. It is to be noted that the type font ‘Impact’ is the least appropriate and liked by consumers while the type font ‘Monotype Corsiva’ is well preferred among consumers (Ottaway, 2020).
H2: Product category and perceived product gender impacts on brand type font’s appropriateness such that products that are perceived as feminine are paired with script type fonts and products that are highly masculine are paired with display type fonts.
Not only do type fonts influence brand and product gender perceptions but they also affect product purchase and brand loyalty such that women tend to purchase products that use script type fonts and men tend to purchase products that use display type fonts (Childers, 2002; Thangaraj, 2004; Puškarevi? et al., 2014; Peate, 2018; Yildrim & Büyükate?, 2020). It has been noted that gender of brands do influence consumer purchase and product recommendation (Alwis & Ramanathan, 2019). Brands with a strong positioning and clear gender associations as either masculine or feminine have stronger brand equity compared to undifferentiated and androgynous brands. Moreover, previous findings found that consumers preferred products that are congruent with their own gender or that mirror their perception (Worth et al., 1992; Till & Priluck, 2001). The conclusions note that men are more likely to buy masculine perceived and gendered brands and women are more likely to purchase feminine perceived and gendered brands. Moreover, it is to be noted that neutral brands with ungendered names or messages are more likely purchased by women (Till & Priluck, 2001). And although most literature investigated on brand gender in regard to brand association, loyalty or equity (Lieven et al., 2014), the direct effect of purchase intention was not intensively researched.
Based on existing literature, it is concluded that type fonts influenced product purchase and that consumers respond more positively (e.g., purchase of products and likelihood to recommend to another consumer) to brands using gender congruent type fonts (Worth et al., 1992; Till &Priluck, 2001; Childers, 2002; Thangaraj, 2004; Puškarevi? et al, 2014; Peate, 2018) such that women will be more likely to purchase products and recommend the brand if the brand uses a script type font while men will be more likely to purchase products and recommend the if the brand uses a display type font.
Hence, a similar effect is addressed in the following hypothesis whereby type fonts are the independent variables and consumer behaviour (such as product purchase and likelihood to recommend) is the dependent variable:
H3: Type fonts influence consumer behavior (i.e., purchase of product and likelihood to recommend to other consumers) such that women responds more positively to brands using script type fonts while men respond more positively to brands using display type fonts.
Type Fonts and Product Regendering
As previously mentioned, brands possess strong gender identities that are used to sell products, attract a specific target market and increase the overall brand equity. However, the practice of re-gendering is something that many companies are interested. This stems from the fact that men are gradually purchasing products branded for women and vice versa (Jung, 2006). As such, most brands classify themselves as ‘unisex’ or try to extend their product line to attract the opposing gender target market. The car industry has seen this change whereby cars are now classified as masculine and feminine, which is a big change for this highly masculine dominated market. Sandhu & Singh (2017) proved gender bending of products is possible and do succeed, although the type of product is highly dependent on this process.
Along the same line, script type fonts (‘Gigi’, ‘Rage Italic’, ‘Kristen ITC’, and ‘Monotype Corsiva’) were noted to be highly feminine while display type fonts (‘Agency FB’, ‘Courier New’, ‘Rockwell Extra Bold’, ‘Impact’) are perceived as highly masculine. Although empirical findings also suggest that consumers tend to most likely choose brands using masculine type fonts and that gender does not play any part in type font and brand selection. Women are also not always attracted to scripted and scrolled type fonts (Doyle, 2004; Fugate & Philips, 2010; Ridgway, 2014; Lieven et al., 2015; Grohmann, 2016; Neale, 2016; Browne, 2017; Machado, 2018; Yildrim & Büyükate?, 2020). This current research attempts to investigate whether brand re-gendering is possible by simply changing the type font of an existing brand with a solid prior brand gender perception. This study is further built upon Grohmann’s 2016 research titled ‘Communicating brand gender through type fonts’ where type fonts’ impact on brand re-gendering is addressed but not fully investigated upon.
Therefore, the following research hypothesis is developed whereby type fonts are the independent variable and brand re-gendering is the dependent variable:
H4: Changing the type font of an existing brand will impact its current gender perception (masculinity or femininity) and lead to brand re-gendering.
Methods
Four studies were carried with 150 participants whereby quota sampling was used to avoid any biased results. The same respondents took part in all of the studies for convenience and consistency of results. Table 5 is a summary of the demographics of the respondents whereby details such as age, occupation, gender and residing region of the participants are illustrated.
| Table 5: Demographics Of Participants In The Four Studies | |||||
| Female | Male | Grand Total | |||
|---|---|---|---|---|---|
| Age & Occupation | Rural | Urban | Rural | Urban | |
| 18 - 25 | 43 | 26 | 27 | 34 | 130 |
| Employed | 9 | 4 | 2 | 8 | 23 |
| Self-employed | 1 | - | - | 3 | 4 |
| Student | 33 | 22 | 25 | 23 | 103 |
| 26 - 33 | 2 | 4 | 8 | 2 | 16 |
| Employed | 1 | 4 | 8 | 2 | 15 |
| Student | 1 | - | - | - | 1 |
| 34 - 41 | - | - | 1 | 2 | 3 |
| Employed | - | - | 1 | 2 | 3 |
| 42 and Above | - | - | - | 1 | 1 |
| Employed | - | - | - | 1 | 1 |
| Grand Total | 45 | 30 | 36 | 39 | 150 |
Study 1
The first study examines whether the type fonts used to print brand names influence brand gender (i.e., brand masculinity and brand femininity H1). A questionnaire (Cronbach’s Alpha, α= 0.6) was distributed which included 4 script type fonts (‘Kristen ITC’, ‘Lucida Handwriting’, ‘Rage Italic’, ‘Gigi’; Shaikh et al., 2006; Grohmann, 2016), 4 display type fonts (‘Agency FB’, ‘Rockwell Extra Bold’, ‘Arial Narrow’, ‘Impact’; Shaikh et al., 2006; Grohmann, 2016) and 2 neutral type fonts (‘Arial’, ‘Courier New’; Shaikh et al., 2006; Grohmann, 2016) as controls. A total of 150 participants evaluated fictitious brand names (which were pretested for (un)familiarity and liking beforehand) on five point scales whereby 1 represented highly masculine and 5 represented highly feminine. The type fonts used for this study are as listed in Table 6 along with their respective prior gender association:
| Table 6: Type Fonts Used In Study 1 And Their Respective Prior Gender Association | |
| Gender Association | Font Types |
|---|---|
| Neutral | ‘Arial’, ‘Courier’ |
| Highly Feminine | ‘Monotype Corsiva’, ‘Rage Italic’ |
| Feminine | ‘Gigi’, ‘Kristen ITC’ |
| Masculine | ‘Agency FB’, ‘Courier New’ |
| Highly Masculine | ‘Rockwell Extra Bold’, ‘Impact’ |
No brand or product information was provided to respondents. A one way ANOVA test (See Table 7) was performed with masculine and feminine type fonts serving as the independent variables. The results revealed significant effects of type fonts category: brands represented by script type fonts were perceived as feminine while brands represented by display type fonts were considered as masculine (Mscript = 3.88, F(1, 147) = 1.133, p = .289; Mdisplay = 2.42, F(1, 147) = 0.497, p = 0.482).
| Table 7: Gender Perception Of Type Fonts | |||
| Type Fonts | M | F-Value | p-Value |
|---|---|---|---|
| Display Type Fonts | 2.42 | 0.497 | 0.482 |
| Script Type Fonts | 3.88 | 1.133 | 0.289 |
Study 1 supports the first hypothesis (H1) that script type fonts increase brand femininity and display type fonts increase brand masculinity. These findings are significant as participants classified the fictitious brands without any prior exposure or knowledge about the product or brand (Figures 1-3).

Figure 1: Type Fonts And Gender Perceptions

Figure 2:Type Fonts And Product Category

Figure 3:Type Fonts And Product Purchase Interest For Mobile Phones.
Study 2
The findings from Study 1 extended the investigation of type fonts on brand gender perceptions further to product categories and type fonts. The products chosen for this study were athletic shoes, food processor, car, bath soap, wine, toothpaste, nail polish and hiking bag (Fugate & Philips, 2010). The same fictitious brand names from Study 1 were selected to avoid brand preference and liking of existing brands. 150 respondents rated eight fictitious brand names as per the product category, not knowing these brands in terms of familiarity, appropriateness for product categories, masculinity or femininity on seven point scales whereby 1 represented highly masculine and 7 represented highly feminine. A one way ANOVA test (Table 8) revealed that product categories (independent variable) did not influence type fonts (dependent variable) used (athletic shoes, p = 0.2; food processor, p = 0.26; car, p = 0.86; wine, p = 0.17; bath soap, p = 0.79; toothpaste, p = 0.54; nail polish, p = 0.39; hiking bag, p = 0.38). Furthermore, a chi square test (See Table 9) revealed that there was no relationship between gender of respondents and product categories and type fonts (p = 0.338).
| Table 8: Gender Perception Of Type Fonts And Products | ||
| Products | F-Value | p-Value |
|---|---|---|
| Athletic Shoes | 1.653 | 0.201 |
| Food Processor | 1.275 | 0.261 |
| Car | 0.031 | 0.860 |
| Wine | 1.912 | 0.169 |
| Bath Soap | 0.075 | 0.785 |
| Toothpaste | 0.381 | 0.538 |
| Nail Polish | 0.756 | 0.386 |
| Hiking Bag | 0.787 | 0.376 |
| Table 9: Relationship Between Participants And Type Fonts Of Products | |||
| Value | df | Asymp. Sig (2-sided) | |
|---|---|---|---|
| Pearson Chi Square | 25.248a | 23 | 0.338 |
| Likelihood Ratio | 33.816 | 23 | 0.068 |
| Linear-by-Linear Association | 0.024 | 1 | 0.878 |
Study 2 shows that product categories do not influence type fonts and gender of participants does not have any relationship between type fonts and product category choice. Thus, the second hypothesis (H2) which assumed that type fonts used is dictated by the product category is rejected. Study 3 examines product purchase and recommendations based on type fonts.
Study 3
Study 3 examines type font’s influence on product interest, purchase and recommendations. Mobile phone and deodorants served as the main products in this study as both are used by men and women, and visual brand cues such as type fonts are often used to market and position those products in terms of gender associations. The same fictitious brand names were used from Study 1 and Study 2 as they avoided participants to select brands, they liked or preferred, thus their final choice would rest entirely upon type font of the brand name and product category. The survey model from Grohmann (2016) was applied for this particular study whereby the same brand names were chosen for the deodorants (Axis for men and Senseo for women). Participants were first asked about mobile phones and 150 respondents rated their interest in the different brand on five point scales. A chi square test (See Table 10) also revealed that there was no existing relationship between gender of respondent and type font chosen (p = 0.393). Moreover, it was discovered that participants chose the masculine type font ‘Agency FB’ (M = 3.42) as their most preferred type font for purchase and the highly masculine type font ‘Impact’ as their least favoured one (M = 2.23).
| Table 10: Relationship Between Gender Of Participants And Type Fonts Chosen | |||
| Value | df | Asymp. Sig. (2-sided) | |
|---|---|---|---|
| Pearson Chi-Square | 13.737a | 13 | 0.393 |
| Likelihood Ratio | 16.874 | 13 | 0.205 |
| Linear-by-Linear Association | 0.046 | 1 | 0.830 |
The second part of this study consisted of the deodorants (Axis for men using the type font ‘Lucida Handwriting’ and Senseo for women using the type font ‘Impact’) and the same 150 participants who participated in the first part of this study rated their preferences and attitudes for 2 the type fonts. The results obtained from a one-way ANOVA test (See Table 11) for both brand (Axis and Senseo) indicates that respondents thought that Axis (with the type font ‘Lucida Handwriting’) is slightly appropriate, looks slightly strong and established, is fairly difficult to read, looks likely fresh and modern, is quite easy to spot and that they would likely recommend the brand to their male friend. A second one-way ANOVA test (See Table 11) was conducted for the brand Senseo (written using the type font ‘Impact’) and the results shows that the type font is slightly appropriate, slightly looks strong and established, is not difficult to read at all, likely looks fresh and modern, is easy to spot, and that they would likely recommend the brand to a female friend. The findings are further summarised in Figure 4.

Figure 4:Type Fonts’ Impact On Product Purchase And Recommendation
| Table 11: Perception And Attitudes Of Participants Towards Gendered Congruent Type FontS | ||||
| AXIS (‘Lucida Handwriting’ Type Font) | SENSEO (‘Impact’ Type Font) | |||
|---|---|---|---|---|
| Characteristics | F Value | P Value | F Value | P Value |
| Appropriateness of Type Font | 0.256 | 0.613 | 0.000 | 1.000 |
| Strong and Established Type Font | 0.148 | 0.701 | 0.598 | 0.441 |
| Easy to Read Type Font | 0.410 | 0.523 | 4.491 | 0.036 |
| Recommendation based on Type Font | 0.071 | 0.790 | 0.970 | 0.326 |
| Fresh and Modern Type Font | 0.033 | 0.855 | 0.704 | 0.403 |
| Easy to Spot Type Font | 0.000 | 1.000 | 3.599 | 0.060 |
These findings suggest that men and women are not influence by type fonts that are congruent to their gender when they purchase a product or tend to recommend to a friend. The third hypothesis (H3) is thus rejected in correlation to these findings. Study 4 further tests this knowledge to investigate whether type fonts can influence brand re gendering.
Study 4
This study was conducted based on recommendations from Grohmann (2016) who wanted to investigate whether changing the existing type font of a familiar brand in a defined product gender category could change its prior brand gender, thus brand re-gendering. This aspect can be used by marketers looking to enter new markets or changing their product and brand gender perceptions. For the purpose of this study, the brand Dove was used as it is a familiar brand in Mauritius with a clear product and brand gender perception. A pretested result shows that Dove is considered a feminine product (n = 40, M = 4.6) among participants. 150 participants were presented with six type fonts (‘Monotype Corsiva’, ‘Agency FB’, ‘Arial’, ‘Rockwell Extra Bold’, ‘Kristen ITC’, and ‘Arial Narrow’) and asked which one would be better to target a young male audience. An independent sample t-test (Table 12) revealed that participants were not influence by the target audience in selecting the type fonts for brand re-gendering. The least favoured type font was ‘Kristen ITC’ (M = 2.77) while the type font ‘Monotype Corsiva’ (M = 3.41) was the most preferred one. A chi square test (Table 13) also revealed that gender of respondents did not have any relationship with type fonts chosen (p = 0.113).
| Table 12: Brand Re-Gendering Based On Type Fonts | |||
| Type Fonts | M | SD | p Value |
|---|---|---|---|
| ‘Agency FB’ | 3.04 | 0.919 | 0.290 |
| ‘Arial’ | 3.15 | 1.054 | 2.277 |
| ‘Rockwell Extra Bold’ | 3.04 | 1.247 | 0.128 |
| ‘Kristen ITC’ | 2.77 | 1.201 | 0.587 |
| ‘Arial Narrow’ | 3.27 | 1.115 | 0.023 |
| ‘Monotype Corsiva’ | 3.41 | 1.327 | 0.014 |
| Table 13: Relationship Between Gender Of Respondents And Type Fonts Chosen For Brand Re-Gendering | |||
| Value | df | Asymp. Sig. (2-sided) | |
|---|---|---|---|
| Pearson Chi-Square | 24.243a | 17 | 0.113 |
| Likelihood Ratio | 28.945 | 17 | 0.035 |
| Linear-by-Linear Association | 3.081 | 1 | 0.079 |
The findings from Study 4 show that people do not consider change in type fonts as brand and/or product re-gendering, thus the product is still classified into its prior product gender perception. Hence, the fourth hypothesis (H4) is rejected. This means that more changes (such as advertising spokesperson, brand colours, product package and more) need to be made for a drastic shift in brand gender perceptions when the product is already known by the public. However, it is also quite interesting to note from Figure 5 that 39.3% of the participants chose a neutral type font (Arial) for brand re-gendering, thus this may mean that neutral type fonts can help in this process Table 14.

Figure 5:Type Font Appropriateness For Brand Re-Gendering.
| Table 14: Type Fonts Used In Each Study | |||
| Study | Type fonts used associated with femininity | Type fonts used associated with masculinity | Type fonts used as control |
|---|---|---|---|
| Study 1 | ‘Kristen ITC’, ‘Lucida Handwriting’, ‘Rage Italic’, ‘Gigi’ | ‘Agency FB’, Rockwell Extra Bold’, ‘Arial Narrow’, ‘Impact’ | ‘Arial’, ‘Courier New’ |
| Study 2 | ‘Kristen ITC’, ‘Gigi’, ‘Monotype Corsiva’, ‘Georgia’, ‘Lucida Handwriting’, ‘Rage Italic’ | ‘Agency FB’, ‘Impact’, ‘Arial Narrow’ | ‘Arial’, ‘Courier New’ |
| Study 3 | ‘Lucida Handwriting’ | ‘Impact’ | - |
| Study 4 | ‘Monotype Corsiva’, ‘Kristen ITC’ | ‘Agency FB’, ‘Rockwell Extra Bold’, ‘Arial Narrow’ | ‘Arial’ |
Managerial Implications
This research contributes to existing knowledge on type fonts and its influence on brand gender by establishing that consumers do form brand gender perceptions based on the brand type fonts only such that script type fonts increase brand femininity and display type fonts enhance brand masculinity in emerging countries such as Mauritius. Moreover, this research puts forward that product categories and type fonts do not influence each other and that product purchase, interest and recommendation are not affected by type fonts (although further research is needed in that area) such that women are not influenced to buy a product that uses script type fonts and men are not influenced to purchase from a brand that uses display type fonts. Type fonts may be a subtle visual cue, yet it greatly influences brand gender perceptions and it was also proven that type fonts is not enough for changing the existing brand gender perception of a product. From a theoretical point of view, type fonts and brand gender or personality is a promising avenue to explore in future researches along with other visual brand cues such as logo, graphic designs, brand colours, product shape amongst others for customers of emerging countries in African region.
Type Fonts and Gender Associations
This research has shown that a type font is an effective means to communicate brand gender. Empirical results from Study 1 were consistent across various previous studies on script and display type fonts (Bromberg, 2003; Lieven et al., 2015; Grohmaan, 2016; Browne, 2017; Yildrim & Büyükate?, 2020), that is, script type fonts were matched with femininity brand gender perception whilst display type fonts were considered as masculine. Brand managers can select one of the script or display type fonts to convey their brand gender associations and their unique brand gender profile. This further improves product and brand positioning and should be useful when looking to market to a specific gender only in emerging economies. Neutral type fonts are also advised in cases where brands want to pursue both brand masculinity and femininity perceptions.
Influence of Type Fonts on Product Category
Study 2 demonstrates that product categories do not influence type fonts and customers do not tend to associate product category with type fonts. This is a useful piece of information as brand managers and companies may have long thought that they needed to have a masculine type font if they were marketing a product that is mostly viewed as masculine or a feminine type font if they are selling a product that is highly viewed as feminine. This means that companies can select a type font and not fear that they will be associated with a specific brand gender only. Viewed from a business point of view, this is beneficial as businesses can target both men and women, indifferent of the type font they are using or the product they are selling. These findings differ from previous literature (Thangaraj, 2004; Doyle, 2004; Henderson et al., 2004; Grohmaan, 2016; Peate, 2018) and is a testimony to our changing times and ways of living in emerging economies that are striving to be sustainable in the near future. More specifically, younger generations have no problem buying and using products that were previously marketed or associated with a specific gender that was not their own. In addition, women can now purchase products that were long viewed as masculine (car) and men have no problem using products that were previously viewed as feminine (food processor). The best way would be to use neutral type fonts as this allows associations to none of the brand gender (masculinity and femininity) and promises a bigger target audience for the product offering in an emerging country such as Mauritius.
Impact of Type Fonts on Product Purchases and Recommendations
The third part of this research has revealed further details about type font’s effects on product purchase, interest and recommendations. It was found that men and women are somewhat influence by type fonts when making their purchases or recommending a product, they are not entirely influence by this specific visual brand cue. This is not coherent as per previous literature (Childers, 2002; Thangaraj, 2004; Puškarevi? et al., 2014; Peate, 2018) and raises the stakes for businesses and brand managers in emerging countries. Type fonts played a part in product interest as respondents still favoured products that used type fonts that were congruent with their own gender but type fonts did not affect product purchase and recommendation. This means that brand managers should keep in mind that type fonts are not the only influencing factor when it comes to product interest, purchase and recommendation and additional product information or brand cues should be present. The product performance, product shape, product colours, product usability and after purchase behaviours all serve as additional advertising and marketing cues that increase product interest, purchase and recommendations. This can be applied in the consumer buying journey such that type fonts can be used in the primary section of the consumer journey to raise awareness and gain interest as consumers are interested in brands that use type fonts that are congruent to their gender. Moreover, when it comes to the next step in the buyer journey, brand managers must ensure that further information about the product is present as the type font solely will not be enough to make a sale for companies in emerging countries.
Some other major findings from Study 3 also revealed that script type fonts were not easy to read or spot when compared to display type fonts. This suggests that brand managers should prioritise display fonts when trying to convey important information as they are easily seen and read by everyone. This also helps copywriters and brand managers to understand which type fonts to use under which circumstance display type fonts can be used on billboards where the audience is on the rush or far away and have little time to read the marketing message, on the other hand, script fonts can be used in brand slogans, written communications in newspapers, websites, magazines and more as people have the time to read and assimilate the message properly. The key takeaway for businesses is that display type fonts should be used to convey important message in little time and script type fonts should be implemented in other types of marketing communications (emails, websites, magazines, newspapers etc). Table 15 shows a summary of the results for the pairings of type fonts and product types.
Impact of Type Fonts on Brand Re gendering Strategies
The last part of this research investigated whether changing the type font of an existing brand is enough to change its current brand gender perception. Using the brand Dove for this study, respondents were asked to change the existing script type font of the brand to adapt to a young male audience. Results from Figure 5 suggest that people still selected script type fonts and display type fonts were more of a neutral choice. Although, it is to be noted that neutral type font (‘Arial’) was also well liked by participants. Findings from Study 4 confirm that people are more attracted to script type fonts and this is in line with previous research (Thangaraj, 2004; Henderson et al., 2004; Peate, 2018). These findings are crucial for businesses looking to either penetrate new market with an existing product or launch a new product in an existing market as they will need to adapt their type fonts to conform with the audience they are targeting and script and neutral type fonts are seen as the best fit in both cases. This study merely puts forward an idea of how an audience will react if the type font of an existing brand had to change and further research is needed to identify more underlying tones of these effects. This research reveals five major findings, 1: type fonts contributes to brand gender perceptions such that script type fonts increase brand femininity and display type fonts enhance brand masculinity, 2: type fonts is not influenced by product categories and thus neutral type fonts are a good choice to use indifferent of the type of product, 3: people seek products that use gender congruent type fonts and this is good to create awareness of brands as well as interests from potential consumers, 4: type fonts do not influence product purchase and recommendation and further product and brand information (product performance, product price, unique selling proposition) is needed to ensure the sale, 5: ‘script’ and ‘neutral’ type fonts are best used for brand re gendering as consumers are more attracted to those type fonts.
Conclusions, Limitations And Future Research Directions
This research was conducted by using fictitious brand names and thus some people had difficulties to answer some of the questions without any clear indication of the brands they were presented. Future research can take into account existing Mauritian brand names and investigate on which type fonts are more memorable or competitive on the current emerging market of Mauritius. The basis for this research was on the gender of participants, although another interesting research can take into consideration the age of respondents (for people tend to like or dislike particular type fonts as they grow older) as the determining factor for type font’s preference and effects. Other interesting researches can be carried on type fonts in specific marketing communication channels such as websites, billboards, newspapers and magazines. Type fonts used in digital adverts and on the Internet are yet another promising avenue to investigate, especially when the majority of customers spend a lot of time online and digital marketing is becoming the best way to reach the targeted audience and market the products. The research on type fonts open the doors for other various research works that can be implemented in different contexts – industry and product wise to further shed light on emerging economies to better understand brand purchases from a gendered perspective for greater sustainability.
References
- Aaker. J. (1997). Dimensions of brand personality, Journal of Marketing Research, 34, 347-356.
- Abdullah. A. (2014). The effect of brand image and brand loyalty on brand equity, International Journal of Business and Management Invention, 3(5), 28-32.
- Alwis, A.C., & Ramanathan, H. (2019). Impact of sex roles on brand gender contamination of purchase of decision-making: Case in Sri Lanka, In: 4th Interdisciplinary Conference in Management Researches Sabaragamuwa University of Sri Lanka.
- Anon. (2020). COVID-19 and Africa: Socio-economic implications and policy responses. OECD. Available at: https://www.oecd.org/coronavirus/policy-responses/covid-19-and-africa-socio-economic-implications-and-policy-responses-96e1b282/
- Browne. L. (2017). Effectively communicating masculine and feminine brand personality traits using brand logo designs, MSc: John Molson School of Business, Concordia University.
- Brumberger, E. (2003). The Rhetoric of Typography: The Persona of Typeface and Text, Technical Communication, 50(2), 206-223.
- Childers, T., & Jass, J. (2002). All Dressed Up with Something to Say: Effects of Typeface Semantic Associations on Brand Perceptions and Consumer Memory, Journal of Consumer Psychology, 12(2), 93-106.
- Coffie, S. (2018). Positioning strategies for branding services in an emerging economy. Journal of Strategic Marketing.
- Doyle, J., & Bottomley, P. (2004). Font appropriateness and brand choice, Journal of Business Research, 57, 873-880.
- Evans, E.N. (2014). Fonts, Typefaces and IP Protection: Getting to Just Right, Journal of Intellectual Property Law, 21(2), 4.
- Fournier, S. (1998). Consumers and Their Brands: Developing Relationship Theory in Consumer Research, Journal of Consumer Research, 24(4), 343-353.
- Fugate, D., & Phillips, J. (2010). Product gender perceptions and antecedents of product gender congruence, Journal of Consumer Marketing, 27(3), 251-261.
- Grohmann, A. (2015). Consonants in brand names influence brand gender perceptions, European Journal of Marketing, 49(1/2), 101-122.
- Grohmann, B. (2009). Gender dimensions of brand personality, Journal of Marketing Research, 46(1), 105-119.
- Grohmann, B. (2016). Communicating brand gender through type fonts, Journal of Marketing Communications, 22(4), 403-418.
- Grohmann, B., Giese, J., & Parkman, I. (2013). Using Type Font Characteristics to Communicate Brand Personality of New Brands, Journal of Brand Management, 20, 389-403.
- Güngör. (2016). Effects of Advertising on product gender perception: washing machines in the Turkish market, MSc: Graduate School of Engineering & Sciences of Izmir Institute of Technology.
- Haenschen, K., & Tamul, D.J. (2019). What’s in a Font?: Ideological Perceptions of Typography, Communication Studies, 1-18.
- Henderson, P., Giese, J., & Cote, J. (2004). Impression Management Using Typeface Design, Conditional Acceptance at the Journal of Marketing.
- Jung, K. (2006). Cross-Gender Brand Extensions: Effects of gender of the brand, gender of consumer, ad product type on evaluation of cross-gender extensions, Advances in Consumer Research, 33, 67-74.
- Klink, R. (2009). Gender differences in new brand name response, Marketing Letters, 20(3), 313-326.
- Klink, R., & Athaide, G. (2012). Creating brand personality with brand names, Marketing Letters, 23(1), 109-117.
- Lieven, T., Grohmann, B., Herrmann, A., Landwehr, J., & Tilburg, M. (2014). The Effect of Brand Gender on Brand Equity, Journal of Psychology and Marketing, 3(5), 371-385.
- Lieven, T., Grohmann, B., Hermann, A., Landwehr, J., & Tilburg, M. (2015). The effect of brand redesign on brand gender perceptions and brand preference, European Journal of Marketing, 49(1), 146-169.
- Lieven, T., Grohmann, B., Herrmann, A., & Tilburg, M. (2015). The Effect of Brand Gender Similarity on Brand-Alliance Fit and Purchase Intention, Marketing ZFP, 37, 5-13.
- Lieven, T., Grohmann, B., Herrmann, A., Landwehr, J.R., & van Tilburg, M. (2015). The effect of brand design on brand gender perceptions and brand preference, European Journal of Marketing, 49(1/2), 146-169. https://doi.org/10.1108/EJM-08-2012-0456
- Machado, J., Carvalho, L., Azar, S., André, A., & Santos, B. (2018). Brand gender and consumer-based equity on Facebook; The mediating role of consumer-brand engagement and brand love, Journal of Business Research, 96, 376-385.
- Mawhinney, J. (2014). How to Choose the Right Fonts for Your Marketing. [Online] HubSpot, Available at: https://blog.hubspot.com/insiders/how-to-choose-fonts-for-marketing
- Neale, R., & Martin, B. (2016). Gender identity and brand incongruence: when in doubt, pursue masculinity, Journal of Strategic Marketing, 24(5), 347-359.
- Oakenfull, G. (2012). Gay Consumers and Brand Usage: The Gender-Flexing Role of Gay Identity, Psychology and Marketing, 29(12), 968-979.
- Ottaway, L. (2020). Typeface appropriateness and its impact on wine purchase intent and brand credibility. PhD: Wichita State University, USA.
- Pahwa, A. (2019). Font Psychology – Use The Right Typeface for Your Logo, Feedough, Available at: www.feedough.com/font-psychology-typeface-branding-logo/
- Peate, S. (2018). Finding your “type”: Font psychology and typography inspiration in logo design, Fabrik, Available at: www.fabrikbrands.com/font-psychology-and-typography-inspiration-in-logo-design/
- Puškarevic, I., Pintier, I., & Uroš, N. (2014). Visual Analysis of typeface management in brand identity, In: International Symposium on Graphic Engineering and Design, 427-434.
- Ridgway, J., & Myers, B. (2014). A study on brand personality: consumers’ perceptions of colours used in fashion brand logos, International Journal of Fashion Design, Technology and Education, 7, 50-57.
- Sandhu, N., & Singh, D. (2017). Gender Contamination in Indian Automobile Advertisements: Male acceptance or alienation? Paradigm, 21(2), 139-155.
- Shaikh, A.D., Chaparro, B.S., & Fox, D. (2006). Perception of Fonts: Perceived Personality Traits and Uses, Usability News, 8(1), 1-6.
- Sheth, J.N., & Sinha, M. (2015). B2B branding in emerging markets: A sustainability perspective. Industrial Marketing Management, 51, 79-88.
- Sultana, N., & Shahriar, H. (2017). Understanding Impact of Gender-Neutral Communication on Brand Image: Trend or Tool? MSc: Lund University School of Economics & Management.
- Tilburg, M., Lieven, T., Herrmann, A., & Townsend, C. (2015). Beyond “Pink It and Shrink It” Perceived Product Gender, Aesthetics, and Product Evaluation, Psychology & Marketing, 32(4), 422-437.
- Till, B.D., & Priluck, R.L. (2001). Conditioning of Meaning in Advertising: Brand gender perception effects, Journal of Current Issues & Research in Advertising, 23(2), 1-8.
- Thangaraj, J. (2004). Fascinating Fonts: Is the power of typography a marketing myth? Prism Online Journal.
- Ulrich, I., Tissier-Desbordes, E., & Dubois, P. (2011). Brand Gender and Its Dimensions, European Advances in Consumer Research, 9, 136-143.
- Velasco, C., Hyndman, S., & Spence, C. (2018). The role of typeface curvilinearity on taste expectations and perception, International Journal of Gastronomy and Food Science, 11, 63-74.
- Worth, L.T., Smith, J., & Mackie. D.M. (1992). Gender Schematicity and Preference for Gender-Typed Products, Psychology and Marketing, 9(1), 17-30.
- Wu, L., Klink, R., & Guo, J. (2013). Creating Brand Personality with Brand Names: The Effect of Phonetic Symbolism, Journal of Marketing Theory and Practice, 21(3), 319-329.
- Yildrim, Y., & Büyükates, S. (2020). Effect of font type, font character and font colour on brand gender perception. Business & Management Studies, 8(2), 2215-2244.