Research Article: 2026 Vol: 30 Issue: 2
Integrating Customer Perceptions into Strategic Customer Experience Management: A Dual Perspective Model
Samminga Ashok Kumar, Department of Management Studies, Vignan's
Foundation for Science Technology and Research, Vadlamudi, Guntur
D. Vijay Krishna, Department of Management Studies, Vignan's Foundation for Science Technology and Research, Vadlamudi, Guntur
Lova Baliji, Department of Management Studies, Avanthi institute of Engineering and Technology, Visakhapatnam
Abstract
This study explores the interrelationships between key customer experience variables—customer perceptions, business strategies, customer satisfaction, technology integration, and brand image—and their impact on business performance and customer loyalty. Through regression and correlation analyses, the research validates several key hypotheses. The findings highlight that customer perceptions have a significant positive effect on customer loyalty (R = 0.665, R² = 0.442), underscoring the importance of shaping favorable customer perceptions to foster brand commitment. Similarly, business strategies are found to positively influence business performance (R = 0.649, R² = 0.422), affirming that strategic alignment is crucial for organizational success. The analysis also reveals a moderate yet meaningful relationship between customer satisfaction inputs and satisfaction outcomes (R = 0.562, R² = 0.315), suggesting that strategic investments in service enhancements lead to improved satisfaction levels. Technology integration in customer experience management (CEM) was found to have a statistically significant but modest effect on brand image perception (R = 0.161, R² = 0.026), emphasizing the need for a holistic approach that combines technology with other factors like emotional branding and service quality. The study concludes that brand image plays a critical role in both driving and reflecting customer loyalty, business performance, and overall success. These findings suggest that businesses should adopt a customer-centric, multi-faceted strategy, integrating customer experience management, strategic business practices, and technology to achieve long-term success.
Keywords
Customer Experience, Business Strategies, Customer Loyalty, Brand Image, Technology Integration.
Introduction
Customer experience (CX) has become a central focus for businesses seeking to create a competitive advantage in the marketplace. As markets evolve and customers’ expectations rise, organizations are increasingly realizing the importance of providing a seamless, positive experience that not only satisfies but also builds long-term loyalty. According to brand equity plays a crucial role in customer perceptions and loyalty, as it reflects the tangible and intangible assets tied to a brand's reputation and consumer trust. This shift in focus from traditional marketing approaches to customer-centric models is evidenced in the growing emphasis on service quality and customer satisfaction.
Service quality, as a key component of customer experience, has been widely studied, particularly in its relationship with customer loyalty and business performance. Zeithaml, Berry, and Parasuraman (1996) argue that service quality is integral to determining customer satisfaction, which in turn influences brand loyalty. The SERVQUAL model, proposed by Parasuraman et al. (1988), emphasizes the dimensions of service quality such as reliability, assurance, tangibles, empathy, and responsiveness, which directly affect customer perceptions and satisfaction. Further refined this understanding by showing how service encounter evaluations, including the physical environment and employee interaction, are crucial in shaping customer perceptions (Zeithaml, Berry & Parasuraman 1996).
Grönroos (1994) introduced the concept of relationship marketing, which shifts the focus from transactional marketing to long-term customer relationships. This paradigm shift is closely tied to the development of brand equity, where the service brand becomes an essential driver of business success (Grönroos, 1994). Berry (2000) discusses how cultivating service brand equity can lead to sustainable customer loyalty, as customers develop a sense of trust and emotional attachment to a brand. In this context, customer experience management (CEM) is critical to maintaining a positive relationship with customers, ensuring that each touchpoint, whether online or offline, aligns with the customer’s expectations (Berry, 2000).
Moreover, the integration of technology has become increasingly important in enhancing customer experiences. Found that technology integration positively impacts customer satisfaction and loyalty by providing greater convenience and personalization in services. For example, the use of customer relationship management (CRM) systems and personalized marketing strategies has proven effective in creating a more tailored experience. Technology can also aid in the service recovery process, where prompt and efficient responses to customer complaints can turn a negative experience into a positive one.
Customer satisfaction has been a focal point for research in marketing and business management due to its strong correlation with business performance. Anderson, Fornell, and Mazvancheryl (2004) demonstrated that higher levels of customer satisfaction lead to increased shareholder value, suggesting that businesses that invest in customer satisfaction not only improve their relationships with customers but also achieve superior financial performance. This underscores the importance of adopting customer-centric strategies that prioritize satisfaction as a means to drive profitability (Anderson, Fornell & Mazvancheryl, 2004)
Furthermore, customer loyalty programs have been explored as tools to enhance customer retention. Discuss how loyalty programs can foster repeat business and reinforce customer commitment to a brand. Highlight the significance of service quality in retaining loyal customers, noting that satisfied customers are more likely to engage in repeat transactions and advocate for the brand. The connection between customer satisfaction, loyalty, and business performance has led companies to recognize that delivering superior customer experiences is not just about meeting expectations but exceeding them (Bitner, 1990).
In this evolving landscape, businesses must adopt holistic strategies that integrate service quality, customer satisfaction, and technology to enhance the overall customer experience. Lemon and Verhoef (2016) emphasize that understanding customer experience throughout the entire customer journey is vital for developing effective customer engagement strategies. Companies that leverage insights from customer data and continuously adapt to changing preferences are better positioned to thrive in competitive markets.
Finally, brand image plays a crucial role in shaping customer perceptions and loyalty. Suggests that a strong brand image can influence customer attitudes, behaviors, and willingness to pay a premium for products or services. This highlights the importance of consistent and positive interactions with customers, ensuring that every aspect of the brand resonates with their expectations and preferences. As competition intensifies, businesses must continue to refine their customer experience strategies to remain relevant and foster strong, lasting relationships with their customers.
In conclusion, the interplay between customer experience, brand equity, service quality, technology integration, and customer satisfaction is central to achieving long-term business success. The research discussed in this paper highlights the importance of adopting a comprehensive approach to customer experience management that encompasses all of these elements to drive loyalty, enhance business performance, and ultimately, deliver value to both customers and shareholders.
Literature Review
The concept of customer experience (CX) has garnered significant attention in recent years, as organizations strive to differentiate themselves in a competitive marketplace. CX refers to the sum of all interactions a customer has with a company, which together shape their perceptions, emotions, and overall satisfaction (Lemon & Verhoef, 2016). The increasing recognition of the importance of customer experience highlights the need for businesses to invest in creating a holistic, seamless, and positive experience that not only meets but exceeds customer expectations.
Customer Experience and Service Quality
At the core of customer experience is service quality, a critical determinant in shaping customer satisfaction and loyalty. Parasuraman, Zeithaml, and Berry (1988) introduced the SERVQUAL model, which defines service quality as the difference between customer expectations and perceptions of actual service delivery. The SERVQUAL model identifies five key dimensions of service quality: reliability, assurance, tangibles, empathy, and responsiveness. These dimensions have become fundamental in understanding the drivers of customer satisfaction. According to Zeithaml, Berry, and Parasuraman (1996), service quality directly influences customer satisfaction, which in turn affects customer loyalty. Emphasized the role of service encounter evaluations, noting that both the physical environment and employee interactions with customers are crucial in shaping customer perceptions of service quality.
Service quality also plays a critical role in building brand equity. Brand equity refers to the value a brand adds to a product or service, driven by customers' perceptions and experiences. According to Berry (2000), cultivating strong brand equity through exceptional service quality and positive customer experiences leads to greater customer loyalty. Strong brand equity enables businesses to command a premium for their products and services, thereby driving profitability and long-term success. This view is aligned with the work of, who suggested that brand equity is built upon customer perceptions and loyalty, with a strong brand image serving as a key determinant of customer preference.
The Role of Technology in Customer Experience
As technology continues to evolve, businesses increasingly rely on technological solutions to enhance the customer experience. Technology integration has become a key enabler in shaping customer satisfaction and loyalty. Found that the use of technology in service delivery improves customer satisfaction by providing greater convenience, personalization, and accessibility. For instance, customer relationship management (CRM) systems allow businesses to collect and analyze customer data, enabling personalized interactions and tailored experiences. Meyer and Schwager (2007) suggested that digital tools, such as self-service kiosks and online platforms, empower customers to engage with brands on their terms, improving overall satisfaction and reducing friction in the service process (Chaudhuri & Holbrook, 2001).
Technology also plays a crucial role in service recovery. Discussed the role of customer experience in the service recovery process, highlighting that technology can streamline complaint resolution and enhance customer satisfaction in instances of service failure. For example, automated systems or AI-powered chatbots can quickly address customer issues, providing real-time support and reducing customer frustration. This capability is essential for businesses aiming to retain customers in the face of service failures, ensuring that negative experiences are minimized and customers remain loyal.
Customer Satisfaction and Loyalty
Customer satisfaction is a well-established concept in marketing, with numerous studies demonstrating its influence on customer loyalty and business performance. According to Fornell et al. (1996), the American Customer Satisfaction Index (ACSI) found that higher levels of customer satisfaction are strongly correlated with improved financial performance. Satisfied customers are more likely to become repeat buyers and advocates for the brand, leading to increased customer loyalty and long-term profitability. Anderson, Fornell, and Mazvancheryl (2004) further supported this by showing that customer satisfaction leads to increased shareholder value, reinforcing the importance of investing in customer experience management (Fornell et al., 1996).
Oliver (1999) explained that customer loyalty is the result of a positive emotional connection with a brand, which is often driven by consistent satisfaction over time. When customers are loyal, they are less likely to switch to competitors and more likely to make repeat purchases. Loyalty programs, as discussed by, have been shown to be effective in fostering customer retention. These programs reward customers for their continued patronage, further strengthening their emotional bond with the brand and incentivizing repeat purchases.
Customer satisfaction also serves as a predictor of customer behavior. Boulding et al. (1993) proposed a dynamic model of service quality that links customer satisfaction with future behavioral intentions, such as repurchase and positive word-of-mouth. Their research found that customers who experience satisfaction during service encounters are more likely to engage in repeat business and recommend the brand to others, which can lead to increased market share and growth (Boulding et al., 1993).
The Customer Journey and Touchpoints
The concept of the customer journey is integral to understanding customer experience. According to Meyer and Schwager (2007), the customer journey encompasses all touchpoints through which a customer interacts with a brand, from initial awareness to post-purchase interactions. The journey is not linear, and customers may interact with the brand through multiple channels, both online and offline. Understanding the customer journey is essential for businesses seeking to deliver a consistent and positive experience at each touchpoint (Meyer & Schwager, 2007).
Lemon and Verhoef (2016) emphasized that managing customer experience throughout the customer journey requires a deep understanding of customer needs and preferences at each stage. Businesses must ensure that every interaction, whether through customer service, sales, or digital touchpoints, aligns with customer expectations. Omnichannel strategies, which integrate both physical and digital touchpoints, have become increasingly popular as businesses strive to offer a seamless experience across all channels (Kotler et al., 2014). This approach ensures that customers can interact with a brand in a way that suits their preferences, enhancing overall satisfaction and fostering loyalty.
Service Recovery and Customer Advocacy
Service recovery is a critical component of the customer experience that has received considerable attention in the literature. Service failures are inevitable in any service-oriented business, but how a company responds to such failures can significantly influence customer perceptions. According to Davidow (2003), effective service recovery can turn dissatisfied customers into loyal ones if handled appropriately. The key to successful recovery is responsiveness, empathy, and ensuring that the customer feels valued (Davidow, 2003).
In the context of customer advocacy, customer loyalty has been linked to positive word-of-mouth. Customers who have had positive experiences with a brand are more likely to share their experiences with others, acting as brand advocates (Oliver, 1999). This word-of-mouth promotion can be a powerful tool for businesses seeking to expand their customer base and enhance brand reputation. As noted by, service quality and customer satisfaction are crucial in encouraging advocacy, as satisfied customers are more likely to recommend the brand to friends and family.
The literature highlights the critical importance of customer experience in shaping customer satisfaction, loyalty, and brand equity. By focusing on service quality, technology integration, and understanding the customer journey, businesses can create an environment that fosters positive customer interactions and long-term loyalty. Customer satisfaction remains a fundamental driver of business performance, with loyal customers acting as advocates who help to promote the brand. As the marketplace continues to evolve, companies must continuously adapt their strategies to ensure that they meet customer expectations and provide exceptional experiences at every touchpoint. This integrated approach to customer experience management is essential for organizations seeking to thrive in an increasingly competitive environment (Figure 1).
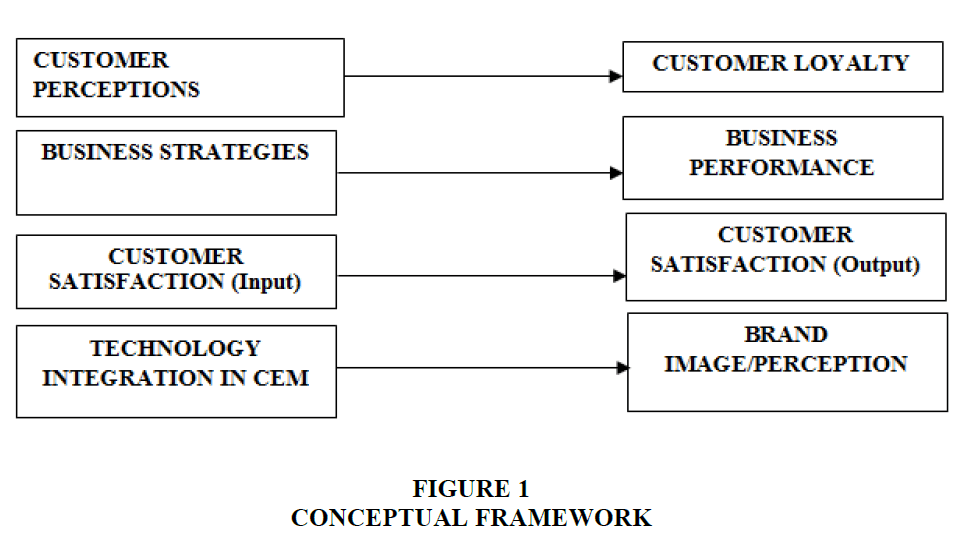
Figure 1 Conceptual Framework
Objectives of the Study
1. To examine the impact of customer perceptions on customer loyalty.
2. To analyze how business strategies influence business performance.
3. To assess the relationship between customer satisfaction and overall customer experience.
4. To evaluate the role of technology integration in Customer Experience Management (CEM) on brand image/perception.
Hypotheses of the Study
H1: Customer perceptions have a significant positive effect on customer loyalty
H2: Business strategies positively influence business performance
H3: Customer satisfaction (Input) has a significant positive relationship with overall customer satisfaction (Output)
H4: Technology integration in Customer Experience Management significantly improves brand image/perception
Data Analysis
Overview of Correlation Analysis
Correlation analysis measures the strength and direction of the linear relationship between variables. In this matrix, Pearson correlation coefficients (ranging from -1 to +1) help us understand how each pair of variables is related. A value closer to +1 implies a strong positive correlation, closer to -1 indicates a strong negative correlation, and a value around 0 indicates no linear relationship. The double asterisks (**) denote significance at the 0.01 level (2-tailed), meaning these results are statistically significant with a 99% confidence level (Figure 2).

Figure 2 Correlations Heat Map
Customer Perceptions and Related Variables
Customer Perceptions are strongly and positively correlated with Customer Loyalty (r = 0.665**), Business Strategies (r = 0.566**), and Business Performance (r = 0.544**). These values indicate that customers’ perceptions of a brand or service have a substantial influence on their loyalty and how well they believe the business is performing strategically. This aligns well with H1 of the study and supports the theoretical assertion that positive customer perception can directly enhance brand attachment and performance metrics.
Business Strategies and Outcomes
Business Strategies are significantly and positively associated with both Customer Loyalty (r = 0.675**) and Business Performance (r = 0.649**). These relationships imply that well-defined and customer-centric strategies not only enhance performance metrics but also deepen customer commitment. Moreover, Business Strategies show positive correlations with Brand Image (r = 0.299**) and Customer Satisfaction Output (r = 0.251**), which suggests that strategy implementation plays a pivotal role in shaping the customer experience and their perception of the brand.
Customer Satisfaction and Its Influence
Customer Satisfaction, both as input and output, is moderately correlated with several variables. The strongest correlation is between Satisfaction Input and Satisfaction Output (r = 0.562**), confirming internal consistency. Additionally, Satisfaction Output has a strong correlation with Technology Integration (r = 0.554**) and moderate positive correlations with Brand Image (r = 0.178**) and Customer Loyalty (r = 0.251**). These findings indicate that satisfaction plays a mediating role in enhancing the effects of technology and strategy on loyalty and perception.
Technology Integration in CEM and Brand Perception
Technology Integration in Customer Experience Management (CEM) is significantly correlated with Brand Image/Perception (r = 0.161**), Customer Satisfaction Output (r = 0.554**), and Business Performance (r = 0.250**). This supports H4 and underscores the growing importance of digital tools and systems in creating personalized, efficient, and seamless experiences that strengthen brand perceptions and drive satisfaction. The moderately positive relationships suggest that technology acts as a facilitator rather than a direct influencer, highlighting the need for effective implementation.
Brand Image/Perception and Strategic Outcomes
Brand Image/Perception shows significant positive correlations with Business Strategies (r = 0.299**), Business Performance (r = 0.258**), and Customer Loyalty (r = 0.274**). These findings suggest that brand image is not only a result of how a business position itself but also a reflection of customer satisfaction and technological sophistication. A strong brand image enhances trust, credibility, and customer advocacy, reinforcing the study's framework. Therefore, organizations should view brand image as both an outcome and a strategic asset that supports loyalty and long-term performance.
Regression Analysis
H1: Customer perceptions have a significant positive effect on customer loyalty
The regression model indicates a moderate positive relationship between Customer Perceptions and Customer Loyalty, with a correlation coefficient (R) of 0.665. The R Square value of 0.442 suggests that 44.2% of the variance in Customer Loyalty is explained by Customer Perceptions, which implies that Customer Perceptions is a significant factor influencing Customer Loyalty. The adjusted R Square of 0.441 shows that the model fits well and that no unnecessary predictors are included.
The ANOVA results confirm that the regression model is statistically significant. The F-statistic of 345.529 and the p-value of 0.000 indicate that the model, as a whole, explains a significant portion of the variability in Customer Loyalty. This suggests that customer Perceptions has a meaningful impact on customer Loyalty. The low residual sum of squares (197.924) further supports the model's good fit Table 1.
| Table 1 Anovaa | ||||||
| Model | Sum of Squares | df | Mean Square | F | Sig. | |
| 1 | Regression | 156.854 | 1 | 156.854 | 345.529 | .000b |
| Residual | 197.924 | 436 | .454 | |||
| Total | 354.779 | 437 | ||||
b. Predictors: (Constant), customer Perceptions
In the coefficient analysis, the constant (intercept) value of 0.845 represents the expected customer Loyalty when customer Perceptions is zero. The unstandardized coefficient for customer Perceptions is 0.703, indicating that for every one-unit increase in customer Perceptions, customer Loyalty increases by 0.703 units. This highlights the positive influence of customer Perceptions on customer Loyalty.
The standardized coefficient (Beta) of 0.665 suggests that customer Perceptions is a relatively strong predictor of customer Loyalty. This indicates that changes in customer Perceptions have a substantial effect on customer Loyalty compared to other potential predictors. The high Beta value reinforces the significance of customer Perceptions in driving customer loyalty. The t-statistic for the customer Perceptions coefficient (18.588) and its p-value (0.000) confirm the statistical significance of the predictor. This means that customer Perceptions is not only important but also statistically reliable in predicting customer Loyalty. In conclusion, the findings demonstrate that customer Perceptions are a key factor in shaping customer Loyalty, and the model provides strong evidence of this relationship.
H2: Business strategies positively influence business performance
The model analysis reveals a moderate positive relationship between Business Strategies and Business Performance. The correlation coefficient (R) is 0.649, indicating a moderate strength of association. The R Square value of 0.422 suggests that 42.2% of the variance in Business Performance can be explained by Business Strategies, implying a moderate predictive power of the model. The adjusted R Square of 0.420 is slightly lower but still indicates that the model fits the data well.
The ANOVA results show that the regression model is statistically significant. The F-statistic of 318.018 and the p-value of 0.000 indicate that business strategies significantly contribute to explaining the variance in business performance. The regression sum of squares (144.063) represents the variation in business performance that can be attributed to business strategies. In contrast, the residual sum of squares (197.510) accounts for the unexplained variance, reinforcing the model's reliability.
The coefficient analysis provides insights into the relationship between the variables. The constant (intercept) value of 0.846 indicates the expected business performance when business Strategies is zero. The unstandardized coefficient for business strategies is 0.645, suggesting that for every one-unit increase in business strategies, business performance is expected to increase by 0.645 units. This highlights the positive impact of business strategies on business performance.
The standardized coefficient (Beta) for business strategies is 0.649, suggesting that business strategies have a moderately strong effect on business performance. The positive Beta value emphasizes the significance of business strategies in predicting business performance, with a substantial influence compared to other potential predictors.
The t-statistic for the coefficient of business strategies is 17.833, which is significantly high, and the p-value is 0.000, indicating that the predictor is statistically significant at the 0.05 level. This means that business strategies is a reliable predictor of business performance, and the relationship observed is not due to chance. The findings demonstrate that effective business strategies have a meaningful and significant impact on business performance.
H3: Customer satisfaction has a significant positive relationship with overall customer satisfaction
The results from the model summary reveal key insights about the strength and quality of the regression model. The correlation coefficient (R) is reported as 0.562, which indicates a moderate positive linear relationship between customer satisfaction input and output. This suggests that as the input efforts to enhance customer satisfaction increase, there is a moderate tendency for the customer satisfaction outcome to increase as well. The R-squared (R²) value is 0.315, which implies that approximately 31.5% of the variation in Customer Satisfaction Output is explained by the variation in Customer Satisfaction Input. This value shows a meaningful proportion of variance explained by the model, although it also indicates that a substantial 68.5% of the variation is due to other factors not captured in this simple regression model.
The Adjusted R-squared, which adjusts the R² for the number of predictors and sample size, is 0.314, very close to the unadjusted R². Since there is only one predictor variable in the model, the adjusted R² does not drop significantly. This consistency confirms that the predictor variable meaningfully contributes to explaining the variability in the dependent variable. The Standard Error of the Estimate is 0.763, indicating the average distance that the observed values fall from the regression line. A lower standard error implies that the predictions are relatively accurate.
The Analysis of Variance (ANOVA) table assesses the overall significance of the regression model. The F-value is 200.927 with 1 degree of freedom for the regression and 436 degrees of freedom for the residual, and a significance level (p-value) of 0.000. This indicates that the model as a whole is statistically significant and that the independent variable significantly predicts the dependent variable. In simpler terms, there is a very low probability that the observed relationship happened by chance.
The regression sum of squares is 117.004, while the residual sum of squares is 253.891, adding up to a total sum of squares of 370.895. The fact that the regression sum of squares accounts for nearly one-third of the total variability reinforces the R² value of 0.315.
The coefficients table provides more detailed information about the specific impact of the independent variable on the dependent variable.
• The intercept (constant) is 0.992, meaning that if customer satisfaction input is held at zero, the model predicts that the output would be approximately 0.992. This serves as the baseline level of customer satisfaction in the absence of any input factors.
• The unstandardized coefficient for Customer Satisfaction Input is 0.523, which indicates that for every one-unit increase in the input, the output is predicted to increase by 0.523 units. This highlights a positive and substantial relationship between the input and output variables.
• The standardized beta coefficient is 0.562, which allows comparison across different variables. Since there is only one predictor, this value equals the correlation coefficient (R). It confirms the moderate strength of the predictor’s influence.
• The t-value associated with the predictor is 14.175, and the corresponding p-value is 0.000, which indicates that the coefficient is statistically significant at the 0.05 level. This significance implies that the contribution of the input variable to the model is meaningful and not due to random chance.
The regression analysis provides clear evidence that Customer Satisfaction Input has a significant and positive influence on Customer Satisfaction Output. The strength of the model is moderate, as indicated by the R value of 0.562, and the relationship is statistically significant with a p-value less than 0.001. While the model explains a meaningful portion (31.5%) of the variation in customer satisfaction outcomes, it also suggests that other variables not included in the model may also contribute significantly. These could include product quality, service delivery speed, employee behavior, brand image, or post-purchase support Table 2.
| Table 2 Coefficients | ||||||
| Model | Unstandardized Coefficients | Standardized Coefficients | t | Sig. | ||
| B | Std. Error | Beta | ||||
| 1 | (Constant) | .992 | .127 | 7.813 | .000 | |
| Customer_Satisfaction_Input | .523 | .037 | .562 | 14.175 | .000 | |
From a managerial perspective, the findings emphasize the importance of investing in customer satisfaction-related inputs such as personalized service, effective communication, and proactive problem resolution. Improving these inputs can yield better overall satisfaction, as evidenced by the positive and significant regression results.
In summary, the linear regression analysis shows a statistically significant, moderate positive relationship between Customer Satisfaction Input and Customer Satisfaction Output. The findings reinforce the practical importance of understanding and enhancing input factors to improve customer satisfaction outcomes. Although the model does not capture all the influencing variables, it serves as a valuable tool for guiding strategic improvements in customer experience initiatives.
H4: Technology integration in Customer Experience Management significantly improves brand image/perception
This regression analysis investigates the relationship between Technology Integration in Customer Experience Management (CEM) as the independent variable and Brand Image Perception as the dependent variable. The goal was to determine whether advancements in technological integration within customer experience initiatives have a measurable impact on how customers perceive a brand. The model summary indicates a correlation coefficient (R) of 0.161 and an R Square of 0.026. This means that only 2.6% of the variance in Brand Image Perception can be explained by Technology Integration in CEM. While the relationship is positive, its strength is relatively weak. The adjusted R Square is slightly lower at 0.024, suggesting minimal overfitting. The standard error of the estimate is 0.697, which indicates moderate deviation between predicted and actual values Table 3.
| Table 3 Anovaa | ||||||
| Model | Sum of Squares | df | Mean Square | F | Sig. | |
| 1 | Regression | 5.614 | 1 | 5.614 | 11.543 | .001b |
| Residual | 212.057 | 436 | .486 | |||
| Total | 217.671 | 437 | ||||
b. Predictors: (Constant), Technology_Integration_CEM
Despite the low R Square, the ANOVA table confirms the statistical significance of the model with an F-value of 11.543 and a p-value of 0.001. These results indicate that the regression model significantly predicts the dependent variable, justifying the inclusion of Technology Integration in analyzing brand image, even if it explains only a small fraction of the total variance.
The coefficients table shows a constant (intercept) of 1.589 and an unstandardized coefficient of 0.113 for Technology Integration in CEM. This means that for every one-unit increase in technological integration, the brand image perception score is expected to rise by 0.113 units. The t-value of 3.398 and significance level of 0.001 reinforce the reliability of this predictor.
In practical terms, although technology integration plays a statistically significant role in shaping brand image, its impact is limited in magnitude. This suggests that while digital tools and platforms may enhance customer interactions and support a modern brand identity, other variables such as service quality, emotional branding, or product satisfaction are likely to have a stronger influence on brand perception. To conclude, the analysis confirms a meaningful but modest contribution of Technology Integration in CEM to Brand Image Perception. Organizations should continue investing in technology to improve customer experiences but must also focus on broader brand-building efforts to significantly enhance customer perception and loyalty.
Conclusion
The analysis presented In this study emphasizes the Importance of several key factors In driving customer loyalty, business performance, brand image, and customer satisfaction. Through a series of regression analyses, we examined the relationships between customer perceptions, business strategies, customer satisfaction, technology integration, and brand image. The results offer compelling insights into the role these variables play in shaping both customer experiences and organizational outcomes. While the findings reveal statistically significant relationships, the strength and impact of these relationships vary, highlighting the complexity of customer experience management and the interplay of various business factors.
Customer Perceptions and Customer Loyalty (H1)
The regression analysis for Hypothesis 1 (H1), which posits that customer perceptions have a significant positive effect on customer loyalty, reveals a strong and meaningful relationship. The model shows a substantial correlation coefficient (R = 0.665) and an R Square of 0.442, meaning that customer perceptions account for 44.2% of the variance in customer loyalty. This finding strongly supports the notion that how customers perceive a brand—whether it be through their experiences, interactions, or overall brand image—has a critical influence on their likelihood to remain loyal. The positive relationship between customer perceptions and loyalty underlines the importance for businesses to focus on creating and maintaining positive perceptions among customers. This could be achieved by delivering high-quality products and services, creating memorable brand experiences, and ensuring that customer expectations are consistently met or exceeded.
Moreover, the statistical significance of this relationship (p = 0.000) highlights the reliability of this predictor. Businesses that manage to influence customer perceptions positively are more likely to cultivate brand loyalty, which is often linked to repeat purchases, brand advocacy, and long-term profitability. Therefore, the study affirms that customer perceptions are foundational to customer loyalty, and businesses should prioritize efforts to enhance their customers' experiences.
Business Strategies and Business Performance (H2)
For Hypothesis 2 (H2), the analysis confirms a significant positive relationship between business strategies and business performance. The correlation coefficient (R = 0.649) and R Square value of 0.422 indicate that 42.2% of the variance in business performance can be explained by business strategies. The results suggest that businesses that develop and implement strong, customer-centric strategies are more likely to perform well. These strategies, which could include market expansion, operational efficiency, or customer service improvement, directly contribute to business performance. The statistical significance of the model (F = 318.018, p = 0.000) further supports this conclusion, validating the essential role that business strategies play in driving organizational success.
The model's coefficient analysis reveals that every unit increase in business strategies leads to a 0.645-unit increase in business performance, emphasizing the substantial influence of business strategies on performance outcomes. This finding reinforces the importance of a strategic, well-executed approach to achieving business goals, suggesting that businesses should prioritize strategic alignment and execution to enhance overall performance. Importantly, business strategies can have a ripple effect, improving customer satisfaction, loyalty, and brand perception, which in turn positively impact performance metrics.
Customer Satisfaction and Its Impact
The relationship between Customer Satisfaction Input and Customer Satisfaction Output (regression analysis for H3) reveals a statistically significant and moderately strong positive relationship (R = 0.562, R² = 0.315). This indicates that efforts aimed at improving customer satisfaction—such as personalized service, quick response times, or proactive customer support—have a meaningful, though not complete, impact on customer satisfaction outcomes. With 31.5% of the variance in satisfaction explained by customer satisfaction inputs, the analysis underscores the importance of strategic investments in areas that directly influence customer experiences.
The model's statistical significance (F = 200.927, p < 0.001) and the positive unstandardized coefficient (0.523) affirm that each increase in satisfaction inputs results in improved satisfaction outcomes. However, 68.5% of the variance remains unexplained, suggesting that other factors—such as product quality, competitive pricing, or post-purchase services—could also be contributing to customer satisfaction. Managerially, these findings emphasize that businesses should continually invest in areas that influence customer satisfaction but also recognize that satisfaction is multifaceted, requiring a holistic approach to service and product offerings.
Technology Integration and Brand Image Perception (H4)
The analysis of Hypothesis 4 (H4), which investigates the role of Technology Integration in Customer Experience Management (CEM) in enhancing Brand Image Perception, yields interesting yet modest results. While the regression analysis indicates a statistically significant relationship between technology integration and brand image perception (F = 11.543, p = 0.001), the low R² value of 0.026 suggests that only 2.6% of the variation in brand image perception can be explained by technological integration in customer experience initiatives. This indicates that while technology plays a role, its impact is modest compared to other factors influencing brand image.
The positive correlation suggests that technology integration (such as personalized experiences through digital platforms, seamless omnichannel interactions, and automation tools) can help shape brand image. However, the effect size is small, suggesting that brand image is more strongly influenced by other factors such as emotional connection, service quality, and product satisfaction. Businesses should continue to integrate advanced technologies into their customer experience strategies, but they must also recognize that technology alone is not sufficient to significantly shape brand perception. It must be complemented by other key elements like consistent product quality, emotional resonance with customers, and effective storytelling.
Brand Image as a Strategic Outcome
Finally, Brand Image emerges as a critical strategic outcome, significantly linked to various variables such as Business Strategies, Customer Loyalty, Performance, and Satisfaction. The study highlights that brand image is both a result of effective customer experience management and a driver of long-term strategic success. A strong brand image can enhance customer loyalty, attract new customers, and contribute to superior business performance. Therefore, companies must treat brand image as an ongoing, strategic priority, ensuring that every touchpoint—whether through technology, service, or product—reinforces the desired brand perception.
Managerial Implications and Strategic Recommendations
The results of this study suggest that businesses aiming for long-term success must adopt a customer-centric approach that integrates customer perceptions, business strategies, customer satisfaction, and technology. Specifically, businesses should focus on:
Enhancing Customer Perceptions: Consistently delivering positive experiences through high-quality service and product offerings can significantly drive customer loyalty.
Strategic Focus on Business Performance: Well-executed business strategies directly influence organizational performance, underscoring the importance of strategic alignment and focused execution.
Investment in Customer Satisfaction: Businesses should continuously invest in initiatives that directly impact customer satisfaction, while recognizing the role of additional factors like product quality.
Technological Integration: While technology integration plays a role in improving customer experiences and brand image, it should be integrated into a broader strategy that includes emotional branding, service quality, and product satisfaction.
In conclusion, the findings support the notion that customer experience management is a multi-faceted approach, and while technology plays a supportive role, holistic strategies that address various aspects of the customer journey are crucial to driving brand success and long-term organizational growth.
References
Anderson, E. W., Fornell, C., & Mazvancheryl, S. K. (2004). Customer satisfaction and shareholder value. Journal of marketing, 68(4), 172-185
Indexed at, Google Scholar, Cross Ref
Berry, L. L. (2000). Cultivating service brand equity. Journal of the Academy of marketing Science, 28(1), 128-137.
Indexed at, Google Scholar, Cross Ref
Bitner, M. J. (1990). Evaluating service encounters: the effects of physical surroundings and employee responses. Journal of marketing, 54(2), 69-82.
Indexed at, Google Scholar, Cross Ref
Boulding, W., Kalra, A., Staelin, R., & Zeithaml, V. A. (1993). A dynamic process model of service quality: from expectations to behavioral intentions. Journal of marketing research, 30(1), 7-27.
Indexed at, Google Scholar, Cross Ref
Chaudhuri, A., & Holbrook, M. B. (2001). The chain of effects from brand trust and brand affect to brand performance: the role of brand loyalty. Journal of marketing, 65(2), 81-93.
Indexed at, Google Scholar, Cross Ref
Davidow, M. (2003). Organizational responses to customer complaints: What works and what doesn’t. Journal of service research, 5(3), 225-250.
Indexed at, Google Scholar, Cross Ref
Fornell, C., Johnson, M. D., Anderson, E. W., Cha, J., & Bryant, B. E. (1996). The American customer satisfaction index: nature, purpose, and findings. Journal of marketing, 60(4), 7-18.
Indexed at, Google Scholar, Cross Ref
Grönroos, C. (1994). From marketing mix to relationship marketing: towards a paradigm shift in marketing. Management decision, 32(2), 4-20.
Indexed at, Google Scholar, Cross Ref
Kotler, P., Keller, K. L., Ancarani, F., & Costabile, M. (2014). Marketing management 14/e. pearson.
Lemon, K. N., & Verhoef, P. C. (2016). Understanding customer experience throughout the customer journey. Journal of marketing, 80(6), 69-96.
Indexed at, Google Scholar, Cross Ref
Meyer, C., & Schwager, A. (2007). Understanding customer experience. Harvard business review, 85(2), 116.
Oliver, R. L. (1999). Whence consumer loyalty?. Journal of marketing, 63(4_suppl1), 33-44.
Indexed at, Google Scholar, Cross Ref
Zeithaml, V. A., Berry, L. L., & Parasuraman, A. (1996). The behavioral consequences of service quality. Journal of marketing, 60(2), 31-46.
Indexed at, Google Scholar, Cross Ref
Received: 21-April-2026, Manuscript No. AMSJ-26-17215; Editor assigned: 22-April-2026, PreQC No. AMSJ-26-17215(PQ); Reviewed: 05-May-2026, QC No. AMSJ-26-17215; Revised: 11-May-2026, Manuscript No. AMSJ-26-17215(R); Published: 18-May-2026