Research Article: 2022 Vol: 21 Issue: 4S
Intellectual capital as the corporate performance measurement (before and during the covid-19 pandemic)
Santy Mayda Batubara, Universitas Muhammadiyah Pontianak
Salawati Sahari, Universiti Malaysia Sarawak
Mohamad Jais, Universiti Malaysia Sarawak
Edy Suryadi, Universitas Muhammadiyah Pontianak
Citation Information: Batubara, S.M., Sahari, S., Jais, M., & Suryadi, E. (2022). Intellectual capital as the corporate performance measurement (before and during the Covid-19 pandemic). Academy of Strategic Management Journal, 21(S2), 1-13.
Abstract
The study aims to determine whether or not differences in the Intellectual capital value between before and during the Covid-19 Pandemic caused the global economic slowdown and the negative impact on finances. The study used Evaluation-Value Added Intellectual Coefficient (Ev-VAIC) as a new measurement model of Intellectual capital, consisting of four components: physical, financial, human, and structural capital. The study method is the quantitative method by comparative analysis, namely the Wilcoxon Signed Rank Test. The study design uses the secondary data, have been listed in the Indonesia Stock Exchange, with the period before the Covid-19 Pandemic (in 2019) and during the Covid-19 Pandemic (in 2020). There are 45 companies in the manufacturing sector, and they should have been listed on the Indonesia Stock Exchange (in 2018). The study result has shown no differences in Intellectual capital before and during the Covid-19 Pandemic. There has a high positive correlation between physical, human, and structural capital, except financial capital is a moderate positive correlation between before and during the Covid-19 Pandemic. The spread of coronavirus (Covid-19) directly affected corporate performance, changing the marketing strategy.
Keywords
Physical Capital, Financial Capital, Human Capital, Structural Capital, Intellectual Capital.
Introduction
The Coronavirus Disease-19 (Covid-19) has a severe impact on all countries in the world. One aspect that focuses on and influences are an investment. The existence of restrictions in a country has an effect on the economic activity of that country. The Covid-19 period is a severe threat, which sooner or later will affect the stability of a nation. Restrictions or lockdowns make business activities experience significant losses. This is caused by all business activities related to the supply of materials; both exports and imports have restrictions too. The investment impact caused by the spread of the Covid-19 had been outbreak is trillions of rupiah. The Institute for Development of Economics and Finance (INDEF) has predicted that the potential loss of Indonesia investment value of IDR 127 trillion (BKPM, 2020).
The spread of Covid-19 has had a major impact on the world economy. Before Covid-19 spread, International institutions predicted that the world economy would weaken due to several global factors (trade wars, geopolitics, and others). However, the Covid-19 period is currently considered an additional impact that will weaken the world's economic growth. The Investors must be careful in investing because the stock market around the world is experiencing a decline on average during the Covid-19, (Collins, 2020). Further, the spread of Covid-19 has made a country's economic instability. Companies listed on the capital market result in negative real and fundamental aspects so that some of these companies have not performed as well as before Covid-19 Pandemic. Economic fluctuations affect the behavior of investors in investing. Therefore, an investor should have a record containing information about the company's overall financial activities when investing (at least in financial statements form). The financial statements that are made will later be useful for parties inside and outside the company itself (La Rocca et al., 2008).
Several studies have been analyzed the impact of Covid-19 on the stock market, such as He et al., (2020); Junaedi & Faisal (2020); Liu et al., (2020) stated that the Covid-19 pandemic is caused decline trend of the world market, and increased inefficiency trend in the stock market (Lalwani & Meshram, 2020). Alali (2020) also stated that the Covid-19 is a pandemic and causes negative abnormal returns (Liu et al., 2020). The Covid-19 in Malaysia affects the KLCI index performance and all sectoral indices, except for the Real Estate Investment Fund (REIT) index (Lee et al., 2020).
Intellectual capital is one of the performance measurements of knowledge-based companies to determine the company's condition in a certain period. Mouritsen et al., (2001) stated that analyzing Intellectual capital in a financial report is a way to reveal that the activities companies are credible, integrated, accurate and fair. This is done based on a textual analysis of the financial statements communicated to internal and external stakeholders.
A positive growth rate indicates the company can cultivate the company it owns. Good company management depends on the company's Intellectual capital. Improving company performance is an obligation to compete and survive in companies in demand by investors. However, the impact of the Covid-19 period on the economy, which resulted in fluctuations, has created great concern for investors in investing. It is a challenge for the company to maintain investor confidence during the Covid-19 Pandemic.
Based on this description, it is crucial for investors always to analyze developments in various company sectors. It is because, with proper observations and calculations, the total losses and adverse impacts can be minimized as small as possible. Therefore, the main purpose of this study to analyze Intellectual capital as a company's performance before the Covid-19 Pandemic (in 2019) and during the Covid-19 Pandemic (in 2020). This study uses a new measurement model called Evaluation-Value Added Intellectual Coefficient (Ev-VAIC), consisting of four components: physical, financial, human, and structural capital (Batubara et al., 2021). The Ev-VAIC model is a new measurement model of Intellectual capital, which results from adopting a combination of three previous findings from Intellectual capital experts, namely Thomas. A. Stewart, Daniel Andriessen & Ante Pulic.
Different from the previous research which the results of this study are expected to help investors make quickly analyze company performance and get more information and data accurately. A new measurement model of Intellectual capital will help investors quickly and simplify to analyze company performance before the Covid-19 Pandemic and during the Covid19 Pandemic. The study aims to determine whether or not differences in the Intellectual capital value before the Covid-19 Pandemic and during the Covid-19 Pandemic.
Literature Review
The study of Intellectual capital has been widely developed in the academic field, applied in practitioners to measure the company's performance. Stewart (1997) stated that Intellectual capital is a "brainpower" with higher value assets and can create Added- Value or wealth in the organization. Intellectual capital consists of knowledge capital, organizational knowledge, information technology, intangible assets, intangible management, hidden values, and individual or group experiences. The new measurement model of Intellectual capital will be used in the study.
There is a combination of adopting the previous findings of three economists in the field of Intellectual capital, namely Thomas. A. Stewart, Daniel Andriessen & Ante Pulic. The new measurement model of Intellectual capital is called Evaluation-Value Added Intellectual Coefficient (Ev-VAIC).
The Evaluation-Value Added Intellectual Coefficient (Ev-VAIC) model was adopted from the combination of the findings of Steward (1997); Pulic (2000); Andriessen (1999). The basis of the Ev-VAIC model is the "Pulic" model. A study on the Evaluation-Value Added Intellectual Coefficient (Ev-VAIC) as a new measurement model of Intellectual capital is found in “Implementation of Evaluation-Value Added Intellectual Coefficient (Ev-VAIC) as Expansion of Intellectual Capital Measurement Model”, by Batubara et al., (2021).
The new measurement of the Intellectual capital model consists of two new components, namely: Physical Capital (PY), Financial Capital (FI), and two old components, namely: Human Capital (HC) and Structural Capital (SC). Value Added includes Output and Input. Human capital and Structural capital are old components derived from the “Pulic” (VAICTM) model.
Intellectual capital variables used in this study are components have a value of innovation, competitiveness, reputation, and branding of the company, (Sahari & Santy, 2019). The new model for measuring Intellectual capital using the Value Added (VA), which consists of Output and Input (based on Pulic's research; IBEC, 2003). According to Pulic (2000) that Output is the total sales after reduction with the cost of goods sold or revenue and comprehensive income. Input is everything that comes from outside the company to be a cost.
The formula of new measurement model of Intellectual capital by Batubara et al., (2021) could be seen as follow:
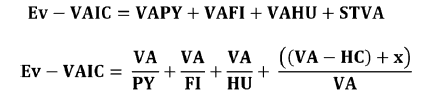
Value Added (VA) is output minus with input. Output is the revenue or total sales after deducting the cost of goods sales and other income. Input is total of all operational costs except the labor costs.
Value Added Physical-Evaluation (VAPY) is Value Added (VA) divided with Physical Capital (PY). It consists of machine tools, office equipment and buildings that have been repeatedly used in the production period.
Value Added Financial-Evaluation (VAFI) is Value Added (VA) divided with Financial Capital (FI). It is the purchasing power or medium of financial wealth stored in the form of currency and used to invest or develop a business by purchasing or acquiring physical capital. Value Added Human-Evaluation (VAHU) is Value Added (VA) divided with Human Capital (HC). HC is the capability, competence, experience and skills of an employee, such as salaries, wages, pension costs, profit sharing and incentive, payroll taxes and other employee benefits. It is not considered the expenses.
Evaluation-Structural Value Added (STVA) is Value Added (VA) minus with Human Capital (SC), added with licensing agreement or favorable contract or goodwill (x) and divided with Value Added (VA).
The final calculation is adding all of components, which consists are VAPY, VAFI, VAHU and STVA. That will result a new measurement model of IC, which is called “the Evaluation-Value Added Intellectual Coefficient” (Ev-VAIC).
Method
The study design is using secondary data, namely time series data. The sampling technique is used of purposive sampling technique. The study sample is companies in the manufacturing sector, have been listed in the Indonesia Stock Exchange, during before Covid19 Pandemic (in 2019) and during the Covid-19 Pandemic (in 2020). There are five sub sectoral indices, includes: (i) Food & Beverages: 20 companies; (ii) Tobacco: 4 Companies; (iii) Pharmaceuticals: 10 companies; (iv) Cosmetics & Household: 7 companies; and (v) House ware: 4 companies. Data collection methods were the documentation studies and accessing financial sites: financial reports (www.idx.co.id). There are 45 companies in the manufacturing sector, which have been listed on the Indonesia Stock Exchange (in 2018).
The study method used the quantitative method by comparative analysis. It is used to find out whether there is a difference between two variables or no difference. Analysis of the data used the test statistic, namely Wilcoxon Signed Rank Test. This study will be comparing a result of the matched-paired signed test with the statistical claim and compare the value of the "Z table" and the "Z account" (the Wilcoxon test). Furthermore, analysis has been done using Spearman's correlation coefficient and interpreting between variables from 0.000 until ± 1.00. The "+" sign indicates a positive value, and the" -" sign is a negative value (the Spearman's correlation coefficient). The correlation coefficients are used to assess the strength and direction of the linear relationships between pairs of variables.
1. The Wilcoxon test
The Wilcoxon test is a difference matched-paired signed test that uses to assess and compare the results of two paired data whether their population means ranks differ or not (Refugio, 2018).
If probability (p) > 0.05, H0 is accepted. If
probability (p) < 0.05, Ha is accepted.
The Statistical test for the average is the ‘Z account’ of the average, because the significance value (α) = 5%, the corresponding critical value from the ‘Z table’ (0.025) = 1.96 and –Z (0.025) = -1.96 (test 2 tails). The critical area is Z > 1.96 or Z < -1.96.
If value of Z account > Z table, Ha is accepted. If
value of Z account < Z table, H0 is accepted.
2. The Spearman's correlation coefficient
The Spearman's correlation coefficient does not communicate whether one variable moves in response to another (Mukaka, 2012).
If sig. value (2-tailed) < 0.05, have significance correlation.
If sig. value (2-tailed) > 0.05, have no significance correlation.
The rule for interpreting the size of a correlation coefficient:
0.90 to 1.00 (-0.90 to -1.00) : Very high positive (negative) correlation
0.70 to 0.90 (-0.70 to -0.90) : High positive (negative) correlation
0.50 to 0.70 (-0.50 to -0.70) : Moderate positive (negative) correlation
0.30 to 0.50 (-0.30 to -0.50) : Low positive (negative) correlation
0.00 to 0.30 : Negligible correlation
Statistical Claim:
• Null Hypothesis: There is “no significant difference” between the ratings of the Intellectual capital before the Covid-19 Pandemic and during the Covid-19 Pandemic. (H0: d=0)
• Alternative Hypothesis: There is “a significant difference” between the ratings of the Intellectual capital before the Covid-19 Pandemic and during the Covid- 19 Pandemic. (H1: d≠0)
Result and Discussion
This study result discusses about the differences Intellectual capital value between before and during the Covid-19 Pandemic in the manufacturing sector, has been listed in the Indonesia Stock Exchange. The Intellectual capital value of companies counted by Ev-VAIC. as shows in Table 1.
| Table 1 Descriptive Statistic Of Intellectual Capital |
|||||
|---|---|---|---|---|---|
| Indices | Total | Mean Rank | Minimum | Maximum | Sum of Rank |
| Negative Ranks | 24 | 23.65 | 567.5 | ||
| Positive Ranks | 21 | 22.26 | 467.5 | ||
| Ties | 0 | ||||
| Before Pandemic | -1.48 | 11.84 | |||
| In Pandemic | -7.81 | 13.13 | |||
| Total | 45 | ||||
As shown in Table 1, the total sample is 45 companies. There are 24 data of negative rank between the Intellectual capital before the Covid-19 Pandemic and during the Covid-19 Pandemic. The Mean rank for negative rank is 23.65, and the sum of ranks is 567.50. The Mean rank for positive is 22.26, and the sum of 467.50.
Positive rank between Intellectual capital before and during the Covid-19 Pandemic of 21 data. Negative rank between both of them of 24 data. Ties for statistic description of 0, which mean no difference between the Intellectual capital before and during the Covid-19 Pandemic. The range at a minimum of Intellectual capital before the Covid-19 Pandemic is -1.48, and the maximum value of 11.84. Whilst, during the Covid-19 Pandemic, the Intellectual capital is ranging at a minimum of -7.81 and a maximum value of 13.13.
The minimum and maximum value of Intellectual capital for manufacturing sector-sub companies can be shown under the figure 1 as follow:

Figure 1: The Intellectual Capital In Manufacturing Sector-Sub Companies
Figure 1 shows the Intellectual capital (Ev-VAIC) chart before the Covid-19 Pandemic (in 2019) and during the Covid-19 Pandemic (in 2020) have been listed companies in the Indonesia Stock Exchange. The yellow color line indicated Intellectual capital before the Covid-19 Pandemic (in 2019), and the blue color line shown Intellectual capital during the Covid-19 Pandemic (in 2020).
Before the Covid-19 Pandemic, MLBI has the highest performance with 11.84 value, and MLBI includes of Food and Beverages sector-sub. However, MLBI has declined Intellectual capital value (performance) with a 4.81 value during the Covid-19 Pandemic. Before and during the Covid19 Pandemic, ALTO has the lowest performance, with a -1.48 to be -2.40 value. ALTO includes Food and Beverages sector-sub too
Whilst during the Covid-19 Pandemic, ICBP have the highest performance, at 13.13 value. ICBP is the Food and Beverages sector-sub too. The lowest performance, namely RMBA, with 1.56 (before the Covid-19 Pandemic) to be -7.81 value. RMBA includes the Tobacco sector-sub.
There is five sector of manufacturing have listed in the Stock Exchange Indonesia or a totally of 45 companies. There are 20 companies in Food & Beverages, four companies in Tobacco, ten companies in Pharmaceuticals, seven companies in Cosmetics & Household, and four companies in Houseware. The Intellectual capital average in the manufacturing sector shown as below as,
as shows in Figure 2.

Figure 2: The Average Intellectual Capital In Manufacturing Sector Companies
Figure 2 presents the company performance of Pharmaceuticals sector (Intellectual capital) before and during the Covid-19 Pandemic, “no significant difference”. The market needs the medicines before the Covid-19 Pandemic and during the Covid-19 Pandemic, with a 3.65 to be 3.59 value. On the other hand, Tobacco companies have had a significant decline in the company performance (Intellectual capital) before the Covid-19 Pandemic to during the Covid-19 Pandemic, with a 4.80 to be 1.92 value. It decreased cigarette production by 12.3% in Mei 2020 and a decrease again to 8.1% in June 2020. It is predicted to decline to continue until the end of the year.
The production decline occurred because the price of cigarettes was increasingly unaffordable by consumers, the purchasing power of the falling people and cigarette tax increased, (kontan.co.id, 2020). The household sector-sub manufacturing companies have had an increase during the Covid-19 Pandemic. It causes that the activities of online shopping transactions are increasing rapidly. Various online shopping promotions are offered during the Covid-19 Pandemic, and 57% of people do online shopping activities through digital (kompas.com, 2020). Further, the analysis data are using the Wilcoxon test that presented as below as, as shows in Table 2.
| Table 2 Analysis Test By Wilcoxon Signed Ranks Test |
|
|---|---|
| Categorize | Score |
| Z account | -0.564b |
| Asymp. Sig (2-tailed) | 0.572 |
Based on Table 2, the resulting study is using the Wilcoxon test showed that Asymp. Sig (2tailed) value of 0.572. The result study is more than probability (p) value, of 0.05 or 0.572>0.05. It means received Null Hypothesis (H0). There is no significant difference between the Intellectual capital before the Covid-19 Pandemic and during the Covid-19 Pandemic.
“The Z account” value of -0.564. “The Z account is less than “the Z table” of -1.96 (.0564<-1.96). It means that was received Null Hypothesis too. The corresponding critical value from the “Z table” (0.025) with test 2 tails is Z > 1.96 or Z < -1.96. There is no significant difference between the Intellectual capital before and during the Covid-19 Pandemic. It is no difference in the Intellectual capital before and during the Covid-19 Pandemic.
Even though, the Covid-19 Pandemic is designated as a national disaster for the based on Table 2, the resulting study using the Wilcoxon test showed that Asymp. Sig (2-tailed) value of 0.572 remains the same in both of the periods. The manufacturing sector is the great demand and needed companies by the market during the Covid-19 Pandemic. No difference in performance (Intellectual capital) between before and during the Covid-19 Pandemic. They are the Food and Beverages, Pharmaceuticals, and Household, except Tobacco and Houseware companies.
Other than the study is also analyzing of the Intellectual capital components, as described below,
Physical Capital
For Value Added Physical-Evaluation (VAPY): DLTA showed the highest physical capital before and during the Covid-19 Pandemic, although the value is declined from 4.44 to be 2.51. Before the Covid-19 Pandemic, LMPI indicated the lowest physical capital with a - 0.22. During the Covid-19 Pandemic, RMBA has the lowest physical capital, with a -7.2 value. It can be seen as follows: as shows in Figure 3.

Figure 3; Value Added Physical-Evaluation In Manufacturing Sector-Sub Companies
Figure 3 presents the average Value Added Physical-Evaluation (VAPY) of 0.64 before the Covid-19 Pandemic and 0.36 value during the Covid-19 Pandemic.
Financial Capital
For Value Added Financial-Evaluation (VAFI): AISA have the highest financial capital before and during the Covid-19 Pandemic, with 6.26 and 2.36 value. Before the Covid-19 Pandemic, LMPI showed the lowest value at -0.55 value, and during the Covid-19 Pandemic, RMBA has the lowest financial capital, with -1.48 value. It can be seen as follow: as shows in Figure 4.

Figure 4: Value Added Financial-Evaluation In Manufacturing Sector-Sub Companies
Figure 4 presents that the average Value Added Financial-Evaluation (VAFI) of 0.71 before the Covid-19 Pandemic and 0.49 during the Covid-19 Pandemic.
Human Capital
For Value Added Human-Evaluation (VAHU): MLBI showed the highest human capital before the Covid-19 Pandemic, with an 8.50 value and during the Covid-19 Pandemic, at 7.62. Before the Covid-19 Pandemic, the lowest human capital was LMPI, with -1.90 value, and RMBA was -6.40 during the Covid-19 Pandemic, as followed in figure 5

Figure 5: Value Added Human-Evaluation In Manufacturing Sector-Sub Companies
The average Value Added Human-Evaluation (VAHU) in the manufacturing sector-sub companies of 2.49 before the Covid-19 Pandemic and 2.22 during the Covid-19 Pandemic.
Structural Capital
For Evaluation-Structural Value Added (STVA): PCAR showed the highest structural capital before the Covid-19 Pandemic, with a 7.89 value. Even though during the Covid-19, the highest structural capital was ICBP with 6.71 value. Before and during the Covid-19 Pandemic, ALTO has the lowest structural capital with -1.93 to be -2.72 value. It can be seen as follows in figure 6

Figure 6: Evaluation-Stuctural Capital Value Added In Manufacturing Sector-Sub Companies
The average Evaluation-Structural Value Added (STVA) of 0.67 before the Covid-19 Pandemic and 0.80 during the Covid-19 Pandemic.
Further, the four components of Intellectual capital are analyzed to determine the value of the relationship between components forming the Intellectual capital and interpreting it, as can be seen in the below table 3.
| Table 3 Result Of Correlation Anaysis |
|||||||||
|---|---|---|---|---|---|---|---|---|---|
| VAPY (BP) | VAFI (BP) | VAHU (BP) | STVA (BP) | VAPY (IP) | VAFI (IP) | VAHU (IP) | STVA (IP) | ||
| VAPY (BP) | Corr. Coefficient |
1 | 0.368* | 0.590** | 0.188 | 0.877** | 0.318* | 0.583** | 0.008 |
| Sig. (2-tailed) | . | 0.013 | 0 | 0.216 | 0 | 0.033 | 0 | 0.961 | |
| VAFI (BP) | Corr. Coefficient |
0.368* | 1 | 0.481** | 0.121 | 0.326* | 0.674** | 0.466** | 0.136 |
| Sig. (2-tailed) | 0.013 | . | 0.001 | 0.43 | 0.029 | 0 | 0.001 | 0.372 | |
| VAHU (BP) | Corr. Coefficient |
0.590** | 0.481** | 1 | 0.626** | 0.520** | 0.257 | 0.836** | 0.411** |
| Sig. (2-tailed) | 0 | 0.001 | . | 0 | 0 | 0.089 | 0 | 0.005 | |
| STVA (BP) | Corr. Coefficient | 0.188 | 0.121 | 0.626** | 1 | 0.196 | -0.042 | 0.538** | 0.741** |
| Sig. (2-tailed) | 0.216 | 0.43 | 0 | . | 0.197 | 0.783 | 0 | 0 | |
| VAPY (IP) | Corr. Coefficient |
0.877** | 0.326* | 0.520** | 0.196 | 1 | 0.369* | 0.636** | 0.088 |
| Sig. (2-tailed) | 0 | 0.029 | 0 | 0.197 | . | 0.013 | 0 | 0.565 | |
| VAFI (IP) | Corr. Coefficient |
0.318* | 0.674** | 0.257 | -0.042 | 0.369* | 1 | 0.509** | 0.017 |
| Sig. (2-tailed) | 0.033 | 0 | 0.089 | 0.783 | 0.013 | . | 0 | 0.911 | |
| VAHU (IP) | Corr. Coefficient |
0.583** | 0.466** | 0.836** | 0.538** | 0.636** | 0.509** | 1 | 0.460** |
| Sig. (2-tailed) | 0 | 0.001 | 0 | 0 | 0 | 0 | . | 0.001 | |
| STVA (IP) | Corr. Coefficient |
0.008 | 0.136 | 0.411** | 0.741** | 0.088 | 0.017 | 0.460** | 1 |
| Sig. (2-tailed) | 0.961 | 0.372 | 0.005 | 0 | 0.565 | 0.911 | 0.001 | . | |
Table 3 presents the correlation analysis of the Intellectual capital components before and during the Covid-19 Pandemic. Four components have a variety of the correlation coefficient and Sig. (2 tailed). Intellectual capital components is analyzed by the Spearman's correlation coefficient and interpreted based on the variable size correlation coefficient, as follow:
1. The relationship between Value Added Physical-Evaluation (VAPY) before and during the Covid-19 Pandemic of 0.000. It means that there was a significant relationship between both of them. The Correlation Coefficient between VAPY before and during the Covid19 Pandemic of 0.877. It means that there was "a high positive correlation".
2. The relationship between Value Added Financial-Evaluation (VAFI) before and during the Covid-19 Pandemic of 0.000. It means that there was a significant relationship between the both of them. The Correlation Coefficient between VAFI before and during the Covid-19 Pandemic of 0.674. It means that there was "a moderate positive correlation".
3. The relationship between Value Added Human-Evaluation (VAHU) before and during the Covid-19 of 0.000. It means that there was a significant relationship between the both of them. The Correlation Coefficient between VAHU before and during the Covid-19 Pandemic of 0.836. It means that there was "a high positive correlation".
4. The relationship between Evaluation-Structural Value Added (STVA) before and during the Covid-19 Pandemic of 0.000. It means that there was a significant relationship between the both of them. The Correlation Coefficient between STVA before and during the Covid-19 Pandemic of 0.741. It means that there was "a high positive correlation".
In summary, companies' performance based on the manufacturing sectors of the Intellectual capital is no different between before and during the Pandemic Covid-19. The proven that Z account is less than Z table or -0.564 < -1.96, and Asymp. Sig (2-tailed) value is more than 0.05 or 0.572 > 0.05. It means that the Null Hypothesis (H0) was received. The relationship of Physical, Human, and Structural capital showed "a high correlation", except Financial Capital showed "a moderate positive correlation" before and during the Covid-19 Pandemic. The VAPY of 0.877 value, VAHU at 0.836 value, STVA at 0.741 value, and VAFI of 0.674 value.
Other studies have been observed and analyzed the economic impact on the manufacturing sector during the Pandemic Covid-19, which have a relation to this study, such as Agustin (2020), this study stated that the sector of Consumer Goods, mining, and Trading performed better than the Market and counted as the most performed Market during the Pandemic Crisis (Covid-19). This study used panel regression to test the effect between variables with market-to-book ratio, and market capitalization ruled as a control variable.
Trisnowati & Arianto (2021) that eight industry sectors have a strong reaction during the Pandemic Covid-19, and one of the sectors, namely the Consumer Goods sector.
Saraswati (2021) stated a decline in share prices in the industry sectors, namely the Consumer Goods company, and have declined of -9,96%. That study analyses the impact of the Pandemic Covid-19 on the Stock Market in Indonesia using a descriptive exploratory method and secondary data collected from BEI and Bappenas RI.
Ambarwati, Astuti & Azzahra (2021) analyzed the condition of companies in the Consumer Goods industry sector before and during the Covid-19 Pandemic by using Current Ratio, Debt to Equity Ratio (DER), Return on Assets (ROA), Return on Equity (ROE), Net Profit Margin (NPM) and Company Size against Firm Value. The resulting study indicated that (1). The Current Ratio had a significant negative effect on the Firm Value before the Pandemic Covid-19. But, it had no significant impact on the Firm Value during the Covid-19 Pandemic, (2) DER had a significant negative effect on the Firm Value before the Covid-19 Pandemic. But, DER had no significant impact on Company Size during the Covid-19 Pandemic (3) ROA before and during the Covid-19 Pandemic had not a significant effect on the Firm Value, (4) NPM had a significant negative impact on the Firm Value before and during the Covid-19 Pandemic, and (6) Company Size had a significant positive effect on Company Value before and during the Covid-19 Pandemic.
Irmayani (2020) examined the impact of the Covid-19 Pandemic on returns of the shares of the Consumer Good Industry sector-sub, in the Indonesia Stock Exchange, with a total of 44 companies. The study is using analysis of the paired sample t-test. The study result is no different before and during the Covid-19 Pandemic. Despite this, the Covid-19 condition was declared a national emergency disaster on the stock returns of the Consumer Good Industry sector-sub in the Indonesia Stock Exchange. There is an average abnormal return value before the Covid-19 Pandemic of 0.00949 and during the Covid-19 Pandemic with a -0.00252 value.
Tambunan (2020) stated that the investors could choose the industry's stocks that have a low risk during the Covid-19 Pandemic, such as pharmaceuticals and hospitals. However, in this case, the investor should provide the fundamental analysis and diversification of stocks to benefit and reduce a big loss risk in investing.
Conclusion
No differences in Intellectual capital between before and during the Covid-19 Pandemic. There has been a high positive correlation between components of Intellectual capital before and during the Covid-19 Pandemic. This is in accordance with the Industry Minister, Agus Gumiwang Kartasasmita, which stated that the manufacturing industry sector is still expansive. The investment value of 88.3 trillion (IDR) could be up 38 per cent compared to the last year's period of 64 trillion (IDR) and have been contributed significantly to 40.2 per cent of the total investment value, which reached Rp219.7 trillion.
The manufacturing companies can survive during the Covid-19 Pandemic, especially in the pharmaceutical sector-sub. It is caused by the public's need for goods such as the medical equipment industry (personal protective equipment PPE/hazmat clothes, hand sanitizer, ethanol, masks, and gloves), pharmaceuticals, and medicines, which have the high demand during the Covid-19 Pandemic. The other than, the Food & Beverages and Cosmetics & Household sector-sub have a decline, although there has no fair different between and during the Covid-19 Pandemic.
The Cosmetics & Household sector-sub companies are not different between before and during the Covid-19 Pandemic. It is caused the products marketed by Cosmetics & Household sector-sub companies still needed and used by market share, whether the all economic conditions. Therefore, the company should change the marketing strategy.
Acknowledgement
The authors wish to thank the Institute for Research and Development of Society (LPPM), Universitas Muhammadiyah Pontianak, for funding this research through the Grant Research of Internal Funding (342/II.3.AU.21/SP/2021).
References
Agustin, I. (2021). How does the impact of the Covid-19 pandemic on Indonesia's Islamic stock returns?JEMA: Jurnal Ilmiah Bidang Akuntansi dan Manajemen, 18(1), 21-35.
Crossref , Google scholar , Indexed at
AlAli, M.S. (2020). The effect of who Covid-19 announcement on Asian Stock Markets returns: An event study analysis.Journal of Economics and Business, 3(3), 1051-1054.
Crossref , Google scholar , Indexed at
Ambarwati, S., Astuti, T., Azzaahra, S. (2021). Determinants of Company Value Before and During the Covid19 Pandemic.Business Economic, Communication, and Social Sciences, 3(2), 79-89.
Crossref ,
Andriessen, D., Frijlink, M., Van Gisbergen, I., & Blom, J. (1999). A core competency approach to valuing intangible assets.International Symposium, Measuring and Reporting Intellectual Capital: Experiences, Issues and Prospects, 1-18. Amsterdam: University of Professional Education, the Netherlands.
Batubara, S.M., Sahari, S., & Jais, M. (2021). Evaluation-Value Added Intellectual Coefficient (Ev-VAIC) model expansion: The new measurement model for Intellectual Capital.International Journal of Academic Research n Accounting, Finance and Management Science, 10(4), 59 - 72.
Batubara, S.M., Sahari, S., & Jais, M. (2021). Implementation of evaluation-value added intellectual coefficient (Ev-VAIC) as expansion of intellectual capital measurement model.Academy of entrepreneurship journal, 27(5), 112.
Crossref ,
BKPKM. (2020). Foreign Investment into Indonesia in Covid-19 Era increased. Indonesia: BintangBisnis. Collins. (2020). Effect of Covid-19 pandemic on global. Stock market values: A differential analysis. Acta
Universitatis Danubius (Economica), 16(2), 255-269.
He, P., Sun, Y., Zhang, Y., & Li, T. (2020). Covid-19’s Impact on stock prices across different sectors—An event study based on the Chinese stock market.Emerging Markets Finance and Trade, 56(10), 2198–2212.
Crossref , Google scholar , Indexed at
IBEC. (2003). Intellectual capital: efficiency in Croatian economy. London: IBEC.
Irmayani, N.W. (2020). The impact pandemic Covid-19 to market reaction in the consumer of goods industry sector. E-Journal of Economics and Business Udayana University, 9(12), 1227-1240.
Juneidi, D., & Faisal, S. (2020). The impact of the Covid-19 pandemic on the capital market in Indonesia: A case study of the composite stock index (ISHG). Al-Kharaj: Islamic Journal of Economics, Finance & Business, 2(2), 109-131.
Kompas.com. (2020). An online shopping activity increases drastically. Here's Why. (S. R. Setiawan, Ed.) Jakarta, Indonesia.
Kontan.co.id. (2020). This year has been a tough year for the cigarette industry. (K. Hidayat, Ed.) Jakarta, Indonesia.
La Rocca, M., La Rocca, T., & Cariola, A. (2008). Corporate governance, intellectual capital and value creation.The ICFAI University Journal of Corporate Governance, 7(3), 7-30.
Crossref , Google scholar , Indexed at
Lalwani, V., & Meshram, V.V. (2020). Stock market efficiency in the time of Covid-19: Evidence from industry stock returns.International Journal of Accounting & Finance Review, 5(2), 40–44.
Crossref , Google scholar , Indexed at
Lee, K.Y-M., Jais, M., & Chan, C.W. (2020). Impact of Covid-19: Evidence from Malaysian.International Journal of Business and Society, 21(2), 607-628.
Crossref , Google scholar , Indexed at
Liu, H.Y., Manzoor. A., Wang, C.Y., Zhang, L., & Manzoor, Z. (2020). The Covid-19 outbreak and affected countries stock market response.International Journal of Environmental Research and Public Health, 17(8), 1-19.
Crossref , Google scholar , Indexed at
Mouritsen, J., Larsen, H.T., & Bukh P.N. (2001). Intellectual capital and “the capable firm: narrating, visualizing and numbering for managing knowledge.Accounting, Organizations and Society, 26(7-8), 735-762.
Crossref , Google scholar , Indexed at
Mukaka, M. (2012). A guide to appropriate use of Correlation coefficient in medical research.Malawi Medical Journal, 24(3), 69-71.
Pulic, A. (2000). VAIC™ – an accounting tool for IC management.Int. J. Technology Management, 20(5/6/7/8), 702– 714.
Crossref , Google scholar , Indexed at
Sahari, S., & Santy, M.B. (2019). The identification of Indonesia and Malaysia company performance based on intellectual capital.Asian Economic and Financial Review, 9(10), 1171-1183.
Saraswati, H. (2020). The impact of the Covid-19 Pandemic on the stock market in Indonesia.JAD: Dewantara's Journal of Accounting and Financial Research, 3(2), 153-163.
Stewart, T. (1997). Intellectual capital: The New Wealth of Organizations. London: Nicholas Brealey. Tambunan, D. (2020). Stock investment during the Covid-19 pandemic. Widya Cipta: Secretarial and Management Journal, 4(2), 117-123.
Trisnowati, Y., & Arianto, M. (2021). Covid-19 and stock market reaction in Indonesia.Journal of Accounting and Investment, 22(1), 23-36.
Crossref , Google scholar , Indexed at
Received: 10-Dec-2021, Manuscript No. ASMJ-21-10257; Editor assigned: 12-Dec-2021, PreQC No. ASMJ-21-10257(PQ); Reviewed: 28-Dec-2021, QC No. ASMJ-21-10257; Revised: 02-Jan-2022, Manuscript No. ASMJ-21-10257(R); Published: 10-Jan-2022