Research Article: 2022 Vol: 23 Issue: 6S
International Scientific Co-Publications in Europe
Angelo Leogrande, LUM University Giuseppe Degennaro
Alberto Costantiello, LUM University Giuseppe Degennaro
Lucio Laureti, LUM University Giuseppe Degennaro
Marco Maria Matarrese, University Giuseppe Degennaro
Citation Information: Leogrande, A., Costantiello, A., Laureti, L., & Matarrese, M.M. (2022). International scientific co-publications in europe. Journal of Economics and Economic Education Research, 23(S6), 1-15.
Abstract
The determinants of “International Scientific Co-Publications” in Europe are analyzed in the following article. Data from the European Innovation Scoreboard-EIS of the European Union for 36 countries in the period 2010-2019 were used. The data were analyzed using Panel Data with Fixed Effects, Panel Data with Random Effects, Pooled OLS, WLS, Dynamic Panel. The results show that the variable “International Scientific Co-Publication” is negatively associated with “Employment Share Manufacturing”, “Intellectual Assets”, “Turnover Share Large Enterprises”, “Linkages” and positively associated with “SMEs innovating in house”, “Trademark Applications”, “Human Resources”, “Public-private co-publications”, “Attractive Research Systems”, “Government procurement of advanced technology products”, “Turnover Share SMEs”. Then, a clustering analysis is realized with the algorithm k-Means. The Silhouette Coefficient and the Elbow Method are confronted to optimize the k-Means algorithm. The results show that the Elbow method is more efficient than the Silhouette coefficient in identifying the optimal number of clusters corresponding to k = 4 with the k-Means algorithm. A network analysis was then carried out using the “Manhattan Distance”. The analysis shows the presence of 9 network structures of which 5 are complex i.e., with a number of linkages greater than 3, and 4 are basic i.e. consist of a single link between two countries. Furthermore, we confront eight different machine learning algorithms to predict the future level of “International Scientific Co-Publications”. We found that the best algorithm in performing prediction with original data is the Tree Ensemble Regression. The predicted value of “International Scientific Co- Publication” is expected to growth by 0.61%
Keywords
Innovation, and Invention: Processes and Incentives; Management of Technological Innovation and R&D; Diffusion Processes; Open Innovation.
JEL Classification
O30; O31, O32; O33; O36
Introduction
The following article analyzes the determinants of international scientific collaborations in Europe. International scientific collaborations are relevant both for allowing the development of research systems at national level and for the transfer of knowledge. However, although there are many advantages in extending international scientific collaborations, not all countries are able to participate and be present in the network structures of researchers.
Issues of international politics and international trade play a role in defining the relationships between scientists, universities, and research centers at the international level. Indeed, as shown in the literature review in paragraph 2, Russia's conquest of Crimea in 2014 significantly reduced scientific collaborations between Russia and Europe. In this sense, there are concerns about international scientific collaborations between China and the US. In fact, the tech-war between China and the US could also have an effect in reducing international scientific collaborations, reducing exchanges between scientists and research centers. It follows that the possibility for scientists to collaborate at an international level and to create networks essentially depends on the existence of a global order of peace, which is oriented towards international trade, and on good practices of relations and dialogue between countries and peoples.
Furthermore, it should be considered that the development of databases relating to international scientific publications, as for example in the case of Scimago, Scopus and Web of Science, have significantly increased the structure of the data that can be used to trace the relationships between scientists at an international level. From this derives the possibility of applying machine learning and artificial intelligence algorithms to identify those scholars and those research topics that are essential for the development of science and the profession in a certain scientific discipline. This orientation is essential and allows us to identify any marginal or minority groups and identify trends that could become hegemonic.
Furthermore, to this abundance of data and analytical tools of an algorithmic nature are added megatrends that have increasingly seen the prevalence of collaborative and cooperative forms in scientific research in place of the old model of the author who signed his own research alone. In any case, it must be borne in mind that the expansion in international scientific collaboration that has certainly taken place thanks to globalization seems to have met with a significant setback both in the 2014 Crimean war and in Russia's current aggression against Ukraine. Furthermore, tensions between China and the US over the Taiwan issue could further reduce international scientific collaborations between China on the one hand and the US, UK, and EU on the other. These contrasts, in addition to being dangerous from the point of view of the stability of the international political order, risk diverting investments from research and development to military defense, reducing the degree of accumulation of knowledge that has sustained both in the East and in the West. The growth of the quality of life and the exit from poverty of millions and billions of people. Therefore, the development of international scientific collaborations is a sign of the good progress of relations between countries and the resumption of globalization as a phenomenon of well-being even in its contradictions.
The article continues as follows: the second paragraph contains the analysis of the literature, the third paragraph presents the results of the econometric model, the fourth paragraph contains the clustering with the k-Means algorithm, the fifth paragraph illustrates the results of the network analysis, the sixth paragraph compares eight different machine learning algorithms for prediction, the seventh paragraph concludes. The appendix contains the metric results to support the analysis.
Literature Review
The authors highlight the growing degree of scientific collaboration between the United States and China that occurred during Covid 19 and which has continued despite political friction between the countries (Lee & Haupt, 2020). They analyze the case of scientific collaboration and through research programs between the European Union and Turkey. The authors underline that the European Union has invested approximately 167.6 million euros in Turkey involving Turkish universities in scientific collaboration with European research institutes with the aim of creating scientific publications aimed at the international scene (Dimov et al., 2020). They analyze the degree of internationalization of Indonesian mathematicians and statisticians. The authors use the tools of the network analysis and verify the centrality of the Bandung Institute of Technology-ITB Nadhiroh et al. (2018); Shekofteh et al. (2017) tackle the issue of scientific collaboration and the presence of co-authors in the pharmacological research sector in Iran using the Web of Science data between 2003 and 2014. Applying a network analysis model, the authors find a scarce presence of co-authorship (Singh & Jolad, 2019). Analyze the case of the co-authorship of Indian authors published in the journals of the American Physical Society between 1919 and 2013. The results of the analysis show a dominance of relations between Indians and foreign co-authors rather than between Indians and Indians. Molontay & Nagy (2021) analyze 31,763 scientific articles and build a co-authorship network of 56,646 authors. Using this method, the central authors by scientific sector and the largest scientific communities are also identified De Moya-Anegon et al. (2018) the structure of co-authorship based on data from SIR database of Scimago. The authors find that the degree of international collaboration between the co-authors represents the degree of scientific development of a certain country. Nazarovets (2020) considers the role of Ukrainian researchers who are co-authors of the Nobel Prizes. The analysis is useful for identifying models that may lead to a growth of the research system in Ukraine using virtuous models of international scientific collaboration. The result highlighted the presence of 31 publications between 1994 and 2018 by Nobel Laureates with co-authors of researchers working in Ukrainian universities. Hu et al. (2019) analyze co-authorship models in the US, UK, and China. The authors distinguish between cited and non-cited publications. The results show that in the US and the UK there is a substantial difference in the network structures of the cited and non-cited publications. This distinction is absent in China where, on the contrary, the network structure of the scientific publications cited and not cited have similar structures Belli & Balta (2019) consider the role of scientific collaborations between 28 countries of the European Union, Latin America, and the Caribbean between 2005 and 2016. The results show the presence of a particular scientific collaboration between researchers from the indicated countries Appendix –I.
Jeck & Balaz (2020) analyze the structures of international scientific collaborations in Europe between 1993 and 2017. The authors show that the growth of student exchanges between universities has increased scientific collaborations between authors without changing the historical scientific relations between countries Makkonen & Mitze (2021) analyze the progress of international scientific relations between Russia and Europe following the sanctions imposed on Russia in 2014. The results show that following the sanctions against Russia, scientific collaboration between Russia and Europe has significantly decreased, and based on the cohorts analyzed, from a minimum of 15% up to a maximum of 70% (Makkonen & Mitze, 2021). Address the issue of ethics and sustainability in co-authored practices between PhD students and supervisors. Lokhtina et al., (2022) analyze the structure of scientific collaborations between co-authors in the field of computer science. Results show that the areas of greatest collaboration include "Artificial Intelligence", "Human Computer Interface" and "Database Applications" (Ullah et al., 2022). Compare the Google Scholar results of about 402 thousand scientists using the structures of the Social Network Analysis-SNA. The results show the presence of a significant correlation between Page Rank and h-index. Chen et al. (2017) analyze the networks of international scientific publications of German scientists using scientific journals present in Scopus. The goal is to analyze the knowledge transfer that occurs in connection with international scientific collaborations. The period analyzed is between 2007 and 2015. The results show that scientists who have international mobility also have greater ability to practice knowledge transfer Ama (2018) analyze the structures of international scientific collaborations, considering the articles published in eighty scientific disciplinary journals between 1989 and 2013. The results highlighting some macro-trends: 1) the average number of authors per article has grown from 1.67 to at 2.39; 2) articles with sole co-author decreased from 60% to 35%. These phenomena show a growing trend in the network structures of co-authors in scientific publications Appendix -II.
Victor et al. (2017) analyze the determinants of China's international scientific collaborations using Web of Science data. The data show that China collaborated with about 147 countries in the world in the period between 2008 and 2015. The results show that the determinants of the collaborations put in place by Chinese scientists refer first to sectoral scientific specialization and secondly to linguistic affinity (Victor et al., 2017). Applied machine learning algorithms to identify the network structure and central players in media research in the cardiovascular field Zhang & Guo (2017) consider the development of networks of researchers in the field of accounting. 10,863 articles published in 22 accounting journals were analyzed in the period between 2000 and 2016. The data show that articles with a single co-author decreased significantly over the period considered. However, the network structure shows a predominance of some research groups over others Appendix -III
The Econometric Model to Estimate the Determinants of International Scientific Co-Publications in Europe
We have estimated the following econometric model:
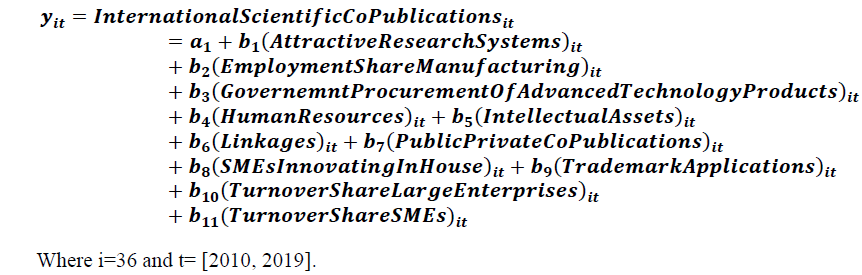
We Found that International Scientific Co-Publications is Positively Associated to:
Smes innovating in-house: it is a variable that considers the degree of internal innovation of SMEs. In particular, the indicator consists of a ratio between small and medium-sized enterprises that innovate as a percentage of the total number of small and medium-sized enterprises. Innovation is aimed at both process innovation and product innovation. This indicator only considers small and medium-sized enterprises. Large companies are excluded from the indicator as generally large companies always have their own internal departments that deal with research, development, and technological innovation. There is therefore a positive relationship between small and medium-sized enterprises that innovate and the ability to make international publications. Obviously, if companies have an interest in internal innovation, they can more easily seek international partnerships that can also lead to research and development output figure 1.

Figure 1: Synthesis Of The Estimations Of The Econometric Model.
Trademark Applications: it is a variable that considers the number of trademark applications filed with the European Union Intellectual Property Office on gross domestic product. Brands hold an essential value for companies from the point of view of technological innovation. Community recognition allows companies to use trademarks throughout the territory of the European Union. Trademarks are necessary for companies both to be correctly identified by consumers, and also to acquire market power and intangible value to be included in the financial statements. There is therefore a positive relationship between the value of trademark applications and the value of international scientific collaborations. In other words, in the countries where there are more companies that register trademarks, there are also greater collaborations aimed at international scientific publications. The trademark application variable, as well as the international scientific collaboration variable, are variables capable of representing the complexity of innovation at the country level Appendix –IV.
Human resources: is a complex variable made up of the sum of two variables: “New Doctorate Graduates” and “Population with Tertiary Education”. The human resources variable is therefore able to highlight the presence of a segment of the population with the necessary knowledge to be able to act in the knowledge economy, technological innovation and research and development. There is therefore a positive relationship between the “International Scientific Co-Publications” variable and the “Human Resources” variable. This relationship is mainly since within the analyzed variable there is the "New Doctorate Graduates" component. In fact, research doctorates are generally engaged in carrying out research activities abroad and therefore have the possibility of developing international scientific relations that can lead them to publish in international scientific journals with foreign co-authors (Higaki et al., 2020).
Public-private co-publications: is a variable that considers public-private publications per million inhabitants. There is therefore a positive relationship between the countries that have a high number of public-private publications and the number of international scientific publications based on collaboration between researchers, research institutes and universities. This relationship can therefore be better understood considering that generally the countries in which researchers have the greatest capacity to produce international scientific publications are also the countries that have the greatest collaboration between the public and the private sector in the sense of publications. In this sense, it is necessary to consider that it is often the research and publication projects between public and private that involve relations with foreign scientific institutes that give rise to collaborations for international scientific publications Appendix –V.
Attractive research systems: is a variable that defines the attractiveness of the scientific system at a national level based on the presence of foreign doctorates, and the competitiveness of the national research system in terms of publications and internationalization. There is therefore a positive relationship between the value of the “Attractive Research Systems” variable and the value of the “International Scientific Co-publications” variable. That is, this relationship means that if a country has a very attractive research system there is also the possibility of increasing international collaborations in scientific publications. That is, the countries that have greater attractiveness of the scientific research system also have a greater chance of having international relations aimed at scientific publications. Obviously, the countries that have the greatest capacity to invest in research and development also have the possibility of weaving significant international relations for scientific research (Kılıc et al., 2019).
Government procurement of advanced technology products: Is a variable that measure the degree of public procurement technology. This indicator varies from 1 to 7 based on whether the purchase decisions of technological products depend on the price, in which case the value 1 is assigned, or based on whether the purchases were made based on technical and innovative performance. There is therefore a positive relationship between the value of the "International Scientific Co-Publications" variable and the value of public contracts for the purchase of technological products. It follows that the countries where states show greater attention to technology in public procurement are also the same countries that have an increasing number of "International Scientific Co-Publications". It follows therefore that both variables are representative of an environment positively aimed at technological innovation and research and development that also uses public leverage to increase investment in the knowledge economy.
Turnover share SMEs: is an indicator that measures the percentage of the turnover of SMEs on the total turnover of all companies - including large and very large companies - at a country level with the exclusion of financial and insurance activities. There is therefore a positive relationship between the turnover of SMEs and the presence of "International Scientific Co-Publications". This positive relationship indicates that where SMEs are more aggressive from a market and turnover point of view, there is also a greater capacity on the part of the research system to undertake international scientific relations. In fact, where large companies already have internal research and development departments that can independently generate results in terms of scientific publications, SMEs must find opportunities for international collaboration in research, not being able to invest independently (Costantiello et al., 2021).
We also Found that the Variable International Scientific Co-Publication is Negatively associated to:
Employment share manufacturing: Is the share of employment in the manufacturing sector. There is a negative relationship between the value of manufacturing employment and the value of the International Scientific Co-Publication. This relationship must be best investigated. In fact, the manufacturing sector companies are generally medium-large companies which to produce they need to purchase a set of plants and machinery. These types of companies in generation have the possibility of setting up research and development centers which are internal to the company, and which are used to develop the company's products. It follows therefore that these companies have less interest and less incentive to establish international collaborations that are aimed at scientific publications: And since the size of the companies also depends in a certain way on the number of employees, it follows that the greater the number of employees in the manufacturing sector, the greater the likelihood that the company will be able to carry out research and development activities independently with its own departments and organizational structures (Leogrande & Costantiello, 2021).
Intellectual assets: Is a variable that considers the set of intangible assets that are produced within a country-level economy such as brands, patents, and design solutions. This variable is placed in a negative relationship with the presence of “International Scientific Co-Publications”. This negative relationship can be better understood considering that if the economy at the national level has the possibility of producing intangible goods internally then there are fewer incentives for companies and research organizations to find international partnerships. Furthermore, it must be considered that a significant part of intangible assets, especially patents, are the actual product of investments in research and development. However, precisely because the R&D investments that lead to patents are necessary for companies to make a profit, it is very likely that these take place internally rather than externally as in the case of collaborations that end in international scientific collaborations (Leogrande et al., 2020).
Turnover share large enterprises: Is the share of the turnover of large companies on the total value of the turnover of companies operating in the economic system with the exclusion of financial and insurance companies. Large enterprises are enterprises with more than 250 employees. There is therefore a negative relationship between the value of the turnover of large companies and the value of the "International Scientific Co-Publications". This negative relationship can be understood considering that generally large companies have the possibility of organizing research and development departments within themselves that can generate technological innovation and research and development. It follows therefore that these companies have little incentive to invest in international scientific collaborations and instead have a greater interest in carrying out research internally also to defend themselves against the competition with specific patents and copyrights figure 2.

Figure 2:Mean Of The Regression Results To Estimate The Value Of International Scientific Co-Publication. Source: Eis-European Innovation Scoreboard.
Linkages: Is a variable made up of the sum of "Innovative SMEs collaborating with others", "Public-Private Co-Publications for Million Population", "Job to Job Mobility of Human Resources in Science and Technology". It follows therefore that there is a negative relationship between the variable Linkages and the variable "International Scientific Co-Publications". This relationship can be better understood considering that if companies can create relationships aimed at innovation with other small and medium-sized enterprises present in the area and also with public institutions, then they do not have as many incentives to seek collaborations abroad to create scientific projects aimed at international publications.
It should be considered that from the point of view of the variables that have a greater impact in determining the amount of “International Scientific Co-Publications”, the variable that has the greatest positive impact is “Turnover Share SMEs” with an average value of 0.93 and “Government procurement of advanced technology products” with an amount of 0.84 units. The variables that have a more significant negative impact on average are “Employment Share in Manufacturing” with a value of -0.668 units and “Turnover Share Large Enterprises” with a value of -0.667 units (Laureti et al., 2020).
Clusterization with k-Means Algorithm
A clustering was carried out below using the k-Means algorithm. However, since the k-Means algorithm is not supervised, it is necessary to identify a criterion to choose the optimal number of clusters. In this sense, the Silhouette coefficient was first chosen. Subsequently, the optimal result of the Silhouette coefficient was compared with the Elbow method to verify whether in the transition from the Silhouette coefficient and the Elbow method there is an increase in the efficiency in the representation of European geographical areas by value of the observed variable. . By applying the Silhouette coefficient, two different clusters are then identified as indicated below, namely:
Cluster 1: Serbia, Montenegro, Latvia, Hungary, Poland, Lithuania, Slovakia, Bosnia, Croatia, Bulgaria, Romania, North Macedonia, Turkey, Greece, Italy, Ukraine, Spain, Czech Republic, Malta, France, Germany, Israel
Cluster 2: Norway, Sweden, Finland, Luxembourg, Netherlands, Denmark, Austria, Belgium, Cyprus, Switzerland, Iceland, Ireland, United Kingdom, Slovenia, Estonia, Portugal Appendix –VI.
By analyzing the value of the median of the clusters, it is possible to order the clusters by value of the observed variable. It therefore follows that the median value of the observed variable is C2 with a value equal to 207 and C1 with a value equal to 103. It therefore follows that C2 = 207> C1 = 103. Looking at the geographic structure of clustering, the presence of a dichotomy between the countries of Northern Europe and the countries of Central-Southern Europe appears absolutely evident. There is therefore a substantial contrast between geographical areas of Europe which highlights a very significant divide since the ability of the C2 countries to collaborate in international scientific publications is about double the value of the C1 countries.
The Elbow method was used as an alternative to the Silhouette coefficient. In the Elbow method the following function is analyzed, namely Figure 3.

Figure 3:Optimal Number Of Clusters With The Elbow Method.
When plotting this function, the point at which the function exhibits a significant variation is chosen, that is a sort of elbow. The Elbow Method shows that the optimal number of clusters is not 2, as indicated in the optimization of the Silhouette coefficient, but rather 4. The clusters are then re-calculated using the k-Means algorithm based on to the indications of the Elbow method. The four clusters are made up as follows:
• Cluster 1: Spain, Czech Republic, France, Malta, Italy, Greece, Germany, Croatia, Bosnia, Israel, Slovakia, Portugal, Estonia, Lithuania, Hungary
• Cluster 2: Finland, the Netherlands, Austria, Belgium, Cyprus, Norway, Sweden, Ireland, Luxembourg, United Kingdom, Denmark, Slovenia
• Cluster 3: Iceland, Switzerland
• Cluster 4: Romania, North Macedonia, Bulgaria, Turkey, Ukraine, Poland, Montenegro, Latvia, Serbia.
Therefore, looking at the median of the clusters it is possible to identify the following orderings, namely: C3 = 277.22> C2 = 207.25> C1 = 115.89> C4 = 47.61. It follows therefore that analyzing the geographical map with the four clustering results in four areas, namely: Iceland and Switzerland, Northern Europe, Central-Southern Europe, and Eastern Europe. It is therefore evident that the clustering suggested with the Elbow method is better able to represent the various geographical areas. Therefore, if we consider the heterogeneity that is highlighted by the Elbow method, it follows that the Elbow method is to be preferred over the Silhouette coefficient Figure 4.

Figure 4:Clusterization With The K-Means Algorithm Optimized With The Elbow Method.
Network Analysis with Manhattan Distance
A network analysis was carried out below using the distance to Manhattan. The analysis shows the presence of a set of network structures. Nine network structures have been identified, 4 of which are simple network structures and 5 are complex network structures.
Complex Networks: There is a complex network made up of Germany, France, the Czech Republic, Italy, Malta, Spain, and Greece. This network can be better explored as indicated below, that is:
Germany is connected to France with links having a value of 0.45 units
France is connected to the Czech Republic with a link having a link with a value of 0.48 units, with Spain with a link having a value of 0.2
Malta is connected to the Czech Republic with a link with a value of 0.2 and is connected to Spain with a link with a value of 0.45
Spain has a connection with France with a link of 0.2, with Malta with a value of 0.45, with the Czech Republic with a value of 0.31 and with Italy with a link with a value equal to 0.3.
Italy has a connection with the Czech Republic with a link equal to 0.46 units, with Spain with a link equal to 0.33 units, and with Greece with a link with a value of 0.092
Greece has a connection with Spain with a link equal to 0.4, and with Italy with a link having a value of 0.092 units.
Another complex network structure exists between Bosnia and Herzegovina, Slovakia, and Croatia. The links between these countries are indicated below, namely:
Bosnia is connected to Croatia with a link with a value of 0.0 and with Slovakia with a link with a value of 0.19.
Slovakia is connected to Bosnia with a link with a value of 0.19 and with Croatia with a link with a value of 0.19.
Croatia is connected to Bosnia with a link with a value of 0.00, and with Slovakia with a link with a value of 0.19.
There is also a Complex Network of Ireland, Slovenia and The UK. The Links Between These Countries are Indicated Below, Namely:
Ireland has a connection with the United Kingdom equal to a value of 0.19 units and with Slovenia with a value of 0.38 units
Slovenia has a connection with Ireland equal to 0.38 units and with the United Kingdom with a value equal to 0.21 units
United Kingdom is connected to Slovenia with a link equal to 0.21 units and with Ireland with a link having a value of 0.19 units.
Another complex network structure is established between Luxembourg, Sweden, and Norway with the following links, namely:
Luxembourg is positively associated with Sweden with a link having a value of 0.4 units;
Sweden is associated with Luxembourg with a link with a value of 0.4 units and with Norway with a value of 0.4 units.
Finally, the last complex network structure identified using network structures optimized with the distance of Manhattan is made up of Serbia, Latvia and Montenegro with the values indicated below, namely:
Latvia is connected to Serbia with a link with a value of 0.43 units and is connected to Montenegro with a link with a value of 0.48 units
Serbia is connected to Montenegro with a link with a value of 0.33 and with Latvia with a value of 0.43
Montenegro is connected to Latvia with a link with a value of 0.48, and to Serbia with a value of 0.33 units.
Simple networks. In addition, there are 4 simple network structures, i.e. bi-univocal, or consisting of two countries. These simple network structures are indicated below, namely:
There is a link between Austria and Belgium with a value of 0.096
There is a link between Romania and Bulgaria with a value of 0.35
There is a link between Estonia and Portugal with a value of 0.42
There is a link between Ukraine and Turkey with a value of 0.3 units.
It should be considered that the presence of such network structures does not identify a causal structure among the countries indicated, but rather refers to the presence of an intrinsic dynamic in the data that manifests the connection structures between various countries.
Machine Learning and Predictions
An analysis was carried out with machine learning algorithms for the prediction of the future value of the variable “International Scientific Co-Publications”. Eight different algorithms were compared for prediction. The algorithms have been classified based on the ability to maximize R-squared and minimize statistical errors, namely "Mean Absolute Error", "Mean Squared Error", "Root Mean Squared Error". The algorithms were trained with 70% of the available data while the remaining 30% was used for the actual prediction. The following algorithm order was therefore identified below, namely:
Tree Ensemble Regression with a payoff value of 9
Linear Regression with a payoff value of 11
Gradient Boosted Tree Regression with a payoff value of 15
PNN-Probabilistic Neural Network with a payoff value of 16
Simple Regression Tree with a payoff value of 17
Polynomial Regression with a payoff value of 23
Random Forest Regression with a payoff value of 28
ANN-Artificial Neural Network with a payoff value of 30.
Therefore, using the best performing algorithm or Tree Ensemble Regression, the following predictions for the following countries are indicated, namely:
Belgium: with an increase from a value of 176.76 up to a value of 193.31 or an absolute change equal to an amount of 16.55 units equal to an amount of 9.36%
Bulgaria: with an increase from an amount of 47.61 up to a value of 51.73 units or equal to an absolute change of 4.13 and a percentage change equal to an amount of 8.68%
Germany: with an increase from an amount of 120.88 units up to a value of 123.62 units or equal to a change of 2.75 units equal to a change of 2.28%
Denmark: with a decrease from an amount of 239.21 units up to a value of 226.51 units or equal to a variation of -12.69 units equal to a variation of -5.30%
Estonia: with a decrease from an amount of 172.81 units up to a variation of 155.30 units or equal to a variation of -17.51 units equal to a variation of -10.13%
Spain: with an increase from an amount of 115.89 units up to a value of 119.778 units or equal to a variation of 3.89 units equal to a value of 3.35%
Finland: with a decrease from an amount of 212.01 units up to a variation of 220.83 units equal to a variation of 8.82 units or equal to a variation of 4.16%
Israel: with an increase from an amount of 137.08 units up to a value of 145.223 units or equal to a variation of 8.15 units equal to a variation of 5.94%
Iceland: with a decrease from an amount of 277.22 units up to an amount of 259.27 units or equal to a change of -17.95 units equal to an amount of -6.47%
Latvia: with a decrease from an amount of 90.39 units up to a value of 81.08 units or equal to a value of -9.30 units equal to a value of -10.29%
Serbia: with an increase from an amount of 78.47 units up to a value of 92.88 units or equal to a value of 14.41 units equal to an amount of 18.36%
Slovenia: with an increase from an amount of 168.78 units up to a value of 178.66 units or equal to a variation of 9.89 units equal to a value of 5.86%.
On average, the value of the “International Scientific Co-Publications” for the countries indicated is predicted to grow from an amount of 153.09 units up to a value of 154.02 units or equal to a value of 0.93 units equal to a value of 0.61%.
Conclusion
In this article we analyzed a variable contained in the European Innovation Scoreboard-EIS or "International Scientific Co-Publications". The abundance of data on international scientific publications through Scopus, Scimago and Web of Science allows us to precisely outline the features of the phenomenon observed. Among the macro-trends of the sector there is certainly the reduction of articles with a single author and the strengthening of networks around particularly prolific and cited authors.
To identify the determinations of international scientific publications, panel econometric techniques were applied which demonstrate that the variable that most of all has a positive impact on international scientific publications is "Turnover Share SMEs" while the variable that has a more significant negative impact is "Employment Share Manufacturing ". The analysis shows that indeed where small and medium-sized enterprises are more active and innovative there is also a greater ability to create international research projects that also give rise to publications. On the other hand, in those countries where large companies are present, there are fewer collaborations since companies tend to have internal research and development departments and need to defend their innovations with patents and copyrights. A cluster analysis was then performed with the k-Means algorithm. Two optimization methods were used, namely the Silhouette coefficient and the Elbow method. The Elbow method was preferred for its ability to give greater representativeness to existing groupings in the European Union. The data show a contrast between Scandinavian and Northern Europe on the one hand - with high levels of international scientific collaboration - and Southern and Eastern Europe - with significantly lower levels. Furthermore, a network analysis with Manhattan was carried out and 5 complex network structures were found, demonstrating how the phenomenon of international scientific collaboration presents elements of significant interaction between European countries. Finally, to predict the trend of the observed variable, a comparison was made between eight different machine learning algorithms and the result highlighted that the best performing algorithm is Tree Ensemble Regression. The algorithm predicted an increasing value of the variable by an amount equal to 0.61%.
Appenix
| Appendix – I Variables |
||
| Y | International Scientific Co-Publications | A30 |
| X | Employment share Manufacturing (SD) | A12 |
| X2 | Intellectual assets | A29 |
| X3 | Turnover share large enterprises (SD) | A57 |
| X4 | Linkages | A33 |
| X5 | SMEs innovating in-house | A52 |
| X6 | Trademark applications | A56 |
| X7 | Human resources | A23 |
| X8 | Public-private co-publications | A45 |
| X9 | Attractive Research systems | A1 |
| X10 | Government procurement of advanced technology products (SD) | A22 |
| X11 | Turnover share SMEs (SD) | A58 |
| Appendix II Model 986: Fixed Effects, Using 360 Observations Including 36 Cross Section Units Time Series Length = 10 Dependent Variable: A30 |
|||||
|---|---|---|---|---|---|
| Coefficient | Error Std. | ratio t | p-value | ||
| const | −0,199892 | 1,89409 | −0,1055 | 0,9160 | |
| A1 | 0,646136 | 0,0557631 | 11,59 | <0,0001 | *** |
| A12 | −0,636830 | 0,139074 | −4,579 | <0,0001 | *** |
| A22 | 0,793543 | 0,101515 | 7,817 | <0,0001 | *** |
| A23 | 0,463689 | 0,0667700 | 6,945 | <0,0001 | *** |
| A29 | −0,523914 | 0,0839539 | −6,240 | <0,0001 | *** |
| A33 | −0,404870 | 0,0751869 | −5,385 | <0,0001 | *** |
| A45 | 0,463938 | 0,0369668 | 12,55 | <0,0001 | *** |
| A52 | 0,329115 | 0,0540378 | 6,090 | <0,0001 | *** |
| A56 | 0,345511 | 0,0480174 | 7,196 | <0,0001 | *** |
| A57 | −0,482925 | 0,132616 | −3,642 | 0,0003 | *** |
| A58 | 0,873641 | 0,130419 | 6,699 | <0,0001 | *** |
| Appendix III Model 987: Pooled Ols, Using 360 Observations Including 36 Cross Section Units Time Series Length = 10 Dependent Variable: A30 |
|||||
|---|---|---|---|---|---|
| Coefficient | Error Std. | ratio t | p-value | ||
| const | −0,829547 | 2,21802 | −0,3740 | 0,7086 | |
| A1 | 0,621407 | 0,0353755 | 17,57 | <0,0001 | *** |
| A12 | −0,730392 | 0,110355 | −6,619 | <0,0001 | *** |
| A22 | 0,911086 | 0,0678185 | 13,43 | <0,0001 | *** |
| A23 | 0,609702 | 0,0480095 | 12,70 | <0,0001 | *** |
| A29 | −0,607980 | 0,0596825 | −10,19 | <0,0001 | *** |
| A33 | −0,469712 | 0,0555420 | −8,457 | <0,0001 | *** |
| A45 | 0,433789 | 0,0246470 | 17,60 | <0,0001 | *** |
| A52 | 0,413941 | 0,0414492 | 9,987 | <0,0001 | *** |
| A56 | 0,328436 | 0,0348935 | 9,413 | <0,0001 | *** |
| A57 | −0,914220 | 0,101099 | −9,043 | <0,0001 | *** |
| A58 | 1,19938 | 0,120215 | 9,977 | <0,0001 | *** |
| Appendix - iv Model 989: wls, using 360 observations Including 36 cross section units Dependent variable: a30 Weights based on error variances per unit |
|||||
|---|---|---|---|---|---|
| Coefficient | Error Std. | ratio t | p-value | ||
| const | 0,700508 | 1,36732 | 0,5123 | 0,6088 | |
| A1 | 0,725349 | 0,0329945 | 21,98 | <0,0001 | *** |
| A12 | −0,697564 | 0,0586298 | −11,90 | <0,0001 | *** |
| A22 | 0,826149 | 0,0367572 | 22,48 | <0,0001 | *** |
| A23 | 0,523731 | 0,0364903 | 14,35 | <0,0001 | *** |
| A29 | −0,540034 | 0,0406279 | −13,29 | <0,0001 | *** |
| A33 | −0,344588 | 0,0378825 | −9,096 | <0,0001 | *** |
| A45 | 0,373790 | 0,0179599 | 20,81 | <0,0001 | *** |
| A52 | 0,275264 | 0,0286788 | 9,598 | <0,0001 | *** |
| A56 | 0,301072 | 0,0268938 | 11,19 | <0,0001 | *** |
| A57 | −0,925966 | 0,0786948 | −11,77 | <0,0001 | *** |
| A58 | 1,13344 | 0,0934029 | 12,14 | <0,0001 | *** |
| Appendix - V Statistics Based On Weighted Data |
||||
|---|---|---|---|---|
| The sum of four residual | 315,9739 | E.S. of the regression | 0,952875 | |
| R-quadro | 0,989990 | R-square corrected | 0,989674 | |
| F(11, 348) | 3128,863 | P-value(F) | 0,000000 | |
| Log-likelihood | −487,3379 | Akaike criterion | 998,6757 | |
| Schwarz criterion | 1045,309 | Hannan-Quinn | 1017,218 | |
| Appendix - VI Statistics Based On Original Data |
||||
| Average var. employee | 124,3720 | SQM var. dipendente | 121,6720 | |
| The sum of four residual | 180071,1 | E.S. della regressione | 22,74743 | |
References
Aman, V. (2018). A new bibliometric approach to measure knowledge transfer of internationally mobile scientists.Scientometrics,117(1), 227-247.
Belli, S., & Baltà, J. (2019). Stocktaking scientific publication on bi-regional collaboration between europe 28 and latin america and the caribbean.Scientometrics,121(3), 1447-1480.
Indexed at, Google Scholar, Cross Ref
Chen, Y., Ding, C., Hu, J., Chen, R., Hui, P., & Fu, X. (2017). Building and analyzing a global co-authorship network using Google Scholar data. InProceedings of the 26th international conference on World Wide Web Companion, 1219-1224.
Indexed at, Google Scholar, Cross Ref
Costantiello, A., Laureti, L., & Leogrande, A. (2021). The intellectual assets in europe.Available at SSRN 3956755.
De Moya-Anegon, F., Guerrero-Bote, V.P., López-Illescas, C., & Moed, H.F. (2018). Statistical relationships between corresponding authorship, international co-authorship and citation impact of national research systems.Journal of informetrics,12(4), 1251-1262.
Indexed at, Google Scholar, Cross Ref
Dimov, R., Ozdemir, E., Gedikoglu, I., & Sidar, K. (2020). Eu’s open science: an impetus for turkey’s innovation potential.European Journal of Science and Technology, (18), 762-766.
Higaki, A., Uetani, T., Ikeda, S., & Yamaguchi, O. (2020). Co-authorship network analysis in cardiovascular research utilizing machine learning (2009–2019).International Journal of Medical Informatics,143, 104274.
Hu, Z., Lin, A., & Willett, P. (2019). Identification of research communities in cited and uncited publications using a co-authorship network.Scientometrics,118(1), 1-19.
Jeck, T., & Baláž, V. (2020). Geographies of tacit knowledge transfer: Evidence from the European co-authorship network.Moravian Geographical Reports,28(2), 98-111.
Kılıc, M., Uyar, A., & Koseoglu, M.A. (2019). Co‐authorship network analysis in the accounting discipline.Australian Accounting Review,29(1), 235-251.
Laureti, L., Costantiello, A., & Leogrande, A. (2020). The Finance-Innovation Nexus in Europe.IJISET-International Journal of Innovative Science, Engineering & Technology,7(12).
Lee, J.J., & Haupt, J.P. (2020). International Research Collaborations on COVID-19 Amidst Geopolitical Tensions with China.
Leogrande, A., & Costantiello, A. (2021). Human resources in europe. Estimation, clusterization, machine learning and predictionmachine learning and prediction. American Journal of Humanities and Social Sciences Research.
Leogrande, A., Massaro, A., & Galiano, A. M. (2020). The attractiveness of European research systems.American Journal of Humanities and Social Sciences Research (AJHSSR),4(10), 72-101.
Lokhtina, I., Lofstrom, E., Cornér, S., & Castello, M. (2022). In pursuit of sustainable co-authorship practices in doctoral supervision: Addressing the challenges of writing, authorial identity and integrity.Innovations in Education and Teaching International,59(1), 82-92.
Makkonen, T., & Mitze, T. (2021). Geo-political conflicts, economic sanctions and international knowledge flows.arXiv preprint arXiv:2112.00564.
Molontay, R., & Nagy, M. (2021). Twenty years of network science: A bibliographic and co-authorship network analysis. InBig data and social media analytics, 1-24.
Nadhiroh, I.M., Hardiyati, R., Amelia, M., & Handayani, T. (2018). Mathematics and statistics related studies in Indonesia using co-authorship network analysis.International Journal of Advances in Intelligent Informatics,4(2), 142-153.
Nazarovets, S.A. (2020). Quantitative analysis of the co-publications of Ukrainian researchers with the 1994—2018 nobel laureates in science.Science and Innovation,16(5), 103-110.
Shekofteh, M., Karimi, M., Kazerani, M., Zayeri, F., & Rahimi, F. (2017). Co-authorship patterns and networks in pharmacology and pharmacy in Iran.International Journal of Information Science and Management (IJISM),15(2).
Singh, C.K., & Jolad, S. (2019). Structure and evolution of Indian physics co-authorship networks.Scientometrics,118(2), 385-406.
Ullah, M., Shahid, A., Roman, M., Assam, M., Fayaz, M., Ghadi, Y., & Aljuaid, H. (2022). Analyzing interdisciplinary research using co-authorship networks.Complexity,2022.
Victor, B.G., Hodge, D.R., Perron, B.E., Vaughn, M.G., & Salas-Wright, C.P. (2017). The rise of co-authorship in social work scholarship: A longitudinal study of collaboration and article quality, 1989–2013.British Journal of Social Work,47(8), 2201-2216.
Zhang, C., & Guo, J. (2017). China’s international research collaboration: Evidence from a panel gravity model.Scientometrics,113(2), 1129-1139.
Received: 27-Oct-2022, Manuscript No. JEEER-22-12737; Editor assigned: 29-Oct-2022, PreQC No JEEER-22-12737(PQ); Reviewed: 13-Nov-2022, QC No. JEEER-22-12737; Revised: 26-Nov-2022, Manuscript No. JEEER-22-12737(R); Published: 04-Dec-2022