Research Article: 2022 Vol: 26 Issue: 2S
Investigating the Impact of the Leaders Emotional Intelligence on the Performance of the Subordinates In A Local Government Maintenance Department
L.E. Jowah, Cape Peninsula University of Technology
Y.I. Gwebityala, Cape Peninsula University of Technology
Citation Information: Jowah, L.E., & Gwebityala, Y.I. (2022). Investigating the impact of the leader’s emotional intellegence on the performance of the subordinates in a local government maintenance department. Academy of Marketing
Studies Journal, 26(1), 1-15.
Abstract
The maintenance department in a government department would inevitably be diverse in culture, education and technical skills. It is established that people in a particular discipline tend to have specific acceptable norms and practices that define their discipline in terms of the operations and tasks. The presence of these people together suggests a serious problem for leadership in that leadership style is task related and yet this environment has diverse. On the other hand, emotional intelligence is the ability of the individual to be aware of themselves, the others and the cultural or organisational environment. The research sought to identify the appropriateness of emotional intelligence considering the diversity and therefore deciding on what leadership style would most suit this unique work environment. The researchers made use of a mixed research methodology with the aid of a structured questionnaire to collect the necessary data. After the necessary preparation the data was captured onto an excel spreadsheet and illustrations were constructed which enabled easy comparison of the variables understudy. The findings indicated that workers or employees in general have specific expectations which should be met if they have to feel satisfied enough to perform. Relationships feature as critical aspects of effective leadership, but the leader is expected to behave differently to different workers at different times. The emphasis appears to be on contingency suggesting that an emotionally intelligent leader responds and behaves appropriately to specific situations.
Introduction
There is a known relationship between the types of leader-power in comparison to the follower-power suggesting they influence each other. The follower power may be informed by many factors among whom will be the expert power that may reside in both leader and follower, creating a new leader-follower dynamic. Where the leader has exclusive power, they may not feel pressurised to change their behaviour to make the subordinate to perform, allowing for any form of behaviour as they see fit. On the other hand, employees are impacted on by leader behaviour in many ways including the possibility of the leader resorting to legitimate power, coercive power and other forms. An employee with a technical skill in high demand in the market may be treated differently for fear of losing the skill which may be difficult to replace. Yet on the other hand a general skill or a semi-skilled individual may not be treated as indispensable and the leader behaviour make indicate thus. All in all, if employees at different levels, including the semi-skilled, are expected to perform, there must be a trade-off in the way they are treated. Jowah (2012) suggests the need for “congruency” between employee objectives, leader behavioural patterns and the organisational objectives. This suggests that every individual subordinate must feel that they are considered positively which should motivate them to do their best at their level. This is skilled, semi-skilled or unskilled; each one needs to be met at their point of need if they will pull their weight. Emotional intelligence (EQ) is thought of as the ability to be aware of oneself, others and the environment; hence this study seeks to establish how this EQ can be best fitted for a complex workplace like a maintenance workshop.
Background
Semi-skilled employees fall into a different category depending on the type of skill and possibly the demand for the skill in the economy. A semi-skilled would be an individual who in a sense is in the process of getting the skill, too often through the long process of having worked in an environment over a period, sometimes under the supervision of a skilled worker ( Reitz, 2019). The first problem being that, for individuals to be skilled workers, there is generally a minimum education (matric/high school pass or even a degree). Such people therefore go through a deliberate structured program to get them to an expected level with evaluable outcomes (pre-determined standard) for them to have the qualification ( Marchesini & Celentano, 2021). The skill is therefore used as a measure of the expertise an individual has in a specific discipline (Burke, 2007), this is turn makes the leader and the peers allow the individual a degree of freedom to perform their duties with minimum supervisions. For this reason, skilled people would be generally fewer in number, thus in demand to an extent, dependent on the type of trade and remuneration. Skilling of an individual is done in a specific trade, it results in division of labour, suggesting that the leader may not necessarily come from the same discipline. Consequently, the skilled personnel help complement the leader’s effectiveness in the task performance, this inevitably leads to a mutual leader-follower-dependency situation. Winter suggests that leadership styles depend on the understanding and maturity of the subordinates, less qualified subordinates will need more micro-management.
A skill is a learnt ability by an individual where there are predetermined results within specified time, energy, resources or all of them (Ryu, 2017). Skills are divisible into two broad aspects, namely, domain-general, and domain-specific skills.
- Domain-general would include largely skills that may also be classified as soft skills; chief among them may be team leadership, interpersonal relationships Atwater & Yammarinol (1993), time management and or analytical skills.
- Domain specific – commonly referred to as hard skills, mostly though not exclusively; technical skills, mechanical skills, carpentry skills, plumbing skills, electrical repairs, and other forms of maintenance related hard skills.
Richards & Barry (2010); Robles (2016) posits that there was a time when skills referred strictly to hard skills, and only people with hard skills were promoted in an organisation. Increasingly, there is a realisation that skills are divisible into two, namely; hard skills (technical skills) and soft skills (people relationship skills). Other classifications have widened the types by sub-dividing the skills further; a Table 1 is constructed below to illustrate some of the skills classifications in literature today.
|
Table 1 |
||
|---|---|---|
|
Hard skills |
Labor skills |
Life skills |
|
People skills |
Social skills |
Soft skills |
|
Hierarchy of Skills |
Cognitive skills |
Negotiation skills |
Source: Own construction.
It is important however to explain these as they are, and as they pertain to the operations in the business and organisational arena.
- Hard skills; easily quantifiable and measurable / evaluatable with comparative easy since they are specific. These are transferable skills, and one can therefore be taught the skill overtime and produce the measurable / quantifiable results.
- People skills; the ability for an individual (or individuals) to understand oneself or ourselves and combined with the ability to moderate our responses to build relationships of trust, respect and amicable and productive associations. These involve both psychological and social skills and are less involving and less inclusive than the life skills.
- Hierarchy skills; skills of working oneself to the top in an organisational structure too often based on the skills and expertise, given the environment. Generally only 2% of the personnel in an organisation manage to get to the highest levels.
- Labour skills; skilled workers have long historical import as electricians, masons, carpenters, blacksmiths, bakers, brewers, coopers, printers and other occupations that are economically productive.
- Social skills; any skill facilitating interaction and communication with others where social rules and relations are created, communicated, and changed in verbal and nonverbal ways – socialisation.
- Cognitive skills; ability to process and perform the various mental functions as related to learning of situations and solving of problems. These are characterised by the verbal, spatial, psychomotor, and processing-speed ability. This includes ability to learn, memory, speech, reading, understanding and interpretation.
- Life skills; ability and deliberate self-capacitation acquired through systematic, coordinated and consistent effort to adapt to certain otherwise would be complex activities or operations. Combining cognitive, technical and interpersonal skills.
- Soft skills; use of multi-skills involving interpersonal skills, character traits, attitudes and perceptions, communication and negotiation skills, and career attributes enveloped in both emotional and intelligence quotient among others.
- Negotiation skills; the ability to analytically structure negotiations and make up a strategy to process view points and integrate these to a point or position acceptable by the different factions - used where there is conflict amongst belligerents.
It is expected that the difference the skills and maturity levels of subordinates will also impact on the type of management. Managers have objectives to be met, and they are accountable to senior management for the operations under their control ( Petrides and Furnham, 2001). It is expected therefore that the manager will set out and plan on implementing and working towards attainment of the objectives. Inevitably, the manager depends on his subordinates, who themselves will be at different levels of skilling depending on the tasks. Matilu and K’Obonyo, (2018:44-59) observed a direct relationship between the complexity of the task and the level of the skill needed to operate. The skilled levels of heads of the units will be the manager’s greatest concern until satisfied otherwise that the individual is able. This can only be verified on the basis of known qualifications (skills) or previous experience in the operation, by the subordinate, on this task. Heyns and Kerr, (2018.:1-10) suggest that emotional skills are best needed when there is the need to manage diverse people.
Emotional Skills
Balwi, et al. (2018) noted that in the military, personal attributes and level of operation determined how the leader relates to subordinates Burton (2002). Expectations were that the senior in the army had to be obeyed and the feelings of subordinates were to be subdued. EQ is viewed as a different way of being smart by being intelligent about one’s emotions in relation to managing other people ( Penceliah 2006); Goleman & Boyatzis, (2017); Hayward et al. (2008); Herbst et al. (2006) introduced the concept of EQ, and though there was opposition, the concept has continued to grow. Salovey, et al. (2004); Ryu (2017) defined EQ as the ability of an individual to differentiate between different feelings that people experience. This involves putting oneself in the position of the other people and the environment in the process of deciding on a solution to a problem. Cavazotte, et al. (2012); Davidson (2002) recognised a relationship between the leader’s intellect (IQ), emotional intelligence (EQ) and how they resort to the use of transformational leadership or not. The personality of an individual can therefore be traced to their behaviour and their level of emotional intelligence. Emotional intelligence has to do with being in harmonious co-existence with people by connecting and understanding their emotions. Druskat & Druskat suggest that there is a need for the manager to possess high levels of EQ, this is complemented by Serrat (2009) who described EQ as an ability, capacity, skill or self-perceived-ability to identify, access and manage the emotions of one’s self, of others, and of groups. There are five domains of EQ which a illustrated in Table 2 below.
| Table 2 The Five (5) Eq Domains |
|
|---|---|
| SELF | OTHER |
| PERSONAL COMPETENCIES | SOCIAL COMPETENCIES |
| Self-awareness | Social awareness |
| Deep understanding of one’s emotions | Having empathy with the others |
| Understanding of one’s weaknesses | Experiencing the other person’s emotions |
| Understanding one’s values and motives | Understanding value of social networks |
| Understanding of one’s strengths | Comprehension of use of office politics |
| Self-management | Relationship-management |
| Ability to redirect our internal state | Managing other people’s emotions |
| Ability to control the internal impulses | Ability to influence and inspire |
| Ability to show honesty and integrity | Development of other people’s potential |
| Ability to adjust to changing situations | Conflict resolution - building relationships |
Source: Serrat (2009).
These dimensions form a hierarchy with self-awareness being the lowest level of emotional intelligence, relationship management has the highest level of EI (Daus & Ashkanasy, 2005:453-466).Basically the model pronounces EQ as enabling the leader to accurately understand emotions in both oneself and the others. The ability to discern and understand these emotions aids the leader to think and interpret other people’s meanings through their expressed emotions. This will entail the use of emotional knowledge by labelling emotions and drawing relationships and recognizing transitions between emotions from one state to another.
X And Y Theories Leadership styles
Research from a motivational perspective is limited, particularly regarding McGregor's Theory X and Theory Y leadership styles. McGregor, cited by Gannon & Boguszak (2013:88) stated that the conditions imposed by conventional organization theory and the scientific management theory for the past 100 years have tied men to restricted jobs. If semi-skilling is a result of people not having formal training to enable them to move up in the skills ladder, it is only logical to accept that semi-skilled people have job related stress. McGregor’s assumptions are the basis of Theory X and Theory Y (Aydin, 2012) and these assumptions sought to provide a better understanding of human factors and their impact on organisational performance. These are illustrated in the Figure 1 below.

Figure 1: Summery Of Mcgregor Type X And Type Y Theory.
Source: Adapted from Stewart (2010:1), Aydin (2012:25) and Gannon & Boguszak (2013:86).
Using the assumptions of the X theory, the understanding is that employees are lazy, hate work, want to be led all the time, cannot be trusted, must be coerced to work, and they should be told what to do always. These managers refuse employees control over their work environment, they use authority and are generally harshy with these subordinates (Stewart, 2010:1). This pre-supposes that these employees have no ambition, and this may explain why they are not fully skilled, too many times after long periods. Gannon & Boguszak (2013:86) observed that the way managers perceive their employees, informs the way they approach management of the employees. If employees are viewed as lazy, they may act lazy and will require close management and direction. Aydin (2012:25) says that controls are hopeless methods of motivating employees with satisfied physiological and safety needs. Such employees will have reasonably high sense of self-importance with strong self-fulfilling needs. Kayode (2013:1) observed that many managers tend towards theory X, and generally get poor results. It is worth noting that this gap is the difference between treating people as children and treating them as mature adults (McGregor, as cited by Gannon and Boguszak, 2013:86). A leader with high EQ would have empathy for the subordinate and put in place programs to enable these people to express their feelings and be understood. The average employee, regardless of whether they are intrinsically or extrinsically motivated, will comply with programs that uplift them in their work space (Gill, et al., 2010). The researchers advocate that empowerment as a strategy promotes flexibility and provides more control by employees thus reducing job stress. They attributed the use of transformational leadership style as an indication of emotional maturity, and of the presence of emotional intelligence. Bass as cited by Pillay et al. (2013) suggests that transformational leaders achieve higher levels of success in the workplace because they relate to and focus on people more than the tasks.
Problem Statement
Managers know that an increase in workers performance leads to organisational and individual growth. The local government environment is no different, it is important to try and understand what triggers certain employees to perform better than others. This develops anxiety around whether performance is linked to leader style or other factors that may be necessary to motivate for performance. Research has established that there is a relationship between the type of task to be perfomed and the form of leadership needed in that context. At the same time emotional intelligence has been thought of as being the ability to be aware of all social factors with the environment and responding accordingly. There is therefore a need to know how EQ will help in the management of a large maintenance department characterised by diversity of tasks and skills under the same management.
Research Objective
This is primarily the researcher’s expectation from conducting the survey, and in this survey, the researchers wanted to;
- To establish the role and impact of EQ in effectively managing a multi-tasked and multi-skilled workforce in government maintenance department.
Research Questions
- How does EQ assist in the effective management of multi-tasked and multi-skilled workforce in a local government department?
Research Methodology
A mixture of both quantitative and qualitative was used because of the nature of the target population and the intended objectives. This was done with the use of a three section semi-structured questionnaire (Section A – Biography, Section B – Likert scale and Section C – Open ended questions)
Target Population
Local government maintenance department employees in the workshop nvolved in different forms of tasks. This was restricted or limited to the Local Government at a maintenance department in a coastal city in the Western Cape. These subordinates are directly involved in the day-to-day maintenance activities of the municipality units projects.
Sampling, Data Collection Method and Data Analysis
Systematic random sampling was used on the 1000 employees with every 5th person being selected for the survey. A total of 200 respondents had questionnaires directly administered to them by 3 trained research assistants. The collected data was are cleaned, edited, coded and captured on to an excel spreadsheet from which illustrations were drawn.
Findings
The illustrations were used to compare the variables, these are reported systematically in the section below. The researcher used the questionnaire format, item by item to provide the details of the findings starting from the biography, Likert scale and the open ended questions.
Section A Biography
Do us a decent table here or convert to charts / histogram, round up your percentages there are no ½ persons. The demographic characteristics of the sample group are summarised in the table below. It was found that the majority of the subordinates were General workers (46.7%), had between 0-10 years of experience (58.8%) and did not finish matric (52.9%).
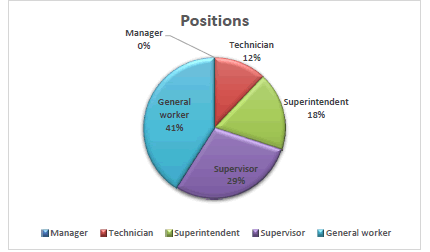
Positions: the participants show that was a 0% of managers, 11.8% of the technician, 17.6 % of the superintendent, 29.4% of the supervisors and 46.7% were the general workers.
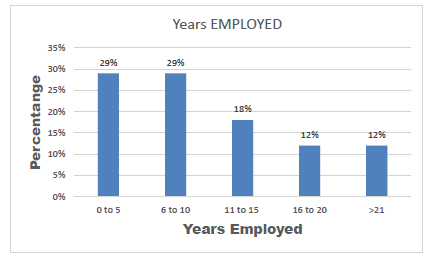
Years of employment: 0-5 were 29%, from 6-10 years were also 29% then the 11-15 years were 18% to add to that 16-20 years were 12% and lastly the +21years was 12%.
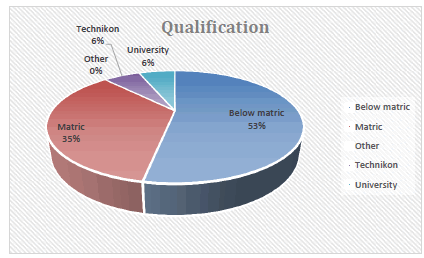
Qualification: there were no other qualification, Technikon and University were on 6% in both then matric was 35% and lastly those who never reach matric were on 53%.
Qualification: there were no other qualification, Technikon and University were on 6% in both then matric was 35% and lastly those who never reach matric were on 53%.
The sample group completed section B of the questionnaire (Likert scale) and from it the following results were obtained from the leadership and EQ section Table 3.
| Table 3 Leadership And Eq Section Results |
||||||
|---|---|---|---|---|---|---|
| LEADERSHIP & EQ | Strongly disagreed | Disagreed | Neutral | Agree | Strongly agree | |
| 1 | Leaders are laid back | 0% | 53% | 12% | 35% | 0% |
| 2 | Leaders only act when there is problems | 0% | 64% | 12% | 24% | 0% |
| 3 | Leaders are always right | 12% | 29% | 24% | 35% | 0% |
| 4 | Leaders know best | 12% | 24% | 24% | 28% | 12% |
| 5 | Leaders know what they are supposed to know | 0% | 0% | 24% | 64% | 12% |
| 6 | Leaders take responsibility for the team | 0% | 12% | 12% | 64% | 12% |
| 7 | Leaders listen to team members | 0% | 0% | 24% | 64% | 12% |
| 8 | Leaders care about team members feelings | 0% | 24% | 38% | 38% | 0% |
| 9 | Leaders care only about the work | 12% | 41% | 0% | 35% | 12% |
| 10 | Leaders defend team members | 0% | 12% | 12% | 76% | 0% |
The table show that there is 0% of strongly disagree and strongly agree on the question, there is 53% respondents were disagreed with the question, there was 12% who were neutral on the question and only 35% of them agree with the question.
Conclusion: the results shows that leaders are not laid back they are doing what leaders do.
Statement 5: Leaders only act when there is problem.
According to the presented table show that there is a 0% of strongly agree and disagree on the question, 12% were neutral on the question, 24% were agree that leaders only act when there is a problem and 64% disagree with the statement that was said. Conclusion: The numbers shows that there is no truth that the leaders only act once there is a problem. It shows that leaders act even where there is no problem.
Statement 6: leaders are always right.
The table shows that there about 12% on the strongly disagree then about 29% disagree on this then there was about 24% that were neutral where there was about 35% on the agreement then 0% on the strongly agree. Conclusion: the results shows that there was a bit advantage on the agreement shows that leaders are always right whereas there is 29% disagree and most of the numbers were setting on the neutral side. So, it can be said that the leaders are always right but slightly.
Statement 7: leaders know best.
There was about 12% strongly disagree and strongly agree, there was 24% disagree and neutral, then there was 28% agree on the statement. Conclusion: there is a slightly advantage that shows the leaders knows best.
Statement 8: leaders know what they are supposed to know.
The results shows that there was about 0% on disagree and strongly disagree then there was about 24% were on neutral then 64% were on agree then 12% were on strongly agree. Conclusion: The results show most of the times leaders know what hey are supposed to know.
Statement 9: leaders take responsibility for the team.
The table showed that 0% of the strongly disagree then shows that the 12% of disagree and neutral then it shows that there is about 64% were on agree then about 12% was about strongly disagree. Conclusion: The results shows that leaders are taking responsibility for the team there is a highly agree on this statement.
Statement 10: Leaders Listen to Team Members
There is about 0% on the disagree and strongly disagree then there was only about 24% on neutral and there was on 64% on agree and 12% on strongly agree. Conclusion: the leaders do listen to team members in most of the time.
Statement 11: leaders care about team members feelings
The table shows that 0% of the time was for strongly disagree, then 24% of the disagree on the statement and on that noted that there was 38% shows neutral and agree on the statement and only 0% shows that strongly agree. Conclusion: the majority were in between the neutral and on agree side that leaders do care about team members feelings.
Statement 12: leaders care only about the work.
The table shows that there was about 12% of the strongly disagree then there was about 41% that disagree with the statement and then there was a 0% on neutral. On other side showed that there was 35% on the agree side and 12% on the strongly agree. Conclusion: There is a high disagreement that leaders only care about the work nothing else that is not true.
Statement 13: leaders defend team members.
There was about 0% for both strongly disagree and strongly agree then there was about 12% disagree and neutral and about 76% of the agree on the statement. Conclusion: this shows that the leader does show leadership and defend his/her team members.
The following results were obtained from the sample group of the performance section of the questionnaire (Likert scale) Table 4.
| Table 4 Performance Section Of The Questionnaire (Likert Scale) |
||||||
|---|---|---|---|---|---|---|
| PERFORMANCE | Strongly disagree | Disagreed | Neutral | Agree | Strongly agree | |
| 1 | I perform best on my own | 12% | 24% | 0% | 52% | 12% |
| 2 | I perform best when I am being watched | 12% | 64% | 0% | 24% | 0% |
| 3 | I perform best when I get recognition | 0% | 35% | 0% | 53% | 12% |
| 4 | I feel my performance cannot get better | 12% | 76% | 0% | 12% | 0% |
| 5 | I perform best when I am motivated | 0% | 0% | 0% | 65% | 35% |
| 6 | I perform best in a motivated team | 0% | 0% | 12% | 53% | 35% |
| 7 | I perform best when I have a relationship with my leader | 0% | 12% | 12% | 76% | 0% |
| 8 | I perform best when I can discuss my feelings | 0% | 12% | 24% | 52% | 12% |
| 9 | I perform best when I disregard my feeling | 0% | 41% | 35% | 24% | 0% |
| 10 | I perform best when I have a good leader | 0% | 12% | 24% | 29% | 35% |
Statement 14: I Perform best on My own
The results show this way there was about 12% of the strongly disagree then it showed about 24% of the disagree and about 0% on neutral then was about 52% was for agree and 12% of the strongly agree. Conclusion: the results proved that the best performance happens when one is not supervised.
Statement 15: I Perform best when I am being Watched.
The Table shows the 12% of strongly disagree, then about 64% of disagree, then it shows that 24% agree with the statement and 0% that were neutral and strongly disagree. Conclusion: The performance is not well presented when there are being micromanaged so the performance decrease.
Statement 16: I perform best when I get recognition.
There was a zero percent on strongly disagree and neutral, then there was about 35% on the disagree whereas on the other side there was about 53% agree then 12% strongly agree. Conclusion: the results showed they performed best when their work was being recognised by those who are in charged.
Statement 17: I feel my performance cannot get better.
There was about 12% of the strongly disagree then there was about 76% of them disagree, there was a 0% on them that were neutral and on strongly agree and only about 12% on the agree side. Conclusion: the numbers showed that there is no way that the performance cannot get better so their disagree with the statement.
Statement 18: I Perform Best when I am Motivated
The table showed that there was about 0% for strongly disagree, disagree and neutral and there was about 65% on agree and 35% of agree on the statement. Conclusion: the performance was at best when one is motived.
Statement 19: I Perform best in a Motivated Team
The results showed that on the strongly disagree and disagree there was a 0% in both, there was only 12% on the neutral side, then there was about 53% agree and about 35% of strongly agree. Conclusion: this shows that the respondents agree that they perform best when their were in a motivated team.
Statement 20: I Perform Best When I have a Relationship with my Leader
There was about 0% on strongly disagree then there was 12% of disagree, there was only 12% neural then there was about 76% that had agreed on the statement then only 0% was on the strongly agree. Conclusion: The respondents agree that they perform very well when there is a relationship with the leader.
Statement 21: I perform best when I can discuss my feelings
There was about 0% on the strongly disagree, where there was 12% of the response disagree, whereas there was about 24% were neutral about the statement, on the strongly agree and agree there was about 52% and12% respectively. Conclusion: The results that people perform better when they discuss their feelings cause they no longer holding anything, mostly agree.
Statement 22: I perform best when I disregard my feeling
The Table shows that there is zero percent on strongly disagree about the statement whereas there is about 41 percent disagree on the statement, there about 35 percent that were neutral on it. On the other side there is only 24 percent agree and zero percent strongly agree. Conclusion: the results shows that little bit on swing on the disagree side about 41percent the other 35 percent are neutral about the statement and only 24 percent agree this shows mixed emotion about the statement.
Statement 23: I perform best when I have a good leader
The statistics show that there is 0% on strongly disagree, it shows that 12% on disagree there is about 24% that were neutral about the statement, it shows about 29% agree to the statement and 35% is for strongly agree. Conclusion: the numbers shows that there about 64% agree with the statement whether it is strongly agreed and agree that there is a best performance when one has a good leader. From the open-ended questions, section C of the questionnaire, the most common responses regarding the subordinates’ feelings was the need for more training and better equipment in order to improve their performance. They viewed their leader as competent stating that he communicated well with them. They also said they had no objections to the way he leads them.
Conclusion
The aim of this research was to establish whether there is a relationship between employee performance, leadership and emotional intelligence. From the research it is clear that the respondents believe that there is a link between their performance and the relationship and motivation that they get from their leader (EQ). It is also evident that they believe their leaders defend, listen to and take responsibility for the team; these are clear characteristics of transformational leadership. On the other hand there is a need for power for a leader to be able to influence the behaviour of the employees to operate positively. There is also an indication that expert power, emanating from the leader’s knowledge of the tasks, which is intellectual (IQ) is a strong requirement. The combination of IQ and EQ in one leader may be the most appropriate and most effective way to manage effectively. It can be concluded that EQ is about the ability of a leader to be aware of other that impact on employee performance. This therefore suggests that the leader must to know when to be transformational or transactional to be relevant to the situation. This agrees with the contingency theory of leadership in the main.
References
Atwater, L., & Yammarinol, F. (1993). "Personal attributes as predictors of superiors' and subordinates' perceptions of military academy leadership". Human Relations 46(5): 645–668.
Balwi, M.A.W.F.M., Sarif, S., & Lubis, A. (2018). Authority delegation in organization: lessons from 7th century–early Islamic era.Journal of Al-Tamaddun,13(1), 1-11.
Burton, L. (2002) Developing Leadership in South Africa. Journal of the South African Institute of People Management.
Davidson, F. (2002). Leaders of the Future. Journal of the South African Institute of People Management.
Goleman, D., & Boyatzis, R. (2017). Emotional intelligence has 12 elements. Which do you need to work on.Harvard Business Review,84(2):1-5.
Reitz, C. (2019). The algorithm and painting semi-skilled: Notes for an exhibition.Journal of Contemporary Painting,5(1):177-194.
Ryu, C. (2017). Educational significance of soft skills and hard skills.The Journal of Korean Practical Arts Education,23(1), 1-17.
Salovey, P., Mayer, J., & Caruso, D. (2004), "Emotional Intelligence: Theory, Findings, and Implications", Psychological Inquiry, 197–215.