Research Article: 2018 Vol: 22 Issue: 3
Modelling Store Image in Retail Services
Dimple Kaul, KJ Somaiya Institute of Management Studies and Research
Abstract
This paper is an effort in understanding the antecedents of brand loyalty in retail. A structural questionnaire was used to collect data (n=840) from department store adult shoppers in India. Latest tools like Exploratory Factor Analysis and Confirmatory Factor Analysis were used to analyse data. Results of the research revealed that factors like merchandise, service interaction, corporate citizenship and convenience play an important role in building store image in retail. The implications for academicians and practitioners are discussed in the paper.
Keywords
Merchandise, Service Interaction, Store Image, Social Responsibility, Convenience, Retail, Services.
Introduction
The first department store in USA, still in operation as Brooks Brothers, originated in New York in April 1818 with the original name of H & D.H. Brooks & Co. It was popularly known as men’s clothier initially but later sold from anything to everything. In Europe too during the 19th and 20th century, shopping malls were gaining popularity and the emergence of the concept of “retail therapy”. Oxford Street in London became a popular place to shop, while the traders focussed on selling through marketplaces. Fairs were promoted and designed in order to raise funds and were usually held around Easter so that consumers could buy goods and services. These fairs quickly gained popularity and spread to the rest of the developed Western world. At the end of the 19th century, shops in marketplaces and streets grew in numbers across USA and Europe selling goods at fixed prices, delivering at homes and also accepting credit cards. Soon the retailers realised that as customers spent more time at the stores, it was more likely that they were to make purchases. In order to keep people engaged in stores for longer times, innovative methods, salesmen, courteous and friendly staff, convenient shopping facilities like washrooms, etc. and technology were used. The first modern escalator was installed at Harrods department stores in 1895, which created a new sensation in the retail space and also differentiated the store from others. This was particularly important in view of the fact that high production and sustained demand of goods and services were insufficient to insure the fast and continuous expansion of American economy in the mid of the 20th century and retailers played an important role in selling more and more goods than ever before. Department stores became the landmark of American urban life and elsewhere too. Hudson's employed around 12,000 employees and attracted more than 100,000 shoppers a day by the middle of the 20th century. Increased consumption of goods and services demanded the same level of efficiency in selling as it was in producing them and the whole process from manufacturing to distribution and consumption started to be spearheaded by advertising and high pressure selling. This in turn contributed to enhancements in store image and reputation through innovative displays, mannequins and attractive/elegant interiors. Frank Woolworth, the founder of F.W. Woolworth & Co. in USA introduced the concept of attracting customers through attractive window displays, window dressing and made store openings as big events and went on to coin the adage ‘retail is detail’.
He remained focussed on putting his stores on top of customer’s mind. This strategy led to an emphasis on attracting customers through consistent marketing efforts to enhance store image and loyalty across the United States and elsewhere.
The ‘big box player’ burst onto the scene in 1970s to the 90s, with club stores, value retailers and category killers flooding the retail sphere before the advent of multi-channel retailing and the Amazon era in the late 20th Century. Wal-Mart became America's retail giant in the late 20th century and it put sales staff under constant pressure to sell more and spend less in order to succeed in its Every Day Low Prices policy. Retailers realised that customers relied on their shopping experience and recall of their experience for future shopping decisions at the retailer and thus started to improve their merchandise quality, visual merchandising and services in order to build a unique and positive image about their stores. As competition was growing across the globe due to globalisation, enhanced communication tools, increased mobility and technological advancement, it became imperative that retailers build their own positive and strong image in the minds of the consumers and design marketing strategies around the same in order to improve long term sustainability and market share.
Store image is also an outcome in the process of positioning of the products and services in the minds of the consumer through simultaneous comparison with other brands. Therefore, research in this field shall facilitate in understanding and measuring a retailer’s image and enable marketers to design appropriate marketing strategies. The relationship between reputation (image) and competitive advantage is widely proven in literature (Fombrun and Shanley, 1990; Hall, 1993; Roberts and Dowling, 2002). According to Gibson, Gonzales & Castanon (2006), ‘reputation is arguably the single most valued organizational asset’.
The construct of store image and its formation has been studied mainly by relying on data collected post-shopping and also depending on customer recall. The purpose of this research is to identify the main factors crucial in the study of building store image and various dimensions soon after the visit has been made to the store. From the customers’ perspective a good image brings in a feeling of satisfaction, ease and simplification of choice and minimising risk of buying non-performing products/services (Cowles, 1994; Gremler and Brown, 1996) which may help in maintaining long-term relationship with a service provider in turn leading to benefits like personal recognition, friendship with the service provider and social support (Berry and Gresham, 1995; Goodwin and Verhage, 1989).
The benefit of understanding store image is that the brand managers can formulate strategies to enhance the strength of consumers’ positive attitude towards brands. Stores that attract a high proportion of loyal customers may benefit from higher returns per customer, increased share of wallet and from greater stability in their customer base. Also, customers with positive brand image are less susceptible to negative information. In view of the intense competition among various retail-shopping formats in India and elsewhere, retailers need to understand the antecedents that are influencing the store patronage in order to maintain their competitiveness. This is an empirical research in studying the antecedents of store image in lifestyle retail to understand how these can be enhanced in order to build store image as it is an extremely important outcome for retailers to maintain.
Theoretical Background And Hypotheses
This section describes in detail the research model and the various proposed hypothesis.
Store Image
According to Martineau (1958), store image is the way in which the store is defined in the shopper’s mind, partly by its functional qualities and partly by an aura of psychological attributes. Brand image is a mental setup developed by the customer on the basis of few selected impression from the particular branded product (Reynolds, 1965). The image which a customer forms of a retail store is based on the affective perceptions of cues, internal and external to the store, in addition to the actual physical qualities of the store (Mazursky and Jacoby, 1986). An empirical survey carried out by Chiang, Zhang & Zhou, (2006) on small and community discount stores identified three dimensions of store image namely accessibility (level of convenience), store reputation and shopping environment. Bersitain and Zorilla (2011) described store image dimensions as marketing image, strategic image and social image. Store image dimensions are vital for a retailer to identify and explain in order to draw more and more customers and to have competitive advantage with changing time. A positive store image has been identified as a key determinant of store choice (Doyle and Fenwick, 1974). According to Engel, Blackwell and Miniard (1990) “store image is a variable that consumers depend on in their choice of stores.”
Antecedents of Store Image and Loyalty
For customers the key contact point with a retail organisation is the store-it is through their experiences of the store and the interactions that take place within the store that customers build relationships and form their perceptions of a retailer. Research has shown that ‘the moment of truth,’ which occurs at the time when a customer interacts with a service provider like a retailer, can be a critical factor in determining customer satisfaction and subsequently loyalty. This can be used as an opportunity to build trust, reinforce quality and increase loyalty. Retailers must ensure that each service encounter is a positive one if customers are to develop a positive image of the services.
Lindquist (1974) gave a model of store image in which he described various (nine) attributes of store image like merchandise selection, quality, pricing, styling, fashion and assortment; retail service, convenience of location; physical facilities; clientele; store atmosphere; institutional factors; post-purchase satisfaction and employee service as important store image dimensions, wherein merchandise plays an important and role. The listing was further modified by Hansen and Deutscher (1975) and Zimmer and Golden (1988) wherein a distinction was made between tangible and intangible factors. Bearden (1977) suggested the following characteristics of store image as “price, quality of the merchandise, atmosphere, location, assortment, friendly personnel and parking facilities.” Store image is also treated as the result of a multi-attribute model (Marks, 1976; James, Durand & Dreves, 1976). Store image is expressed as a function of the salient attributes of a retail store and then the consumers weigh these attributes against each other to arrive at a final image. An empirical study carried out by Bloemer and Rutyer (1997) suggested that store image and satisfaction are important predictors of loyalty in a retail setting. Bloemer and Ruyter (1997) defined store image as: “The complex of a consumer’s perceptions of a store on different (salient) attributes.” Houston and Nevin (1981) had also given a similar definition of store image. Thang and Tan (2003) developed the ASOR model and studied that store image and store appearance affects consumer’s preference for retail stores. Consumers? preference is based on their post-visit ranking of the stores (Figure 1).
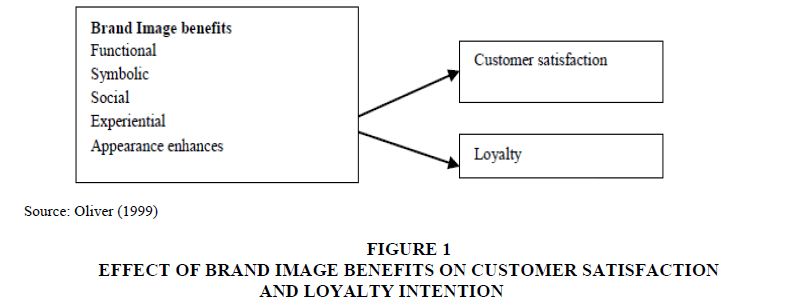
Figure 1: Effect Of Brand Image Benefits On Customer Satisfaction And Loyalty Intention
Jinfeng and Zhiling (2009) worked on the impact of selected store image dimensions and their effect on loyalty and retailer equity. The model they proposed is an extension on the retailer equity model given by Yoo & Chang, (2000). According to Jinfeng and Zhiling (2009), the various store dimensions such as convenience, institutional factors, physical facilities, perceived price and employee service affect brand equity by influencing brand loyalty first, which in turn is related to retailer awareness, retailer associations and retailer perceived quality (Figure 2).
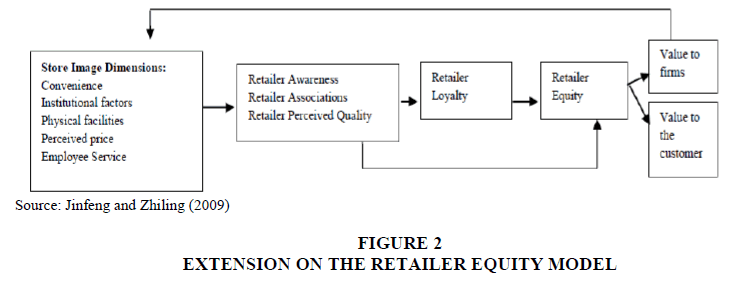
Figure 2: EXTENSION ON THE RETAILER EQUITY MODEL
quantitative research was carried out by Visser, Preez and Noordwyk (2006), on identifying store image attributes in apparel stores. They conceptualised store image with corporate personality, corporate identity and corporate image and emphasised that each company has its corporate personality which is projected to its stakeholders (Figure 3).
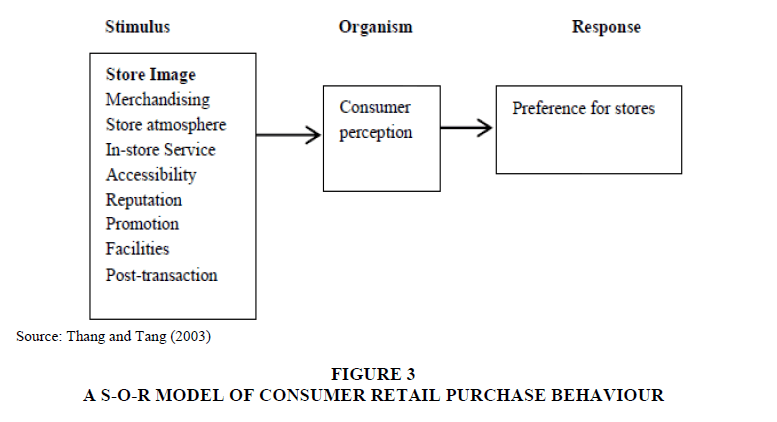
Figure 3: A S-O-R Model Of Consumer Retail Purchase Behaviour
The model can be shown as under:
The following Figure 4 reflects the image attributes from studies carried out in UK and Spain.
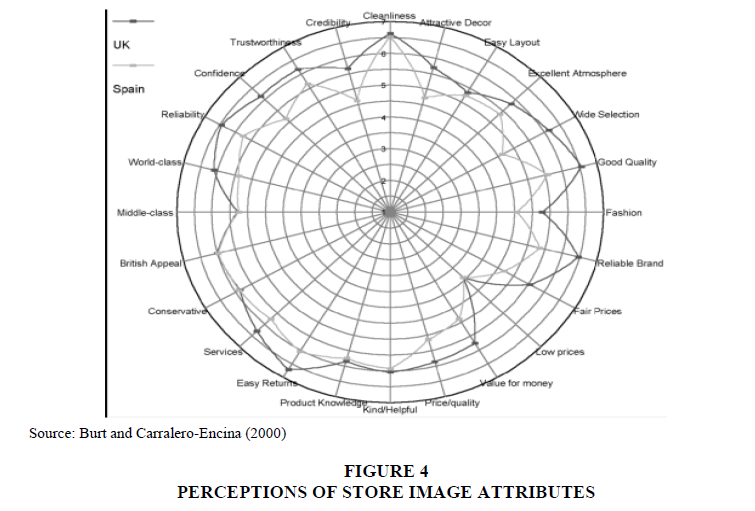
Figure 4: Perceptions Of Store Image Attributes
Estelami and Bergstein (2006) suggested that consumers form an overall image of a retail store through advertising, word-of-mouth and/or personal experience.
In one of the recent studies carried out by Ghosh (1990), store image is suggested to be composed of the various elements of the retail marketing mix such as merchandise, store location, price, store atmosphere, advertising, customer service, sales incentives and personal selling of which store merchandise emerged as the most important retail mix element. A retailer must ensure that the customer expectations are met so that they remain loyal to the store. In a study carried out by Soderlund (2006), store loyalty was indicated by positive (WOM) recommendation and repeat purchase behaviour.
Merchandise
The general definition of Merchandise used in retailing is “Goods and services to be bought”. Retailers are in constant quest for improving the quality of the products offered which is in line with the expectations of the customers. While this is good for the consumers, as they are getting better choice of products and many options to choose from, it poses some difficulties for the retailers as they have to continuously strive hard to maintain quality of merchandise that the customers want and at the same time keep pace with other competitors. From a customer’s point of view, some of the most widely researched elements of store merchandise are merchandise selection, quality, pricing, styling, fashion and assortment. It is quite challenging for a retailer to provide the right quality and variety of merchandise (number of different merchandize categories) that customers want at any given point of time.
Merchandise and Store Image
Jacoby and Mazurksy (1984) studied the relationship between the merchandise image and store image and found that store image could be improved if good branded merchandise was offered to customers. Visser, Preez and Noordwyk, (2006) carried out a research in apparel retailing and found that merchandise return policies, product selections, product sizes, were important factors affecting store image. Retailers try to satisfy customers’ needs by providing the right merchandise in the store at the right time by with respect to variety, depth and service levels (Mantrala, 2009).
Thus we can propose and test that
H1: Merchandise has a direct and positive effect on Store Image.
Convenience
Convenience is at the heart of retailing services and it is understood to be one of the fundamental roles of retailing. Consumers value their time, money and effort and since all the three are limited and finite, retailers must make every effort to make the retailing experience a memorable and convenient one. The two most cited aspects of convenience are ‘time’ and ‘effort saving’ (Anderson, 1971; Brown, 1990). According to a recent research done on retail convenience by Clulow and Reimers, (2009), there are 16 attributes which define a retail centre convenience namely parking availability, retail concentration, pedestrian areas, store compatibility, parking close to desired stores, proximity to home/work, number of traffic lanes, shopping services and facilities, extended trading hours, 1-stop shopping, types of traffic controls, public transport, speed limits, enclosure, centre size and store visibility.
Convenience and Store Image
Jim and Kim (2003) studied the importance of convenience in discount store patronage and found three types of conveniences namely facility convenience, service convenience and shopping convenience affecting discount store patronage. The study carried out by Chang and Polonsky (2012) advances the understanding of the role of convenience in service setting and also its interaction with the outcome of service like behaviour intentions.
Thus we can hypotheses that:
H2: Convenience has a direct and positive effect on Store Image.
Service Interaction
Mattson (1982) suggested that staff attention and interaction inside a retailer were important attributes of store image. Surprenant and Solomon (1987) suggested that interpersonal interactions that take place during service delivery often have the greatest effect on overall service quality. Research in the past has revealed that interactions have been identified as the employee-customer interface (Hartline and Ferrell, 1996). According to Comer, Drollinger and Warrington (1999) highly empathetic salespeople get more customer attention than less because empathy stimulates interaction. Hunt and Price (2002) described courteous behaviour of retail staff in terms of greetings, smiling at customers, polite behaviour, concern and thanksgiving for loyalty.
Service Interaction and Store Image
Mattson (1982) studied the importance of sales personnel attention in building a good store image. According to Rattanaphan and Mat (2012), image is the overall result of an interaction between people in an organisation on levels like feelings, beliefs, ideas and impressions.
After literature review we can hypotheses that:
H3: Service interaction has a direct and positive effect on Store Image.
Social Responsibility
CSR dates back to the early 1930s and since then the concept has evolved and developed with changing time, awareness and regulations. Carroll (1998) described four faces (aspects) of corporate citizenship as economic (be profitable), legal (obey the law), ethical (responsive to ethical duties and philanthropic (corporate contributions). According to Naylor (1999), social responsibility (corporate citizenship) is defined as the “obligation of managers to choose and act in ways that benefit both the interests of the organization and those of society as a whole”. Also described as ‘practices seen as good actions’ (Lavorata and Pontier, 2005). Tan and Komaran (2006) carried out research in Singapore to find out how CSR activities of companies are perceived by consumers and found that aspects like environmental friendliness, legal responsibility and ethical responsibility scored highly in the research outcome. Wall Mart, Body Shop, Marks and Spencer, Tesco and numerous other retailers are making an effort to be greener, fairer and more involved in “social” issues.
Social Responsibility and Store Image
Socially responsible behaviour can play an important role in brand commitment and purchase intention as shown by researchers like Brown and Dacin (1997); Lichtenstein (2004) and Mohr and Webb (2005). According to Wagner (2008), retailers frequently make an effort to demonstrate socially responsible behaviours to be perceived as good corporate citizens. Corporate social responsibility is a tool which is used by organisations to establish their corporate image (Rattanaphan and Mat, 2012).
To test whether corporate citizenship is an important antecedent of customer loyalty in retail, this research was carried out with the following hypothesis:
H4: Social responsibility has a direct and positive effect on Store Image.
The proposed model of antecedent variables building Store Image and leading to loyalty is shown as under (Figure 5):
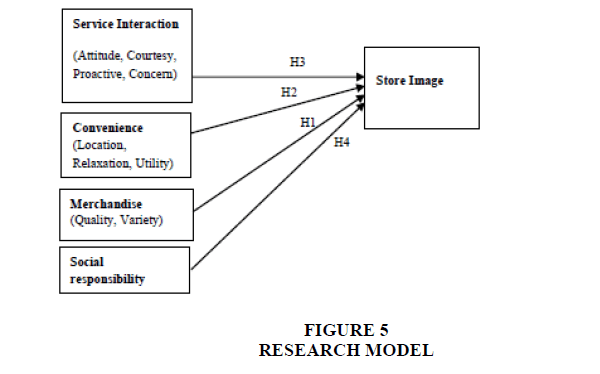
Figure 5: Research Model
Research Model
There are a number of studies in literature wherein the importance of various antecedent variables on customer loyalty have been established. Most of the studies show satisfaction as a mediating variable between some of the antecedent variables and customer loyalty. However, a limited research has been carried out to show how some of the factors like corporate citizenship, merchandise, image, service interaction and convenience affect customer loyalty directly. This research is an effort to further the body of knowledge which establishes a direct relationship between these variables and the end result customer loyalty. As a consequence of this research, it is established that these factors affect attitudinal loyalty and behavioural loyalty of customers. As depicted in Figure 3, we are proposing the following Hypothesis:
H1: Merchandise has a direct and positive effect on Store Image.
H2: Convenience has a direct and positive effect on Store Image.
H3: Service interaction has a direct and positive effect on Store Image.
H4: Corporate Citizenship has a direct and positive effect on Store Image.
H5: Store Image is mediating between its antecedent variables and Loyalty.
Methodology
Survey Instrument and Measurement
The Survey instrument used in data collection included measurement scale items adapted from various existing studies in the related field.
Individuals of the population sample used in this survey were intercepted at shopping malls who had purchased in retail stores such as Pantaloons, Lifestyle, Shoppers Stop and Westside.
Analysis
The analysis is carried out in three steps. The first step involves the confirmation of the factor structure of all the measurement items and to establish model reliability using various reliability tests. The second step is to establish the importance of each dimension in the proposed model. The last step in analysis is to establish the role each predictor variable play in influencing the outcome variables.
Validity and Reliability Check
Confirmatory Factor Analysis (CFA) proceeded by Exploratory Factor Analysis (EFA) was carried out in order to establish measurement reliability and model validity. The research instrument used in this study used modified validated measurement scales from previous studies and these scales were adapted to suit the lifestyle retailing context. These modifications in the measurement scales were based on interviews taken form the shoppers of lifestyle retailers for better suitability of scale. A 7 point Likert Scale (1-7) was used to rate all the items on the scale. The EFA was carried out using Principal Component Axis and Varimax Rotation. For a factor loading to be significant, it needs to have a value greater than 0.50 (Hair, 2009). To validate the structure statistically, first-order and second-order Confirmatory Factor Analysis (CFA) was performed. An exploratory factor analysis was conducted using Principal Component Analysis (PCA) and Varimax rotation. The Kaiser-Meyer-Olkin measure of sampling adequacy was 0.904 (exceeding the recommended value of 0.6.) demonstrating sampling adequacy. Hair, (1998) consider values above 0.50 appropriate. Likewise, the Bartlett’s Test of Sphericity is considered appropriate for factor analysis with any significant value (p<0.05).
Confirmatory Factor analysis (CFA) was conducted using AMOS 18 on each dimension of all constructs to ascertain whether the measurement items of each of the dimensions/constructs were appropriate to represent it.
To provide further evidence of construct validity, the degree to which the proposed measurement model fit the data was evaluated by global fit indices like NFI, CFI and RMSEA.
For the ratio of chi-square to the degrees of freedom researchers have recommended using ratios as low as 2 or as high as 5 to indicate a reasonable fit (Marsh and Hocevar, 1985). The other global fit indices also provide ample evidence of model fit. RMSEA values between 0.03 and 0.08 with 95% confidence are considered good (Hair, 2006). Other global fit indices like CFI values greater than 0.90 are considered to be good (Byrne, 2010), GFI generally accepted values of 0.90 or greater indicate well-fitting models (Hooper, 2008).
Service Interaction
Service interaction was a second order 17 items construct originating from Brady and Cronin Jr. (2001) and Lindquist (1974) scale and later adopted by Srivastava and Kaul (2014). The three dimensions of Service interaction namely Appearance (3 items) adopted from Lindquist (1974), Attitude (12 items) and Expertise (2 items) adopted from Brady and Cronin Jr. (2001) were used.
Service interaction emerged as a 14 items construct generating four uncorrelated or orthogonal first-order factors. The loading values of the items in their respective factors ranged from 0.505 to 0.788. A total of four factors that explain 64.50 percent of the total variability with an Eigen value greater than 1 were extracted and labelled as ‘Proactive’, ‘Attitude’, ‘Courtesy and ‘Concern’.
Convergent validity was assessed by computing the AVE scores for the proposed constructs (Fornell & Larcker, 1981). The AVE scores ranged from 0.34 to 0.60 which illustrated the presence of convergent validity among all the constructs of satisfaction. Discriminant validity was assessed and the shared variance between pairs of constructs was found to be lower than corresponding AVE, hence Discriminant validity is established. To provide further evidence of construct validity, the degree to which the proposed measurement model fit the data was evaluated by global fit indices like GFI, NFI, CFI and RMSEA.
Convenience
Convenience emerged as a 10 items construct was measured using 13 items adopted from Clulow and Reimers (2009), generating three uncorrelated or orthogonal first-order factors (location, relaxation and facility). The loading values of the items in their respective factors ranged from 0.514 to 0.844. A total of three factors that explain 63.99 percent of the total variability with an Eigen value greater than 1 was extracted and the labelled as ‘Relaxation’, ‘Location’ and ‘Utility’. Convergent validity was assessed by the AVE scores which ranged from 0.349 to 0.554 illustrating the presence of convergent validity among all the constructs of Convenience.
Store Image
Store Image was measured using 4 items mostly adopted from Beristain and Zorrilla (2011). Store Image emerged as 4 items construct. The loading values of the items in their respective factors ranged from 0.717 to 0.819. The AVE scores illustrated the presence of convergent validity among all the items of store image. The results do not support this measurement to be fit for 2nd order factor, hence this construct is emerging as a first order construct.
Social Responsibility
An initial listing of 3 items to measure social responsibility was compiled from literature, mostly from Beristain and Zorrilla (2011). Social responsibility emerged as 3 items construct generating and the loading values of the items ranged from 0.811 to 0.833. It emerged as a single factor that explained 70.348 percent of the total variability with an Eigen value greater than 1 was extracted. Convergent validity was assessed by computing the AVE scores for the proposed constructs (Fornell & Larcker, 1981).
Merchandise
Merchandise was measured using 8 items mostly adopted from Jin and Kim (2003) and Reddy and Azeem (2011). Merchandise emerged as 8 items construct generating two uncorrelated or orthogonal first-order factors (Quality and Variety). The loading values of the items in their respective factors ranged from 0.675 and 0.837. A total of two factors that explain 61.310 percent of the total variability with an Eigen value greater than 1 were extracted and the labelled as ‘Quality ’and ‘Variety’. The AVE scores ranged from 0.37 to 0.49 which illustrated the presence of convergent validity among all the constructs of satisfaction. Discriminant validity was assessed and the shared variance between pairs of constructs was found to be lower than corresponding.
Results
The measurement results (Table 1) indicate that all the variables like service interaction, merchandise, corporate citizenship, convenience and store image are relevant to the study and have measurable properties. The multidimensionality of some of the constructs used in the study like merchandise, convenience and service interaction is well supported in literature and also in the data collected. The emergence of second order constructs showed that the model developed and tested at the end of the study is a robust one and empirically tested (Table 2).
| Table 1 Global Fit Indices Of All The Constructs Can Be Summarised As Under |
||||||
| Construct | Chi-square | df | Chi-Sq/df | NFI | CFI | RMSEA |
| Merchandise | 96.737 | 19 | 5.0 | 0.968 | 0.958 | 0.07 |
| Social Responsibility | 40.20 | 9 | 4.46 | 0.852 | 0.840 | 0.39 |
| Store Image | 50.58 | 18 | 2.81 | 0.859 | 0.859 | 0.30 |
| Convenience | 151.65 | 32 | 4.74 | 0.944 | 0.955 | 0.067 |
| Service Interaction | 193.023 | 50 | 3.86 | 0.949 | 0.961 | 0.058 |
Table 2 Efa Results Of All The Constructs In The Model Can Be Summarised As Under |
|||
| Construct | Kaiser-Meyer-Olkin(KMO) | Cronbach alpha coefficient | Guttman Split-Half Coefficient |
| Service Interaction | 0.904 | 0.895 | 0.814 |
| Loyalty | 0.827 | 0.849 | 0.724 |
| Merchandise | 0.861 | 0.755 | 0.647 |
| Social Responsibility | 0.679 | 0.785 | 0.662 |
| Store Image | 0.696 | 0.775 | 0.670 |
| Convenience | 0.820 | 0.799 | 0.717 |
Structural Model and Hypothesis Testing
All the five hypotheses relationships in this study are estimated using Structural Equation Modelling (SEM). The structural model was estimated using AMOS18 with maximum likelihood estimation. The results show that the model fits the data well as shown in the results provided in Table 3 given under. The results indicate that all the predictor variables like merchandise, service interaction and corporate citizenship have a direct and positive effect on the outcome variable Store Image (Figure 6).
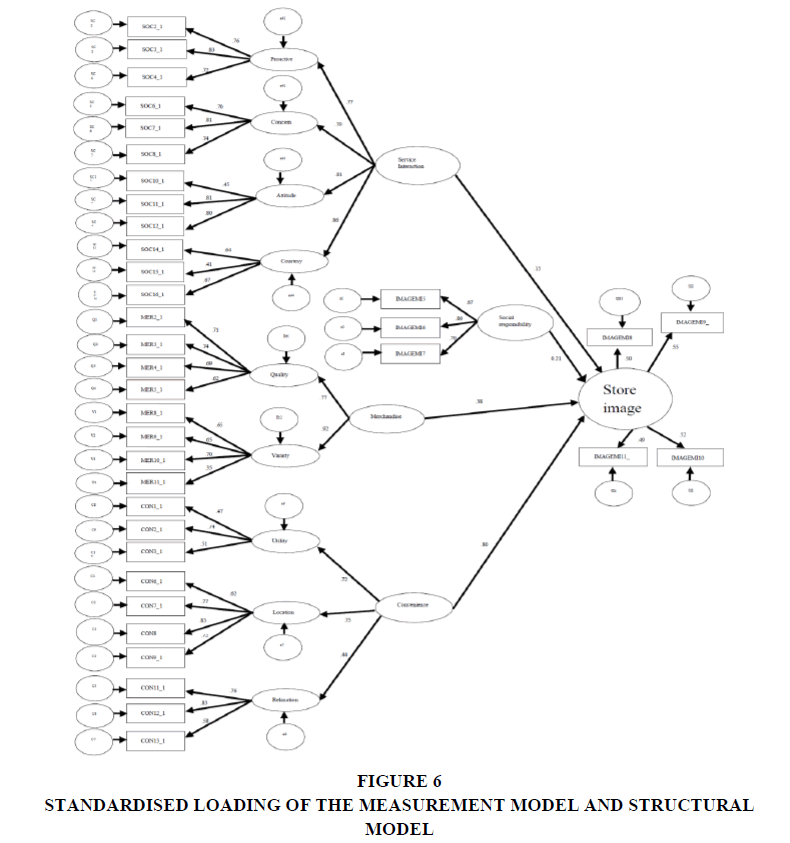
Figure 6: Standardised Loading Of The Measurement Model And Structural Model
| Table 3 Model Fit Indices Of Constructs |
|||||
| Chi-sq | df | Chi-sq/df | NFI | RMSEA | CFI |
| 3011.4 | 582 | 5.1 | 0.754 | 0.072 | 0.788 |
Discussion
It is clear from this research that variables like Service interaction, Convenience, Merchandise and Corporate citizenship are significant predictors of Store Image. This study is in line with the findings of many researchers. A positive store image has been identified as a key determinant of store choice (Doyle and Fenwick, 1974; Schiffman, Dash & Dillon, 1977; Burns, 1992). Vazquez-Carrasco and Foxall (2006) said that brand image has significant impact on customer repurchase intention. Service interaction which includes the interaction of customers with the staff has been studied as a predictor of building store image. Puccinelli (2009) established the importance of staff interaction.
Yavas (2003) also found convenient trading hours to be among the more salient influences on retail patronage. This means that having flexible working hours for customers could affect consumers’ choice of stores. Good locations have been instrumental in bringing success to retailers and also in having advantage over competitors. Also because location decisions are long term in nature and cannot be easily changed, it is important to understand how and to what extent it affects consumer decisions. This study is a step towards establishing convenience as an important predictor of store loyalty. Berry, Seiders & Grewal (2002) suggested that with the growing awareness among the customers they expect and demand convenience, respect and integrity during transactions (Tables 4-7).
| Table 4 Cfa Table Of The Final Model Showing Parameter Estimates, Critical Ratios, Average Variance Extracted And Construct Validity |
||||||
| Factor | Estimate | S.E. | C.R. | Eigen Value | AVE | Construct Validity |
| Quality | ||||||
| MER5_1 | 0.62 | |||||
| MER4_1 | 0.694 | 0.067 | 15.386 | |||
| MER3_1 | 0.749 | 0.072 | 16.11 | |||
| MER2_1 | 0.718 | 0.07 | 15.721 | 1.94 | 0.49 | 0.790 |
| Variety | ||||||
| MER11_1 | 0.35 | |||||
| MER10_1 | 0.705 | 0.11 | 8.699 | |||
| MER9_1 | 0.651 | 0.115 | 8.555 | |||
| MER8_1 | 0.65 | 0.1 | 8.551 | 1.47 | 0.37 | 0.687 |
| Social Responsibility | ||||||
| IMAGEMI5_1 | 0.67 | 0.064 | 16.791 | |||
| IMAGEMI6_1 | 0.885 | 0.077 | 16.505 | |||
| IMAGEMI7_1 | 0.688 | 1.71 | 0.57 | 0.795 | ||
| Store Image | ||||||
| IMAGEMI8_1 | 0.635 | 0.053 | 15.581 | |||
| IMAGEMI9_1 | 0.762 | 0.06 | 17.312 | |||
| IMAGEMI10_1 | 0.738 | |||||
| IMAGEMI11_1 | 0.592 | 0.054 | 14.673 | 1.88 | 0.47 | 0.778 |
| Location | ||||||
| CON6_1 | 0.628 | |||||
| CON7_1 | 0.775 | 0.064 | 17.502 | |||
| CON8_1 | 0.831 | 0.07 | 18.156 | |||
| CON9_1 | 0.728 | 0.065 | 16.784 | 2.22 | 0.55 | 0.831 |
| Relaxation | ||||||
| CON11_1 | 0.766 | |||||
| CON12_1 | 0.838 | 0.061 | 17.921 | |||
| CON13_1 | 0.587 | 0.051 | 15.334 | 1.63 | 0.54 | 0.778 |
| Utility | ||||||
| CON1_1 | 0.475 | |||||
| CON2_1 | 0.747 | 0.088 | 10.484 | |||
| CON3_1 | 0.512 | 0.082 | 9.457 | 1.05 | 0.35 | 0.606 |
| Proactive | ||||||
| SOC2_1 | 0.761 | 0.053 | 19.963 | |||
| SOC3_1 | 0.837 | 0.056 | 21.217 | |||
| SOC4_1 | 0.727 | 1.81 | 0.60 | 0.819 | ||
| Concern | ||||||
| SOC6_1 | 0.708 | |||||
| SOC7_1 | 0.813 | 0.05 | 19.753 | |||
| SOC8_1 | 0.742 | 0.051 | 18.653 | 1.71 | 0.57 | 0.799 |
| Attitude | ||||||
| SOC11_1 | 0.817 | |||||
| SOC12_1 | 0.805 | 0.048 | 21.165 | |||
| SOC10_1 | 0.453 | 0.049 | 12.302 | 1.52 | 0.51 | 0.744 |
| Courtesy | ||||||
| SOC14_1 | 0.641 | 0.06 | 14.088 | |||
| SOC15_1 | 0.411 | 0.087 | 9.848 | |||
| SOC16_1 | 0.674 | 1.03 | 0.34 | 0.602 | ||
|
|||||||||||||||||||||||||||||||||||||||||||||||||||||||||||||||||||||||||||||||||||||||||||||||||||
| Table 6 Items With Statements |
|
| Factor | Statements |
| Service Interaction | |
| Attitude | |
| SOC10_1: | The service staff did not spend much time in dealing with my issues |
| SOC11_1: | The service staff put a lot of effort into any issues or requests that I had |
| SOC12_1: | The staff are ready to find custom solutions |
| Courtesy | |
| SOC15_1: | Sales people do not make me feel as if they are doing me a favour |
| SOC14_1: | Are quick to investigate and correct billing error |
| SOC16_1 | Store staff greet me as soon as I walk in |
| Proactive | |
| SOC2_1 | The service staff/employees looked classy/elegant |
| SOC3_1 | Sales and service staff were attractive |
| SOC4_1 | Staff is Positive and proactive |
| Concern | |
| SOC6_1 | Willingly exchange merchandise or refund money if customer is dissatisfied |
| SOC7_1 | The store would be honest and sincere in addressing my concerns |
| SOC8_1 | The store would compensate me in some way for the problem with the product |
| Convenience | |
| Location | |
| CON6_1 | Public transport is easily available near the store |
| CON7_1 | The store has good visibility |
| CON8_1 | The store is easy to get to |
| CON9_1 | Easy to find my way around |
| Relaxation | |
| CON11_1 | Variety of places to eat |
| CON12_1 | Safe place for kids to play |
| CON13_1 | Places to rest |
| Utility | |
| CON1_1 | Rest rooms are kept neat and clean |
| CON2_1 | Floor and carpets leading to the store are kept neat and clean |
| CON3_1 | Can park close to the desired store |
| Store Image | |
| IMAGEMI8_1 | The retailer is very experienced and renowned |
| IMAGEMI9_1 | It respects and adapts to local culture and customs |
| IMAGEMI10_1 | The retailer has a future (growing and making alliances etc.) |
| IMAGEMI11_1 | It makes an effort to launch new products and services |
| Social Responsibility | |
| IMAGEMI5_1 | It makes a commitment to society( donations, social campaigns etc) |
| IMAGEMI6_1 | It behaves ethically and honestly |
| IMAGEMI7_1 | It is concerned with the health and well-being of consumers (healthy environment) |
| Merchandise | |
| Quality | |
| Mer2_1 | Has a wide selection of Merchandise |
| Mer3_1 | Merchandise is of high quality |
| Mer4_1 | Merchandise is up-to date |
| Mer5_1 | Has a good supply of branded merchandise |
| Variety | |
| Mer8_1 | Has a wide selection of attractive items |
| Mer9_1 | Has a good supply of own brands |
| Mer10_1 | Has a lot of variety under each category of merchandise |
| Mer11_1 | Has a good depth of merchandise |
| Table 7 Standard regression weights, c.r. Values and results |
||||||||
| HYPOTHESIS | Estimate | S.E. | C.R. | p | Results | |||
| H1 | Store image | <--- | merchandise | 0.387 | 0.054 | 7.188 | *** | Supported |
| H2 | Store image | <-- | convenience | 0.833 | 0.055 | 10.14 | *** | Supported |
| H3 | Store image | <-- | Service interaction | 0.191 | 0.038 | 4.659 | *** | Supported |
| H4 | Store image | <-- | Social responsibility | 0.345 | 0.032 | 7.718 | *** | Supported |
*P<0.001 significance
Conclusion
This study is an important one which establishes the importance of store image and its role in building loyalty in the long run for retailers. As suggested in literature, “The image of a store directly affects store loyalty” (Matineau, 1958). A positive store image has been identified as a key determinant of store choice (Doyle and Fenwick, 1974). Sirgy and Samli (1985) suggested that image is directly related to store loyalty. In view of the intense competition among various retail-shopping formats in India and elsewhere, retailers need to understand the antecedents that are influencing the store patronage in order to maintain their competitiveness. According to Engel, Blackwell and Miniard (1990) “store image is a variable that consumers depend on in their choice of stores”. Osman (1993) found that the customers perceived past purchase experiences and store image as determinants of customer loyalty. In one of the studies carried out on an upmarket department store by Rosenberger (2004), store image proved to be a strong influence on building loyalty, which is similar to Andreassen and Lindestad (1998) model as tested in the Australian department store context as well as this study carried out in Indian context. Oliver (1999) suggested that there are many benefits of a brand image namely functional, social, symbolic; experiential and appearance enhances which may influence customer loyalty intention.
Many researchers have empirically tested and suggested that a favourable image (of a store or brand) leads to customer loyalty (Kandampully and Suhartanto, 2000; Koo, 2003; Nguyen & LeBlanc, 1998). Thus, there was a need for this construct to be tested empirically in lifestyle retail setting to help to understand its effect in India.
Managerial Implication
Establishing a base of loyal customers has benefits both for the service provider and also for the customers. For the service organisation, it is much cheaper and cost effective to retaining an already existing customer than making efforts in acquiring new customers. Customers who have a positive and friendly personal relationship with the service provider do not consider alternatives (Goodwin and Gremler, 1996). Creating loyalty must be at the core of all retail strategies and to achieve this, practitioners must ensure that they understand the various antecedents of customer loyalty and target their efforts towards enhancing loyalty towards the service provider. The retail marketing strategy needs to be updated regularly while matching with the changing needs and wants of customers. In the process of improving loyalty, the service provider needs to enhance its capabilities and the offerings, which will ultimately need to its long-term sustainability in the market. In addition to this, loyal customers can go up the loyalty pyramid and may become advocates and partners of the service providers in the long-run.
Limitation And Scope For Further Research
The framework developed through this study applies mainly to lifestyle retailing. Future researchers need to test the framework in other retail formats and services organisations. The study includes limited number of variables whereas future studies could include other variables. Also an empirical study on the effects of store image in building loyalty can be explored in future.
References
- Anderson, W.T. (1971). Identifying the convenience-oriented consumer. Journal of Marketing Research, 179-183.
- Andreassen, T.W. & Lindestad, B. (1998). Customer loyalty and complex services: The impact of corporate image on quality, customer satisfaction and loyalty for customers with varying degrees of service expertise. International Journal of Service Industry Management, 9(1), 7-23.
- Anne?Sophie, B. (2008). Exploring the relationships between retail brands and consumer store loyalty. International Journal of Retail & Distribution Management, 36(2), 94-110.
- Anselmsson, J. (2006). Sources of customer satisfaction with shopping malls: A comparative study of different customer segments. International Review of Retail, Distribution and Consumer Research, 16(1), 115-138.
- Barnes, J.G. (1994). Close to the customer: But is it really a relationship? Journal of Marketing Management, 10(7), 561-570.
- Barnes, J.G. (1994). The issue of establishing relationships with customers in service companies: When are relationships feasible and what form should they take. In Third Annual “Frontiers in Services” Conference, Owen Graduate School of Management, Vanderbilt University, Nashville, Tennessee, October.
- Baumann, C., Elliott, G. & Hamin, H. (2011). Modelling customer loyalty in financial services: A hybrid of formative and reflective constructs. International Journal of Bank Marketing, 29(3), 247-267.
- Bearden, W.O. (1977). Determinant attributes of store patronage-downtown versus outlying shopping centres. Journal of Retailing, 53(2), 15.
- Bell, D.R., Ho, T.H. & Tang, C.S. (1998). Determining where to shop: Fixed and variable costs of shopping. Journal of Marketing Research, 35(3).
- Beristain, J.J. & Zorrilla, P. (2011). The relationship between store image and store brand equity: A conceptual framework and evidence from hypermarkets. Journal of Retailing & Consumer Services, 18(6), 562-574.
- Berry, L.L. & Gresham, L.G. (1986). Relationship retailing: Transforming customers into clients. Business Horizons, 29(6), 43-47.
- Berry, L.L. & Gresham, L.G. (1995). Relationship retailing: Transforming customers into clients. In relationship marketing for competitive advantage. Winning and keeping customers, Oxford: Butterworth-Heinemann.
- Berry, L.L., Seiders, K. & Grewal, D. (2002). Understanding service convenience. Journal of Marketing, 66(3), 1-17.
- Binninger, A.S. (2008). Exploring the relationships between retail brands and consumer store loyalty. International Journal of Retail & Distribution Management, 36(2), 94-110.
- Bloemer, J. & De-Ruyter, K. (1998). On the relationship between store image, store satisfaction and store loyalty. European Journal of marketing, 32(5/6), 499-513.
- Bove, L.L., Pervan, S.J., Beatty, S.E. & Shiu, E. (2009). Service worker role in encouraging customer organisational citizenship behaviours. Journal of Business Research, 62(7), 698-705.
- Brady, M.K. & Cronin, J.J. (2001). Some new thoughts on conceptualizing perceived service quality: A hierarchical approach. Journal of Marketing, 65(3), 34-49.
- Brown, L.G. (1990). Convenience in services marketing. Journal of Services Marketing, 4(1), 53-59.
- Burns, D.J. (1992). Image transference and retail site selection. International Journal of Retail & Distribution Management, 20(5), 38-43.
- Burt, S. & Carralero-Encinas, J. (2000). The role of store image in retail internationalisation. International Marketing Review, 17(4/5), 433-453.
- Byrne, B.M. & van-De-Vijver, F.J. (2010). Testing for measurement and structural equivalence in large-scale cross-cultural studies: Addressing the issue of non-equivalence. International Journal of Testing, 10(2), 107-132.
- Chang, Y.W. & Polonsky, M.J. (2012). The influence of multiple types of service convenience on behavioural intentions: The mediating role of consumer satisfaction in a Taiwanese leisure setting. International Journal of Hospitality Management, 31(1), 107-118.
- Chaudhuri, A. & Holbrook, M.B. (2001). The chain of effects from brand trust and brand affect to brand performance: The role of brand loyalty. Journal of Marketing, 65(2), 81-93.
- Cheng, S. (2011). Comparisons of competing models between attitudinal loyalty and behavioural loyalty. International Journal of Business and Social Science, 2(10), 149-166.
- Chiang, W.Y.K., Zhang, D. & Zhou, L. (2006). Predicting and explaining patronage behaviour toward web and traditional stores using neural networks: A comparative analysis with logistic regression. Decision Support Systems, 41(2), 514-531.
- Chitty, B., Ward, S. & Chua, C. (2007). An application of the ECSI model as a predictor of satisfaction and loyalty for backpacker hostels. Marketing Intelligence & Planning, 25(6), 563-580.
- Clulow, V. & Reimers, V. (2009). How do consumers define retail centre convenience? Australasian Marketing Journal, 17(3), 125-132.
- Comer, L.B. & Drollinger, T. (1999). Active empathetic listening and selling success: A conceptual framework. Journal of Personal Selling & Sales Management, 19(1), 15-29.
- Cowles, D. (1997). The role of trust in customer relationships: Asking the right questions. Management Decision, 35(3/4), 273-283.
- Cowles, D.L. (1994). Relationship marketing for transaction marketing firms: Viable strategy via command performance". In 1994 research conference proceedings, relationship marketing: Theory, methods and applications. Emory University, Atlanta, USA (pp. 1-9).
- Cunningham, R.M. (1956). Brand loyalty-what, where, how much. Harvard Business Review, 34(1), 116-128.
- Dick, A.S. & Basu, K. (1994). Customer loyalty: Toward an integrated conceptual framework. Journal of the Academy of Marketing Science, 22(2), 99-113.
- Donnelly, M. (2009). Building customer loyalty: A customer experience based approach in a tourism context (Doctoral dissertation, Waterford Institute of Technology).
- Doyle, P. & Fenwick, I. (1974). How store image affects shopping habits in grocery chains. Journal of Retailing, 50(4), 39-52.
- Ehrenberg, A.S. & Scriven, J. (1999). Brand loyalty. The Elgar Companion To Consumer Research and Economic Psychology, 53-63.
- Engel, J.F., Blackwell, R.D. & Miniard, P.W. (1990). Consumer behaviour. Hwa-Tai Bookstore, Taipei.
- Fader, P.S. & Hardie, B.G. (1996). Modelling consumer choice among SKUs. Journal of Marketing Research, 442-452.
- Fombrun, C. & Shanley, M. (1990). What's in a name? Reputation building and corporate strategy. Academy of Management Journal, 33(2), 233-258.
- Fornell, C. & Larcker, D.F. (1981). Structural equation models with unobservable variables and measurement error: Algebra and statistics. Journal of Marketing Research, 382-388.
- Foxall, G.R., Goldsmith, R.E. & Brown, S. (1994). Consumer psychology for marketing. London: Routledge.
- Frasquet, M., Gil, I. & Molla, A. (2001). Shopping-centre selection modelling: A segmentation approach. The International Review of Retail, Distribution and Consumer Research, 11(1), 23-38.
- Garland, R. & Gendall, P. (2004). Testing dick and basu's customer loyalty model. Australasian Marketing Journal, 12(3), 81-87.
- Ghosh, A. (1990). Retail Management. The Dryden press, Chicago, IL.
- Gibson, D., Gonzales, J.L. & Castanon, J. (2006). The importance of reputation and the role of public relations. Public Relations Quarterly, 51(3), 15.
- Goodwin, C. & Gremler, D.D. (1996). Friendship over the counter: How social aspects of service encounters influence consumer service loyalty. Advances in Services Marketing and Management, 5, 247-282.
- Goodwin, C. & Verhage, B.J. (1989). Role perceptions of services: A cross-cultural comparison with behavioural implications. Journal of Economic Psychology, 10(4), 543-558.
- Gopal, D. (2014). Impact of store image on store loyalty and purchase intention: Does it vary across gender? International Journal of Electronic Marketing and Retailing, 6(1), 52-71.
- Gore, A. (1997). World-class courtesy: A best practices report: A report of the National Performance Review. The Review.
- Gremler, D.D. & Brown, S.W. (1996). Service loyalty: Its nature, importance and implications. Advancing Service Quality: A Global Perspective, 171-180.
- Gremler, D.D. & Brown, S.W. (1998). Service loyalty: Antecedents, components and outcomes. In AMA Winter Educations Conference, 9, 165-166.
- Gremler, D.D. & Gwinner, K.P. (2000). Customer-employee rapport in service relationships. Journal of Service Research, 3(1), 82-104.
- Hall, R. (1993). A framework linking intangible resources and capabilities to sustainable competitive advantage. Strategic Management Journal, 14(8), 607-618.
- Hansen, R.A. & Deutscher, T. (1975). An empirical investigation of attribute importance in retail store selection. Division of research, College of administrative science, Ohio State University.
- Houston, M.J. & Nevin, J.R. (1981). Retail shopping area image: Structure and congruence between downtown and shopping centres. Advances in Consumer Research, 8, 677-681.
- Hunt, G. & Price, J.B. (2002). Building rapport with the client. The Internal Auditor, 59(2), 20-21.
- Jacoby, J. & Chestnut, R.W. (1978). Brand loyalty measurement and management.
- Jacoby, J. & Mazursky, D. (1984). Linking brand and retailer images: Do the potential risks outweigh the potential benefits? Journal of Retailing, 60(2), 105-122.
- James, D.L., Durand, R.M. & Dreves, R.A. (1976). The use of a multi-attributes attitudes model in a store image study. Journal of Retailing, 52, 23-32.
- Jones, T. & Taylor, S.F. (2007). The conceptual domain of service loyalty: How many dimensions? Journal of Services Marketing, 21(1), 36-51.
- Kandampully, J. & Suhartanto, D. (2000). Customer loyalty in the hotel industry: The role of customer satisfaction and image. International Journal of Contemporary Hospitality Management, 12(6), 346-351.
- Koo, D.M. (2003). Inter-relationships among store images, store satisfaction and store loyalty among Korea discount retail patrons. Asia Pacific Journal of Marketing and Logistics, 15(4), 42-71.
- Marks, R.B. (1976). Operationalizing the concept of store image. Journal of Retailing, 52, 37-46.
- Mattson, B.E. (1982). Situational influences on store choice. Journal of Retailing, 58(3), 46-58.
- Mazursky, D. & Jacoby, J. (1986). Exploring the development of store images. Journal of Retailing, 62(2), 145-165.
- Nguyen, N. & LeBlanc, G. (2001). Image and reputation of higher education institutions in students’ retention decisions. International Journal of Educational Management, 15(6), 303-311.
- Osman, M.Z. (1993). A conceptual model of retail image influences on loyalty patronage behaviour. International Review of Retail, Distribution and Consumer Research, 3(2), 133-148.
- Rattanaphan, P. & Mat, N.K.N. (2012). The relationship of direct antecedent variables on corporate image of direct selling companies in Thailand. International Conference on Economic, Business and Marketing Management, IPEDR, 29, 11-17.
- Roberts, P.W. & Dowling, G.R. (2002). Corporate reputation and sustained superior financial performance. Strategic Management Journal, 23(12), 1077-1093.
- Schiffman, L.G., Dash, J.F. & Dillon, W.R. (1977). Contribution of store-image characteristics to store-type choice. Journal of Retailing, 53(2), 3.
- Sirgy, M.J. & Samli, A.C. (1985). A path analytic model of store loyalty involving self-concept, store image, geographic loyalty and socioeconomic status. Journal of the Academy of Marketing Science, 13(3), 265-291.
- Söderlund, M. (2006). Measuring customer loyalty with multi-item scales: A case for caution. International Journal of Service Industry Management, 17(1), 76-98.
- Thang, D.C.L. & Tan, B.L.B. (2003). Linking consumer perception to preference of retail stores: An empirical assessment of the multi-attributes of store image. Journal of Retailing and Consumer Services, 10(4), 193-200.
- Tlapana, T.P. (2009). Store layout and its impact on consumer purchasing behaviour at convenience stores in Kwa Mashu. Doctoral dissertation, Durban University of Technology.
- Torres-Moraga, E., Vásquez-Parraga, A.Z. & Zamora-González, J. (2008). Customer satisfaction and loyalty: Start with the product, culminate with the brand. Journal of Consumer Marketing, 25(5), 302-313.
- Vázquez-Carrasco, R. & Foxall, G.R. (2006). Influence of personality traits on satisfaction, perception of relational benefits and loyalty in a personal service context. Journal of Retailing and Consumer Services, 13(3), 205-219.
- Visser, E.M., Noordwyk, H.S. & Preez, R. (2006). Importance of apparel store image attributes: Perceptions of female consumers. SA Journal of Industrial Psychology, 32(3), 49-62.
- Wang, C.Y. (2010). Service quality, perceived value, corporate image and customer loyalty in the context of varying levels of switching costs. Psychology & Marketing, 27(3), 252-262.
- Yoo, S. & Chang, Y. (2005). An exploratory research on the store image attributes affecting its store loyalty. Seoul Journal of Business, 11(1), 19-41.
- Zimmer, M.R. & Golden, L.L. (1988). Impressions of retail stores: A content analysis of consume. Journal of Retailing, 64(3), 265.