Research Article: 2020 Vol: 21 Issue: 1
New Evidence for Appliances Adoption and Employment Decisions of Married Women: The Importance of Race and Home Ownership
Abstract
We use 1960 and 1970 Census survey data to further examine households’ decision to own home appliances and the resulting impact on labor force participation decision of married women. We show that in both 1960 and 1970 survey data, the labor force participation rate of married women is greater in households that do not own home appliances compared to households that own home appliances. In addition, we find that variables related to race, home ownership, family size, and total household income are key factors in households’ decision to own home appliances leading to a more nuanced interpretation of the causal relationship between ownership of home appliances and the decision of married women to work. We infer from our results that increases in the rate of home ownership between 1960 and 1970 as well as decline in the price of home appliances relative to household income were important economic factors that influenced households’ decision to own home appliances.
Keywords
Home Ownership, Race, Appliances Adoption, Labor Force Participation, Married Women.
Introduction
Recent research in the economic literature at the intersection of household economics and macroeconomics links technological progress at home to the emancipation of women in the twentieth century Greenwood (2019); Jones et al. (2015); Bose et al. (2019). For example, Greenwood et al. (2005) use a calibrated dynamic macroeconomic model to show how electricity and labor-saving appliances freed women from full-time household drudgery and enabled them to join the labor force. Quantitatively, counterfactual experiments of calibrated dynamic models show that the adoption of home appliances can account for the bulk (more than half) of changes in labor force participation of married women, changing fertility patterns and mating decisions Greenwood et al. (2005); Greenwood et al. (2005a); Greenwood et al. (2005b); Greenwood (2014). Interestingly, the economic mechanisms embedded in the aforementioned papers have been validated empirically using both time-series data Cavalcanti & Tavares (2008) and cross-sectional microeconomic data Leon et al. (2010); Cardia (2014) & Dinkelman (2011).
In this paper, we use micro-level data from the 1960 and 1970 U.S. Census to further analyze the determinants of households’ home appliances adoption. The 1960 and 1970 surveys are particularly well suited for our analysis. Only in these two decades were households asked to provide information about whether they own home appliances (washing machine, freezers, dryers) in addition to the usual demographic variables. In addition, married women continued to join the labor force and households adopted home appliances in drove during these two decades. We take advantage of both cross-sectional and time-series variations in appliances ownership and labor force participation rates to shed further light on the causal relationship between home appliances and labor force participation of married women.
For both the 1960 and 1970 surveys, we find that the rate of home appliances adoption is greater in household where women do not work compared to household where women work. In addition, changes in home appliances ownership rate between 1960 and 1970 are the same in households where women work compared to households where women do not work. To the best of my knowledge these two data properties are not previously highlighted in the literature. While they do not invalidate the empirical findings of Cavalcanti & Tavares (2008); Leon et al. (2010), they certainly suggest that the decision to adopt home appliances is not one-dimensional in relationship to women’s work and that more research is needed to fully understand its determinants.
We further study the determinants of home appliances ownership including race, home ownership, dwelling size, family size including number of children, husband’s wages, and of course women’s employment. We find important differences in the characteristics of households that own home appliances and those who do not. First, the labor force participation rate of women is greater for households that do not own the home appliances. Second, race is a key determinant of home appliances ownership. In the 1960 Census survey, the fraction of women of color is larger in households that did not own home appliances compared to households that did. Third, households that own home appliances are also more likely to own the housing unit where they live. Fourth, families that own home appliances are larger in size, as evidenced by a greater number of children and additional rooms and bedrooms. Finally, total household income is greater for households that buy home appliances.
Altogether, these facts suggest that race, home ownership, and family size are key determinants of households’ decision to own appliances. In addition, note that since women of color are less likely to own home appliances and more likely to work, labor force participation of married women is greater in households that did not own home appliances.
To quantify our findings, we estimate the impact of race and home ownership on the likelihood of home appliances ownership from an OLS regression equation. Our estimated coefficients are all statistically significant and their signs and magnitude confirm the intuition gained from data analysis. We find that variables related to race, home ownership, family size, and total household income played a significant role in households’ decision to own home appliances leading to a more nuanced interpretation of the causal relationship between ownership of home appliances and the decision of married women to work. We infer from our research results that increase in the rate of home ownership between 1960 and 1970 as well as decline in the price of home appliances relative to household income was the primary reason for the decision of home appliance ownership (FRED 2020, Home ownership rate 1965-2019).
The remainder of the paper is organized as follows. In the next Section, we present our data set and analyze married women’s labor force participation given home appliances ownership. Next we study the determinants of home appliances ownership, including home ownership and variables related to family size and household income. Finally, we offer concluding remarks.
Data
Our data set consists of individual-level data for married women from two cross-sections of the US census for the decades 1960 and 1970 (Ruggles et al., 2004). We use the census data for these two decades because information about home appliances ownership (washing machine, dryer, freezer, and dishwasher) is available above and beyond the usual demographic and economic characteristics. We present descriptive statistics in Table 1 below.
| Table 1: Descriptive Statistics ? Mean (Standard Deviation) | ||
| Variables | 1960 | 1970 |
|---|---|---|
| Labor Force Participation (dummy, 1=work) | 0.34 | 0.44 |
| Home Appliances Ownership: | ||
| Washing Machine (dummy, 1=own) | 0.84 | 0.82 |
| Dryer (dummy, 1=own) | 0.26 | 0.56 |
| Freezer (dummy, 1=own) | 0.21 | 0.34 |
| Dishwasher (dummy, 1=own) | - | 0.26 |
| Household Demographics: | ||
| Age | 37.5 (9.95) |
37.39 (10.66) |
| Race (dummy, 0=white) | 0.09 | 0.09 |
| Years of Education | 10.47 (2.94) |
11.38 (2.73) |
| Number of children present in HH | 1.87 (1.61) |
1.85 (1.61) |
| Number of children under age 5 present in HH | 0.56 (0.86) |
0.42 (0.71) |
| Total number of children ever born | 2.38 (1.86) |
2.46 (1.87) |
| Total Household Income | $7,219 ($3,998) |
$12,439 ($7,068) |
| Number of Observations | 51,263 | 301,915 |
For both decades, we select women who are married, spouse present; who are between age 20 and 60 and who are not in school. We exclude women who live in group quarters or vacant units, whose husbands’ real wage is less than $100, and the households for which information about the ownership of one of the four appliances is missing.
We report the following variables for married women: whether they own at least one washing machine, one dryer, one dishwasher, or one freezer; their age, race, educational attainment, labor force participation, the number of own children in the household, the number of own children under age five in the household, the total number of children ever born, their husband’s real wage using 1960 as the base year, the education of the husband, the total household real income using 1960 as the base year; whether the household owns the property where it lives, the number of rooms/bedrooms in the housing unit.
The variables washing machine, dryer, dishwasher, freezer is binary dummy variables taking the value of one when households own at least one unit of appliance. We do not include the refrigerator as part of home appliances because the fraction of households that owns a refrigerator in our data is very close to one in both samples. Moreover, we do not include home appliances such as the vacuum cleaner or the microwave because no information about these variables is provided in either census.
Information about race, labor force participation and ownership of the housing unit is coded using dummy variables which are equal to one when married women are not white, participate in the labor force, and own the housing unit where they live, respectively. Finally, the education attainment is measured by the highest grade of education completed.
The 1960 and 1970 samples differ in three critical ways. First, the average employment rate increased by eleven percentage points. Second, the fraction of women who own a dryer and a freezer increased by thirty and twelve percentage points, respectively, while the fraction of women who own a washing machine decreased by a modest two percentage points. Finally, the mean husband’s wage increases by thirty-three percent from $5,567 to $7,365, while total household income by thirty-three percent from $7,219 to $12,439. Note that one reason for the increase in the mean (median) income is a rise in the top coding of wages from $25,000 in the 1960 census to $50,000 in the 1970 census.
Since our analysis is primarily concerned with assessing the impact of home appliances on the participation decisions of married women, we also present the samples means for both censuses by employment status (Table 2).
| Table 2: Home Appliances Ownership By Employment Status | |||
| Variables | Employment = 0 (does not work) |
Employment =1 (work) |
Difference (work =0) ? (work� = 1) |
|---|---|---|---|
| Home Appliances Ownership, 1960: | |||
| Washing Machine (dummy, 1=own) | 0.87 | 0.80 | +0.07 |
| Dryer (dummy, 1=own) | 0.27 | 0.22 | 0.05 |
| Freezer (dummy, 1=own) | 0.21 | 0.20 | 0 |
| Home Appliances Ownership, 1970: | |||
| Washing Machine (dummy, 1=own) | 0.85 | 0.79 | 0.06 |
| Dryer (dummy, 1=own) | 0.58 | 0.54 | 0.04 |
| Freezer (dummy, 1=own) | 0.34 | 0.33 | 0.01 |
| Dishwasher (dummy, 1=own) | 0.26 | 0.25 | 0.01 |
Two important facts emerge. First, the fraction of households that own home appliances is higher for women who do not work compared to women who work. For example, for the 1960 census, the ownership rate for washing machine is 7 percentage points higher in households where women who do not work compared to households when women who work (Table 2).
| Table 3:
Characteristics Of Households Which Do Not Own Home Appliances 1960 Census ?Mean (Standard Deviation) |
|||
| Variables | Washing Machine |
Dryer | Freezer |
|---|---|---|---|
| Labor Force Participation: | 0.44 | 0.35 | 0.34 |
| Home: | |||
| Home Ownership (dummy, 1=own) | 0.31 | 0.59 | 0.61 |
| Number of Rooms | 4.08 (1.37) |
4.97 (1.39) | 5.04 (1.40) |
| Number of Bedrooms | 2.82 (0.87) |
3.37 (0.85) |
3.42 (0.85) |
| Demographics: | |||
| Age | 36.37 (11.47) |
37.62 (10.30) |
37.14 (10.18) |
| Race (dummy, 0=white) | 0.21 | 0.11 | 0.09 |
| Years of Education | 10.11 (3.04) |
10.09 (2.94) |
10.38 (2.96) |
| Number of children | 1.23 (1.58) |
1.77 (1.62) |
1.82 (1.60) |
| Number of children under age 5 | 0.46 (0.82) |
0.53 (0.84) |
0.59 (0.88) |
| Total Number children ever born | 1.77 (1.97) |
2.33 (1.93) |
2.32 (1.87) |
| Husband’s wage | $4,417 ($2,834) |
$4,977 ($2,664) |
$5,360 ($3,009) |
| Household Total Income | $6,199 ($3,797) |
$6,562 ($3,466) |
$6,956 ($3,762) |
| Number of Observations: | 7978 | 38085 | 40481 |
Second, the increase in the home appliances ownership rate over time between 1960 and 1970 is comparable in households when women work and in households when women do not work. For example, in households where women do not work, household dryer’s ownership rate increases by 31 percentage points from 1960 to 1970. In contrast, in households where women work, household dryer’s ownership rate increases by 32 percentage points from 1960 to 1970 (Table 2).
To the best of my knowledge these two data observations about levels and changes over time in home appliances ownership rate are new in the household economic and macroeconomic literature. They call for further exploration of the determinants of households’ home appliances ownership decisions which we carry out in the next Section.
Home Appliances Ownership Decision
We use 1960 Census survey data to shed further light on who owns home appliances. Instead of analyzing at women’s participation decision given the presence home appliances, we study the determinants of home appliances ownership (washing machine, dryer, and freezer) including the following household characteristics: race, home ownership, dwelling size, family size including number of children, husband’s wages, and of course women’s employment. We present some descriptive statistics for households that own the home appliances versus those households who do not in Tables 3 and 4, respectively.
| Table 4: Characteristics Of Households Which Own Home Appliances1960 Census ?Mean (Standard Deviation) | |||
| Variables | WashingMachine | Dryer | Freezer |
|---|---|---|---|
| Labor Force Participation: | 0.32 | 0.30 | 0.33 |
| Home: | |||
| Home Ownership (dummy, 1=own) | 0.71 | 0.84 | 0.83 |
| Number of Rooms | 5.40(1.34) | 5.84 (1.33) | 5.78(1.39) |
| Number of Bedrooms | 3.62(0.78) | 3.86(0.71) | 3.82(0.76) |
| Demographics: | |||
| Age | 37.75(9.63) | 37.29(8.85) | 37.14(8.88) |
| Race (dummy, 0=white) | 0.06 | 0.01 | 0.04 |
| Years of Education | 10.54(2.93) | 11.56(2.72) | 10.83(2.93) |
| Number of children | 1.99(1.58) | 2.16(1.51) | 2.08(1.61) |
| Number of children under age 5 | 0.58(0.87) | 0.66(0.90) | 0.48(0.79) |
| Total Number children ever born | 2.49(1.82) | 2.54(1.63) | 2.62(1.80) |
| Husband’s wage | $5,779($3,273) | $7,272($4,072) | $6,342($3,919) |
| Household Total Income | $7,407($4,006) | $9,118($4,756) | $8,208($4,652) |
| Number of Observations: | 43285 | 13178 | 10782 |
There are important differences between households who own home appliances and those who do not. First, the labor force participation rate of women is greater for households that do not own the home appliances. For example, among households that do not own a washing machine, forty-four percent of women work, while only thirty-two percent of women who own a washing machine work (Tables 3 & 4).
Second, race is a key determinant of whether home appliances ownership. For example, 21 percent of households that did not own a washing machine were not white compared to only 6 percent compared to households that owned a washing machine (Tables 3 & 4). Since labor force participation is higher for women of color compared to white women, the impact of race for home ownership is consistent with the previous finding that labor force participation of married women was greater in households that did not own home appliances.
Third, households that own the home appliances are also more likely to own the housing unit where they live. For example, seventy-one percent of households that own a washing machine own the housing unit where they live, while, among households that do not own their housing unit, only thirty-one percent their own a washing machine (Tables 3 & 4).
Fourth, families that own home appliances are larger in size, as evidenced by a greater number of bedrooms and number of children. For example, the mean number of rooms and bedrooms is equal to 5.4 and 3.62 for households that own a washing machine compared to 4.08 and 2.82 for those who do not (Tables 3 & 4). The negative impact of children for labor force participation over the life-cycle is well established in the literature Cardia & Gomme (2018); Lubotsky & Qureshi (2018); Buttet & Schoonbroodt (2013); see also Goldin & Katz (2002). Our results show that women in households with a greater number of children are less likely to work and more likely to own home appliances.
Finally, the mean (median) total household income is greater for households that buy home appliances. For example, the mean total household income is equal to $7,272 for households that own a dryer compared to $4,977 for those who do not, a difference in income of more than forty percent (Tables 3 & 4). Part of the large differences in income can be accounted for by differences in racial composition. For example, ninety-four percent of households that own a washing are whites, while among those households that do not own a machine, only seventy-nine percent are whites. Altogether, these facts suggest that the probability of buying home appliances significantly increases with total household income and variables related to family size.
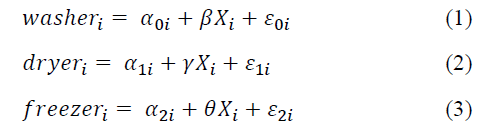
To quantify the impact of variables related to family size and total household income on the probability that a household buys home appliances, we run three logistic regressions where the dependent variables washeri, dryeri, freezeri, are binary variables equal to one when household i owns a dishwasher, a dryer, and a freezer, respectively. The vector of control variables X includes both demographic characteristics (race, age, total household income, schooling of wife and husband) as well as information about ownership of the housing unit, the number of children in the household, and the number of rooms and bedrooms.
The results for this model are presented in Table 5 and all estimated coefficients are all statistically significant. Our estimates confirm our previous data analysis that variables related to race, home ownership, family size and total household income are key determinants of the probability of home appliances ownership. Interestingly, the impact of age and education for home appliance ownership is comparable to that of these two variables for women’s wages Eckstein & Wolpin (1989). Finally, the coefficient for race is negative and statistically significant. As mentioned earlier, women of color are less likely to own home appliances and more likely to work.
| Table 5: Estimation Results ? Equation (1) ? (3) | |||
| Variables | Washing Machine, β | Dryer, γ | Freezer, θ |
|---|---|---|---|
| Home: | |||
| Home Ownership (dummy, 1=own) | 1.0744 (0.03) | 0.7977 (0.29) | 0.7811 (0.03) |
| Number of Rooms | 0.3766 (0.02) | 0.1610 (0.01) | 0.1741 (0.01) |
| Number of Bedrooms | 0.3973 (0.03) | 0.2041 (0.02) | 0.1293 (0.02) |
| Demographics: | |||
| Age | 0.1282 (0.01) | 0.0873 (0.01) | 0.1140 (0.01) |
| Age x Age | -0.0017 (1e-4) | -0.0013 (1e-4) | -0.0013 (1e-4) |
| Race (dummy, 0=white) | -1.1946 (0.04) | -1.7710 (0.08) | -0.6147 (0.05) |
| Years of Education | 0.0254 (5e-3) | 0.0940 (4e-3) | 0.0196 (4e-3) |
| Number of children | 0.1215 (0.02) | 0.0025 (0.01) | 0.0344 (0.01) |
| Number of children under age 5 | 0.2228 (0.02) | 0.2698 (0.01) | -0.0977 (0.02) |
| Total Number children ever born | 0.0262 (0.01) | 0.0342 (0.01) | 0.0403 (0.01) |
| Husband’s wage | 0.0832 (0.01) | 0.8674 (0.02) | 0.0736 (0.02) |
| Household Total Income | 0.0774 (0.02) | 0.9545 (0.02) | 0.0858 (0.02) |
Conclusion
In this paper, we used micro-level data from the 1960 and 1970 U.S. Census surveys to further analyze households’ decision to own home appliances and its impact for labor force participation decision of married women. Previous research in macroeconomics argues that home appliances were “Engines of liberation” for married women and ushered social and economic change for women. Our results shed new light on the relationship between home appliances adoption and women’s decision to work. It highlights the importance of race, home ownership, and family size as key determinants of home appliances adoption. One challenge for further research will be to build macroeconomic models of home and appliances ownership and female labor force participation that are able to reproduce the facts shown in this paper.
References
- Buttet, S. & Schoonbroodt, A. (2013). An accounting exercise for the shift in life-cycle employment profiles of married women born between 1940 and 1960. The Journal of Labor Market Research, 46 (3), 253-271.
- Cardia, E. (2014). Household Technology and Female Labor Participation: Evidence from the U.S. Working Paper, University of Montreal, Canada
- Cardia, E., & Gomme, P. (2018). Market work, housework and childcare: A time use approach. Review of Economic Dynamics, 29, 1-14.
- Cavalcanti, T., and J. Tavares (2008). Assessing the Engines of Liberation: Home Appliances and Female Labor Force Participation, The Review of Economics and Statistics, 90(1), 81-88
- Coen-Pirani, D., Le�n, A., & Lugauer, S. (2010). The effect of household appliances on female labor force participation: Evidence from microdata. Labour Economics, 17(3), 503-513.
- Dinkelman, T. (2011). The effects of rural electrification on employment: New evidence from South Africa. American Economic Review, 101(7), 3078-3108.
- Eckstein, Z., & Wolpin, K. I. (1989). Dynamic labour force participation of married women and endogenous work experience. The Review of Economic Studies, 56(3), 375-390.
- FRED (2020), Home Ownership Rate 1965-2019. Retrieved January 28, 2020, from https://fred.stlouisfed.org/series/RHORUSQ156N
- Goldin, C., & Katz, L. F. (2002). The power of the pill: Oral contraceptives and women?s career and marriage decisions. Journal of political Economy, 110(4), 730-770.
- Greenwood, J. (2019). Evolving Households: The Imprint of Technology on Life. Cambridge, Mass: MIT Press.
- Greenwood, J., Guner, N., Kocharkov, G., & Santos, C. (2014). Marry your like: Assortative mating and income inequality. American Economic Review, 104(5), 348-53.
- Greenwood, J., Seshadri, A., & Vandenbroucke, G. (2005). The baby boom and baby bust. American Economic Review, 95(1), 183-207.
- Greenwood, J., Seshadri, A., & Yorukoglu, M. (2005). Engines of liberation. The Review of Economic Studies, 72(1), 109-133.
- Jones, L. E., Manuelli, R. E., & McGrattan, E.R. (2015). Why are married women working so much? Journal of Demographic Economics, 81(1), 75-114.
- Lubotsky, D., & Qureshi, J.A. (2018). Assessing the Smooth Rise in Mothers? Employment as Children Age. Journal of Human Capital, 12(4), 604-639.
- Ruggles, S., Sobek, M., Alexander, T., Fitch C.A., Goeken, R., Hall, P.K., King, M. & Ronnander, C. (2004). Integrated Public Use Microdata Series: Version 3.0, Minnesota Population Center.