Case Reports: 2022 Vol: 26 Issue: 6S
Performance Evaluation of Mutual Funds: Selected Hdfc Mutual Fund Schemes
Arul, Vivekanandha College of Arts and Sciences for Women
Sankar, Vivekanandha College of Arts and Science for Women
Citation Information: Alur, & Sankar. (2022). Performance evaluation of mutual funds: selected hdfc mutual fund schemes. Academy of Marketing Studies Journal, 26(S6), 1-7.
Abstract
A huge number of players have entered in Indian mutual fund industry for the post LPG era. In the line of HDFC mutual funds contributes more in mutual fund services. In current study is to evaluate the performance of selected 5 schemes offered by HDFC mutual funds in India by using the parameters of Sharpe ratio, Treynor ratio and Jensen performance index. The period of study is covered from 1st April 2017 to 31st March 2021. In order to evaluate the HDFC mutual funds performance, daily returns of HDFC mutual funds are compared with the NSE Nifty index. During the study period, Public Provident Fund (PPF) is considered as the risk-free return which is 7.65%. The results of the study revealed that among all the selected schemes, HDFC capital builder value fund has been outperformed than others.
Keywords
Sharpe Ratio, Treynor Ratio, Jensen Measure, Performance Evaluation, Risk-Return and Index etc.
Introduction
An Indian financial institution has played a vital role in the economy of the nation. Among the various financial institutions, mutual fund institution offer financial services and most attractive investment instruments to the investors. Therefore, mutual funds contribute more in the growth and development of financial markets and boost the economy. With the formation of Unit Trust of India (UTI) in the year 1963 it has rapid changes in financial institution. Thus the participation of mutual funds in the transformation of economy has made it imperative to analyze their services in mobilizing and allocation of investable funds through markets.This comes as a difficult for an ordinary investor to analyse the performance of mutual funds. While analyzing the past performance of mutual funds do not promise in future. Thus it becomes a need for evaluating the mutual fund performance and to observe whether the schemes are outperforming or underperforming than the benchmark. The present paper is intended to examine the performance evaluation of selected HDFC mutual fund schemes in India.
Literature Review
Palani & Chilar Mohamed (2013) compared the public and private sector mutual funds in India. They found from the study, LIC mutual fund showed better performance on the basis of Share ratio and in case of private sector, Reliance retail plan showed better performance on both Sharpe ratio and Treynor ratio.
Goel & Laveena (2015) analysed the performance of debt and equity schemes of HDFC mutual funds with reference to ICICI Prudential equity and debt mutual funds and Birla Sun Life mutual funds. They studied 15 schemes for the period from 1st January 2009 to 31st December 2013 by using Average NAV, Standard Deviation, Beta and Sharpe ratio. Their results indicated that of all schemes, short-term plan and long term gilt fund, HDFC infrastructure fund are proficient. Further they found that Birla Sun Life Index fund and Tax Saving fund are also excellent than ICICI and HDFC mutual funds.
Sunil (2016)evaluated the performance of HDFC mutual fund equity schemes. His study revealed that HDFC capital builder fund, HDFC top 200 funds and HDFC growth fund has performed better than other schemes of HDFC mutual funds in comparison of risk-return. Among the overall schemes, HDFC equity fund has outperformed than others by using Sharpe ratio, Treynor ratio and Jensen performance measures.
Sanjay & Bhavana Raj (2019) evaluated the performance and persistence of Indian mutual fund industry. They found that investment in equity fund was rising more than equity index fund such as, index of S&P BSE Sensex, NSE Nifty 500 and NSE Nifty 50. Further their results showed that Indian mutual fund industry growth rate is more than Asian Pacific Regions and Europe, however it is equal to America and has superior growth rate from 2017.
Need of The Study
? To understand the risk-return relationship of each schemes of HDFCmutual fund schemes.
?To make and study a comparative evaluation of the mutual fund schemes offered by HDFC mutual funds.
Objectives of The Study
The objective of the study is:
? To evaluate the performance of selected schemes in HDFC mutual funds.
? To compare the performance of HDFC mutual fund schemes by using Sharpe ratio, Treynor ratio and Jensen’s performance index.
?To compare the selected schemes of risk-return with benchmark i.e. NSE Nifty.
Research Methodolgy
Research Design
The secondary data is used for the study and it describes the relation between risk and return.
Sample Selection
There are various types of mutual fund schemes is available in India which are classified under different categories. In this paper, five schemes of HDFC mutual fund schemes have been selected for the study. The convenient sampling technique is used for the sample selection Kumar & Srivastava (2016).
Data Collection
Study analyses five open-ended schemes with direct plan which are launched by HDFC mutual funds. These schemes were selected on the basis of data availability for the period from 1st April 2017 to 31st March 2021 and daily Net Asset Value (NAV) data has been used for analysis of the study. The secondary data has been obtained from the sources like NSE India, AMFI etc.
Tools for Analysis
The evaluation of mutual fund performance there are various parameters has been followed like,
Return on Portfolio
The following formula is using to calculate the portfolio return.
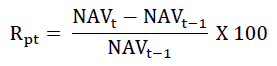
Where,
 = portfolio return for two consecutive days
 = Net Asset Value in time period t
 = Net Asset Value in time period t-1
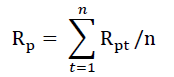
Average return of Portfolio
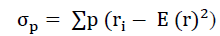
Risk measured in terms of σ(standard deviation of portfolio) and β(Beta)
Standard deviation (σ)
Beta (β)
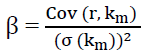
Where,
r = return on the fund
 = return on the index
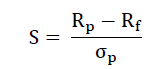
Sharpe ratio
Where,
Rp = portfolio return
Rf = risk free rate of return
σp = standard deviation of portfolio
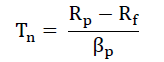
Where,
Rp = average return on Portfolio
Rf = risk free rate of return
σp = a measure of systematic risk
Jensen Performance Index

Where,
Rp = average return on portfolio
α=the intercept
Rf = risk free rate of return
β=a measure of systematic risk
σm = average market return
Limitation of The Study
There are huge number of schemes were offered by HDFC mutual funds. To the time constraint it is not possible to evaluate all the schemes, this paper limit five schemes were selected.
Results and Discussion
The results of the study have been presented in the form of table below Table 1.
Table 1 shows the list of HDFC mutual fund schemes were launched in different dates. Hence, this paper is to covers the period from 1st April 2017 to 31st March 2021 for the purpose of evaluating the performance of HDFC mutual funds in India Table 2.
| Table 1 List Of Hdfc Mutual Fund Schemes Studied |
| HDFC Balanced Advantage Fund-Growth Plan- Direct Plan |
| HDFC Capital Builder Value Fund – Growth Option – Direct Plan |
| HDFC Equity Savings Fund – Growth Option – Direct Plan |
| HDFC Children’s Gift Fund – Direct Plan |
| HDFC Corporate Bond Fund – Growth Option – Direct Plan |
Table 2 depicts that average daily returns of selected HDFC mutual fund schemes. It observed that, among the selected schemes of all the years of study period HDFC capital builder value fund is having a maximum average return of 0.19 in 2020-21 as compared to all schemes and on the other hand, HDFC corporate bond fund is having the minimum of -0.03 Table 3.
| Table 2 Average Daily Returns Of Selected Hdfc Mutual Fund Schemes |
|||||
|---|---|---|---|---|---|
| S. No | Schemes | 2017-18 | 2018-19 | 2019-2020 | 2020-21 |
| 1 | HDFC Balanced Advantage Fund-Growth Plan- Direct Plan | -0.03 | -0.03 | -0.19 | 0.13 |
| 2 | HDFC Capital Builder Value Fund – Growth Option – Direct Plan | -0.02 | -0.05 | -0.24 | 0.19 |
| 3 | HDFC Equity Savings Fund – Growth Option – Direct Plan | -0.05 | -0.05 | -0.12 | 0.04 |
| 4 | HDFC Children’s Gift Fund – Direct Plan | -0.03 | -0.04 | -0.16 | 0.13 |
| 5 | HDFC Corporate Bond Fund – Growth Option – Direct Plan | -0.05 | -0.05 | -0.04 | -0.03 |
From the above Table 3 indicates that the standard deviation of selected HDFC mutual fund schemes is to measure the risk-return. The higher value indicates greater risk of funds whereas the lower value indicates less risk involved by the mutual funds. It is noted that HDFC capital builder value fund is having high risk i.e. 1.71 in the year 2019-2020 as compared to all other schemes. However, HDFC corporate bond fund is having the lower standard deviation which indicates less return Table 4.
| Table 3 Standard Deviation Of Selected Hdfc Mutual Fund Schemes |
|||||
|---|---|---|---|---|---|
| S. No | Schemes | 2017-18 | 2018-19 | 2019-2020 | 2020-21 |
| 1 | HDFC Balanced Advantage Fund-Growth Plan- Direct Plan | 0.73 | 0.75 | 1.44 | 1.19 |
| 2 | HDFC Capital Builder Value Fund – Growth Option – Direct Plan | 0 .68 | 0.76 | 1.71 | 1.27 |
| 3 | HDFC Equity Savings Fund – Growth Option – Direct Plan | 0.22 | 0.28 | 0.62 | 0.54 |
| 4 | HDFC Children’s Gift Fund – Direct Plan | 0.49 | 0.54 | 1.12 | 0.90 |
| 5 | HDFC Corporate Bond Fund – Growth Option – Direct Plan | 0.06 | 0.07 | 0.23 | 0.13 |
Table 4 shows the beta of selected HDFC mutual fund schemes which is to measure the market force. The beta of one is indicates that standard. It observed that, HDFC capital builder value fund has more risk than other schemes Table 5.
| Table 4 Beta Of Selected Hdfc Mutual Fund Schemes |
|||||
|---|---|---|---|---|---|
| S. No | Schemes | 2017-18 | 2018-19 | 2019-2020 | 2020-21 |
| 1 | HDFC Balanced Advantage Fund-Growth Plan- Direct Plan | 0.61 | 0.59 | 0.30 | 0.57 |
| 2 | HDFC Capital Builder Value Fund – Growth Option – Direct Plan | 0.58 | 0.64 | 0.34 | 0.66 |
| 3 | HDFC Equity Savings Fund – Growth Option – Direct Plan | 0.16 | 0.23 | 0.14 | 0.05 |
| 4 | HDFC Children’s Gift Fund – Direct Plan | 0.40 | 0.47 | 0.21 | 0.46 |
| 5 | HDFC Corporate Bond Fund – Growth Option – Direct Plan | -0.01 | 0.01 | 0.03 | 0.00 |
From the above table 5 indicates that Sharpe ratio of selected mutual fund schemes. Based on that, HDFC capital builder value fund and HDFC children’s Gift fund has obtained the same ratio i.e. 0.15 Table 6.
| Table 5 Sharpe Ratio Of Selected Hdfc Mutual Fund Schemes |
|||||
|---|---|---|---|---|---|
| S. No | Schemes | 2017-18 | 2018-19 | 2019-2020 | 2020-21 |
| 1 | HDFC Balanced Advantage Fund-Growth Plan- Direct Plan | -0.04 | -0.03 | -0.13 | 0.11 |
| 2 | HDFC Capital Builder Value Fund – Growth Option – Direct Plan | -0.03 | -0.07 | -0.14 | 0.15 |
| 3 | HDFC Equity Savings Fund – Growth Option – Direct Plan | -0.22 | -0.17 | -0.19 | 0.08 |
| 4 | HDFC Children’s Gift Fund – Direct Plan | -0.05 | -0.08 | -0.14 | 0.15 |
| 5 | HDFC Corporate Bond Fund – Growth Option – Direct Plan | -0.86 | -0.67 | -0.18 | -0.26 |
Table 6 indicates the Treynor ratio of selected HDFC mutual fund schemes. It is observed that, HDFC equity savings fund has identified that 9.90 Table 7.
| Table 6 Treynor Ratio Of Selected Hdfc Mutual Fund Schemes |
|||||
|---|---|---|---|---|---|
| S. No | Schemes | 2017-18 | 2018-19 | 2019-2020 | 2020-21 |
| 1 | HDFC Balanced Advantage Fund-Growth Plan- Direct Plan | 0.08 | 0.12 | -1.05 | 0.95 |
| 2 | HDFC Capital Builder Value Fund – Growth Option – Direct Plan | 0.09 | 0.11 | -0.92 | 0.82 |
| 3 | HDFC Equity Savings Fund – Growth Option – Direct Plan | 0.30 | 0.31 | -2.29 | 9.90 |
| 4 | HDFC Children’s Gift Fund – Direct Plan | 0.13 | 0.16 | -1.49 | 1.17 |
| 5 | HDFC Corporate Bond Fund – Growth Option – Direct Plan | -6.68 | 5.19 | -10.56 | -288.06 |
From table 7 depicts that Jensen’s Performance Index of selected HDFC mutual fund schemes. Based on this, HDFC capital builder value fund has obtained 299.94 and the other mutual fund schemes are presented in the above table.
| Table 7 Jensen’s Performance Index Of Selected Hdfc Mutual Fund Schemes |
|||||
|---|---|---|---|---|---|
| S. No | Schemes | 2017-18 | 2018-19 | 2019-2020 | 2020-21 |
| 1 | HDFC Balanced Advantage Fund-Growth Plan- Direct Plan | 29.33 | 41.56 | -180.98 | 295.04 |
| 2 | HDFC Capital Builder Value Fund – Growth Option – Direct Plan | 29.19 | 41.90 | -182.25 | 299.94 |
| 3 | HDFC Equity Savings Fund – Growth Option – Direct Plan | 27.14 | 39.08 | -175.74 | 267.01 |
| 4 | HDFC Childrens’ Gift Fund – Direct Plan | 28.30 | 40.72 | -178.11 | 289.21 |
| 5 | HDFC Corporate Bond Fund – Growth Option – Direct Plan | 25.43 | 36.05 | -168.10 | 257.57 |
Conclusion
This paper evaluated the performance of selected HDFC mutual fund schemes during the study period from 1st April 2017 to 31st March 2021. In order to measure the performance of selected schemes, daily NAV has been used to calculate the fund returns. For comparison purpose the benchmark of NSE Nifty has been used and Public Provident Fund (PPF) was considered as risk-free rate. To evaluate the performance, Sharpe ratio, Treynor ratio and Jensen’s performance Index was used. From the study results showed that among all the selected schemes, HDFC capital builder value fund has been outperformed than others. Further, the study results showed that, Sharpe ratio of all the schemes indicates negative results from 2017-18 to 2019-2020 while in the year 2020-21 it was positive sign of all the schemes. However, Treynor and Jensen’s performance index was showed mostly positive results for all the schemes except in the year 2019-2020 which indicates negative results.
References
Goel, A., & Laveena, A. (2015). Comparative Study on Performance Analysis of Debt and Equity Schemes at HDFC Mutual Funds with Reference to Birla Sun Life and ICICI Prudential Debt and Equity Mutual Funds.International Journal of innovative research and development,4(4).
Kumar, V., & Srivastava, A. (2016). Performance Evaluation of Equity Schemes of HDFC Mutual Fund.Sumedha Journal of Management,5(1), 38-49.
Palani and Chilar Mohamed (2013), “Public and Private Sector Mutual Fund in India”, Tactful Management Research Journal
Sanjay, A., & Bhavana Raj, K. (2019). Performance and persistence of Indian mutual fund industry.International Journal of Recent Technology and Engineering,8(2), 5212-5216.
Received: 04-Jun-2022, Manuscript No. AMSJ-22-12261; Editor assigned: 08-Jun-2022, PreQC No. AMSJ-22-12261(PQ); Reviewed: 20-Jun-2022, QC No. AMSJ-22-12261; Revised: 20-Jul-2022, Manuscript No. AMSJ-22-12261(R); Published: 02-Aug-2022