Research Article: 2022 Vol: 26 Issue: 2
Predicting the Dynamics of Customer Repurchase In Internet Shopping-An Artificial Neural Network (Ann) Approach
Magesh Kumar R, Presidency University
Pradeep E, Loyola Institute of Business Adminstration
Sunil Vakayil, Loyola Institute of Business Adminstration
Citation Information: Kumar R, M., & Pradeep, E., & Vakayil, S. (2022). Predicting the dynamics of customer repurchase in internet shopping-- an artificial neural network (ann) approach. Academy of Marketing Studies Journal, 26(2), 1-12.
Abstract
Purpose – The current study aims to identify the foremost inevitable factors that end up in on-line shopping behavior towards customer repurchase. Explicitly a model based on the Multilayer Perceptron Neural Network was trained to predict customer repurchase on an online shopping environment. Design/methodology/approach- The conceptual framework of the study empirically examined the influence of e-service quality dimensions (web design, reliability, responsiveness, assurance, and ease of use), customer satisfaction, trust; and loyalty constructs which affects the customers repurchase of Gen Z customers who have prior experience in purchasing their products in online. Findings- The result of the study was analyzed using Artificial Neural Networks. A multilayer neural perceptron network was equipped with a back-propagation algorithm to determine whether customers will buy again in online. The proposed model using a neural network technique has strongly predicted with 84.6 percent of e-shoppers as either repeat purchase or will not repeat purchase. Practical implications- Gen Z as digital natives are unique as without digital technologies such as smartphones and social media, they have never experienced life. This shift changed the world's fastest-growing consumer markets. By recognizing the consumer behavior of this community through the present study, the marketers will have the ability to bring out more successful marketing campaigns. Originality/value- A neural network model is a significant predictive analytics tool for analyzing the non-compensatory decision making of online customers. The study is unique to predict what draws the web visitors to repurchase in e-shopping. Also, from the independent variable of importance by using a neural network, it is apparent that e-satisfaction and responsiveness of the e-commerce companies are the strong predictors of customer repurchase. The study will highly benefit the online marketers to reach out to Gen Z consumers who are more dependent on smart gadgets and the internet
Keywords
Customer Repurchase, Online Consumer Behavior, Artificial Neural Network, Internet Retailing; E-Commerce; E-Loyalty.
Introduction
E-commerce is the fastest growing and most promising business transaction platform in India.
India's e-commerce revenue is forecast to jump from US$ 39 billion in 2017 to US$ 300 billion in 2023, growing at the world's highest annual rate of 51 percent. Increasing internet and smartphone adoption in India has accelerated this development (Ibef, 2020). Over a period of year business to consumer (B2C) online shopping has attracted significant sales (Mundorf & Bryant, 2002). The drive for online shopping was significantly influenced by the knowledge on the technological advancements and trust on the website (Heijden et al., 2003). Because the trust has created a psychological impact on the minds of the customers and developed a positive attitude, the intention of doing online shopping has increased day by day (Yoon, 2002). Schrank & Dubinsky (2004) have commanded that the brand name plays a crucial role in deciding the online purchase decisions, and a lack of brand image affects perceived risks among the customer's mind. Verhagen & Dolen (2009) have confirmed determinants such as online store service, various kinds of products, store ambience and online store navigation influence for online purchase intentions. Thus, the online purchase of products has become a unique way of sales channel and turned out to an intense competition among the e-commerce companies to attract customers to buy online.
Generation Z, known as Post-Millennial and I Gen or Gen Z elsewhere, are those born between 1996 and 2012 and therefore aged between 6 and 21 years in 2018 (Fry & Parker, 2018; Twenge, 2017). This generation is expected to account for around 40 percent of consumers worldwide by 2020 (Perlstein, 2017). Likewise, there is an increase in spending on digital ads due to the single largest consumers of generation Z with 28 percent of the total 48 percent of the total media audience (Sterling, 2017). Gen Z is very distinctive from the tech-savvy millennial, as they have never been without unlimited digital access, whereas the others have learned their way into digitalization (Jones, 2017). Little research has been carried especially focusing on this group of consumers to understand their online shopping habits. The current study explores the importance of using artificial neural network methodology to forecast online buying behavior on customer repurchase, to fix this void. Also, the relative prominence of various factors that affect online repurchase was examined. The finding of the study will benefit online marketers to reach out to Gen Z consumers who are more dependent on smart gadgets and the internet. In conclusion, the present study is focused on the following objectives:
1. To deeply understand what causes the customer to go for repurchase in an online buying especially directing the Gen Z customers who play a pivotal role in e-purchase.
2. To predict online buying behavior of customer repurchase using a neural network technique
3. To examine the most significant explanatory variables that affect the customer repurchase of online buying
4. To suggest suitable measures to online retailers of the fast-growing Indian e-commerce business
Review of Literature
The predictors influencing the online consumer behavior that affect customer repurchase which is evolved from the existing literature are discussed in the below section.
Earlier there are many studies on the service quality on the background of e-commerce. These empirical studies (Ribbink et al., 2004, Srinivasan et al., 2002, Wolfinbarger & Gilly 2003, Yang et al., 2003, Zeithaml et al., 2002) have focused on the key factors using ease of use, website design, responsiveness, and assurance. In reality, ease of use is an imperative construct of service quality (Dabholkar, 1996) as it influences the customers in fulfilling their needs to attain customer satisfaction, in increasing the customer trust in the services rendered by the firm (Gefen, 2002). Thus the items of this construct comprise how the information is organized in the website, comprehension of information in the site and ease of ordering and navigation of the site (Reibstein, 2002; Ribbink et al., 2004).
Website design includes items such as how the website is visually appealing in terms of appearance and provides pleasant experience while accessing the information on the site. It also comprises appropriate content of the information and good organizing and structuring the information’s on the website. Some of the studies which conducted on the background of e-commerce have suggested that website layout of the service firm is highly significant as it is directly connected to the user interface in building customer satisfaction (Gefen, 2002, Wolfinbarger & Gilly 2003, Zeithaml et al., 2002).
Responsiveness is identified by the customer compared with the high-quality service (Voss, 2000). This construct evaluates how a company has the ability to provide hasty service when the customers have queries or grievances (Gefen, 2002; Zeithaml et al., 2002). Thus understanding the responsiveness dimension can lead to prompt services and appropriate feedback of the clients can provide satisfaction which will increase the customer trust of the company among its competitors. (Gefen 2002; Gummerus et al., 2004).
Assurance are very vital as the customer expects assurance from the firm all their details are highly protected and these can directly increase the customer trust about the service firm. (Cai & Jun, 2003; Gefen, 2002; Ribbink et al., 2004). Trust is the outcome when one has confidence in trustworthiness and integrity in their products and services they have consumed (Morgan & Hunt, 1994; Ranaweera & Prabu, 2003). Further, trust could happen maybe at the individual level or at the organization level (Moorman et al., 1993). Customer loyalty in terms of behavioral dimensions is indicated by retention (Bansal & Taylor, 1999) and emotionally demonstrated by word-of-mouth (WOM) (Ranaweera & Prabhu, 2003). As has been said in the earlier researcher’s customer satisfaction is a driving force of recommending and repeat intentions among the customer. These direct relationships can be applied in the e-commerce business as well (Ribbink et al., 2004).
Research Methodology
Participants
The study is based on the primary data obtained from the two reputed universities of postgraduate students located in Tier II Coimbatore city of southern India. Both universities are composed of postgraduate students from all parts of India, thereby representing a metropolitan culture and a true reflection of the studied population.
Construct Measurement
The scales have been adapted from earlier research that demonstrated satisfactory internal reliability. The items of the constructs were measured on a five-point Likert scaling from 1= strongly disagree to 5=strongly agree. Gefen (2002) has used servqual dimensions to measure whether increased trust results in customer loyalty which is vital for online vendors. The scales of service quality were adapted from the Gefen (2002) study. Scales of customer satisfaction, trust, and loyalty of the constructs were adapted from Kassim & Nor (2008) who have measured the interrelationship among the three dimensions with the perceived service quality.
Data Collection and Sample
As a research instrument, a formal questionnaire was used, which was constructed according to the constructs specified in the previous section. The methodology of the study involves data collected from the respondents of Gen Z who have prior experience in purchasing their products in online. As the study is predominantly focused on Gen Z it is considered relevant to select college-aged students as a sample for the study. The questionnaire included a demographic profile of the respondents and followed by the frequency of purchase on ecommerce and their selection of the most important website. A convenient sample of postgraduate students who were Gen Z i.e. who were born after the year 1995 were chosen for our study. The survey questionnaire was circulated to the 330 respondents and in total 265 responses were considered to be fit for further analysis. In line with earlier studies performed to explain the behavioral intention of the customers (Feather man & Pavlou, 2003; Wu & Wang, 2005; Koenig?Lewis et al., 2010), the study also used convenient sampling to collect primary data.
Results and Analysis
Neural Network Model
The neural network model observed by Hruschka (1993) has been found to be effective than any other econometric model that involves linear regression. A neural network consists of three different layers input; hidden and output which form a neural network. The input variable is also known as predictor a variable is denoted by I (I1, I2, and I3…I24). It includes the predictor that could affect customer repurchase such as Web design, Reliability, Responsiveness, Assurance, Ease of Use, E-Satisfaction, E-Loyalty, and Trust. H indicates the hidden layer (H1, H2, and H3) along with bias and WI represents the weight vector leading to input nodes. For the study one hidden layer is used and it consists of 4 units of hidden layers as shown in figure 1. The dependent variable is the target or output variable in the model. Customer repurchase is a dichotomous variable, with values taking 0 and 1. The value 0 shows I will buy again online, ‘yes’ category whereas the value 1 shows I will buy again online ‘No’ category.

Figure 1 Network Diagram
ANN Design and Setup
The Multilayer Perceptron (MLP) module IBM SPSS Statistics 21 was used to build and test the consistency of the neural network model. MLP networks, trained with a learning algorithm for back-propagation has used gradient descent to update the weights to mitigate error function. Automatic architecture selection selected 2 nodes for the hidden layer, while the output layer had 1 node to code the dependent variable Customer repurchase. The activation function was the hyperbolic tangent for the hidden layer, while the identity is standardized for rescaling approach for scale-dependent activation function. The activation function of the model of the jth output neuron is
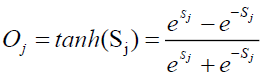
This function takes real numbers as arguments with values between -1 and 1 as real values. For the model of the output layer, softmax function is deployed as activation function. Hence activation using softmax as function of the output neuron is
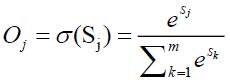
Where m is the number of output neurons. Softmax function also too takes real numbers as values between 0 and 1 that have sum equal to 1.
Sensitivity Analysis
A sensitivity analysis of the data from the training set has been performed with the main aim of defining and eliminating input variables that have a low impact on the online purchase (Engelbrecht & Cloete, 1996). Sensitivity analysis was carried out in the study to remove the input variables from the training neural network model which were found to be non-significant. On the reduced network, this procedure was replicated until all the minor variables were eliminated. By this, the indispensable factors or variables have been confirmed which were impacting the output value (Tsaih, 1999). Table 1, shows the sensitivity values that were obtained from the neural network analysis.
| Table 1 Output of Sensitivity Analysis | |||||
| Predictor | Predicted | ||||
| Hidden Layer 1 | |||||
| H(1:1) | H(1:2) | H(1:3) | H(1:4) | ||
| Input Layer | (Bias) | .533 | -.836 | .419 | .049 |
| Web design | .123 | -.236 | .102 | -.248 | |
| Reliability | .159 | -.424 | .328 | -.018 | |
| Responsiveness | -.954 | .082 | -.892 | -1.090 | |
| Assurance | -.518 | .368 | .401 | .192 | |
| Ease of Use | .770 | -.344 | -.168 | .255 | |
| E-Satisfaction | .066 | -1.125 | .836 | 0.695 | |
| E-Loyalty | -.737 | -.210 | 1.240 | -.381 | |
| E-Trust | -.763 | 0.703 | 0.937 | 0.291 | |
From the predicted value in Table 2 based on the input layer, the maximum sensitivity value is 1.240 and the minimum value is 0.049. Subsequently, none of the input variables have to value anything closer to 0 or 0 in all the four units of the hidden layer, no variables are removed from the network model tested (Chiang et al., 2006).
| Table 2 Classification Matrix | ||||
| Sample | Observed | Predicted | ||
| Yes | No | Percent Correct | ||
| Training | Yes | (TP) 66 | (FN) 4 | 94.3% |
| No | (FP) 17 | (TN) 8 | 32.0% | |
| Overall Percent | 87.4% | 12.6% | 77.9% | |
| Testing | Yes | (TP) 24 | (FN) 1 | 96.3% |
| No | (FP) 1 | (TN) 5 | 37.5% | |
| Overall Percent | 90.6% | 9.4% | 84.4% | |
Classification Matrix
A classification matrix on the test data of the study is deployed to examine its predictive accuracy on whether the customer will buy again online or not.
From table 2, the classification matrix depicts the practical results of deploying the network. In the table, the diagonal cells of the cross-classification give the correct predictions and those off are the incorrect predictions. In the study of the cases identified, 66 out of 83 customers are classified correctly. Correspondingly 17 out of 25 customers who will not buy again are classified correctly. Overall 78% of the training cases are classified accurately corresponding to the 22% incorrect shown in the model summary table 3. Sometimes the classifications based on the cases identified in the model are too inflated. In order to overcome this, the testing sample helps to validate the model. The overall percent in the testing sample stood at 84.4%, which explains that the model is accurate and is in fact correct about three out of four times. Therefore, the prediction accuracy is validated for the model.
| Table 3 Calculated Indicators of the Testing Sample | ||
| Indicators | Calculation | Result % |
| Accuracy | (TP+TN)/(TP+FP+FN+TN) | 93.54 |
| Positive predictive value | (TP)/(TP+FP) | 96 |
| Negative predictive value | TN/(TN+FN) | 83.33 |
| Recall or sensitivity | TP/(TP+FN) | 96 |
| Specificity | TN/(TN+FP) | 83.3 |
| F1 score | (2*PPV*RECALL)/(PPV+RECALL) | 96 |
The Table 3 explains the different fit indices to measure the strength of the model. Accuracy is a strongest indicator for reflecting the model’s quality of prediction. The model prediction of accuracy is 93.54%, indicating how often the model is correctly predicted. Thus the model predicts the customers as either repurchase or will not repurchase with nearly 94 percent accuracy. Hence out of 100, predictions are nearly correct to 94 times. Precision is the other indicator to examine the positive predictive cases of the model. The model has a high precision of 96%. Recall or sensitivity explains the model’s strength to correctly identify customers who will repurchase or real positive cases which are correctly predicted positive. Thus with a recall value of 96% the current model has a potential of identifying the customers who will repurchase in online.
Specificity is the other index which signifies when a customer will not repurchase and the model has correctly predicted it. It examines the goodness of a model in avoiding false alarms. Thus the present model has an 83% of specificity value, indicating the goodness of model in correctly identifying the customers who will not repurchase on online.
In order to check the accuracy, F1 score is used to measure the accuracy of the model. F1 is computed based on the harmonic mean of precision and sensitivity value. The bench mark scores of F1 are 1 and 0 indicating the best and worst scores respectively. The calculated value of the F1 score is 096 which is near to 1, thus measuring the goodness in explaining the predictive accuracy. Therefore, all the six indices of the study explicate the predictive strength of the model developed is a good model.
ROC Curve
The Receiver Operating Characteristic (ROC) curve helps to show the sensitivity and specificity in a single plot for all potential cutoffs, which is much simpler and more efficient than a set of tables. The graph includes two lines, one for the ‘No’ category and one for the ‘Yes’ category. Category ‘Yes’ indicates the customers will buy again online and Category Y indicates the customers will not buy again online. Since there are only two types, the curves from the top left corner of the panel to the bottom right are symmetrical about a 45-degree axis as shown in the figure 2. The more the curve moves away from the average of 45 degrees, the better is the classification. Since both the curve of Yes category and No category are moving away from the 45 degrees, the network model prediction is more accurate.

Figure 2 ROC Curve
Predicted by Observed Chart
The predicted-by-observed graph displays clustered boxplots with expected pseudo-probabilities for the composite training and testing samples with categorical dependent variables. The x-axis corresponds to the categories of response observed, and the legend corresponds to the categories predicted. Figure 3 displays box plots with pseudo-probabilities predicted. The chart shows box plots that label the expected pseudo-probabilities based on the entire dataset for the dependent variable course result. The boxplot portion on the y-axis above with the value above the 0.5 mark reflects the correct predictions as shown in the table of classification. Incorrect predictions are the portion with the value below the 0.5 limits.

Figure 3 Predicted by Observed Chart
The first boxplot from the left shows the experienced customers expected probability of being in the Yes category. The second box shows the probability of classifying a customer in No category. The third boxplot displays the group Yes's expected chance.
The right boxplot indicates the risk of a customer not buying online again, classified as No category. Looking at the diagram, it seems that the Yes category was accurately predicted with above the 0.5 marks whereas the No category was closer to the 0.3 cut-off point respectively.
Independent Variable of Importance
An independent variable's significance is a function of how much the predicted- model output of the network varies with the different independent variable values. Normalized importance of the independent variable is calculated by taking the importance values divided by the largest importance values and expressed as percentages. The graph of importance is essentially a bar chart of the values in the table of priority, ordered by the value of significance. From the chart in the figure 4 it is apparent that variables related to customer repurchase in online, e-satisfaction and responsiveness of the e-commerce companies have the greatest effect on customer repurchase. Further customers who had trust and loyalty on the e-commerce platform also has an impelling influence on customer repurchase than ease of use and web design variable.

Figure 4 Independent Variable Importance Chart
Findings and Discussions
Over the years several statistical models have been developed in the advanced fields of analytics, pattern recognition, and machine learning. A neural network model is a significant predictive analytics tool for analyzing the non-compensatory decision making of online customers. This classification method is one of the most widely used methods for the study of the nonlinear interaction between elements. A study by Chiang et al., (2006) have reported that the neural network has more dominance over logistic regression models in terms of predicting capacity.
The word accuracy associated with the classification matrix is the right fraction of the total number of predictions. It represents how accurate is the model. The neural network approach provided 84.4 percent accuracy for the current study. Therefore, more than 9 out of 10 model-based predictions are accurate. It suggests that 84.4 percent of e-shoppers are accurately identified by the neural network model as either will repurchase or will not repurchase. An independent variable's significance is a function of how much the model-predicted output of the network varies with different independent variable values. Normalized significance is essentially the qualities of interest separated by the highest values and expressed as percentages. E-Satisfaction, responsiveness of the companies, trusts, loyalty and reliability among the e-shoppers have a strong compelling influence of model predictive power on customer repurchase.
Many retailers have changed their attention more than ever to target younger generation of shoppers. Although millennial have been the target consumer in recent years, the market is rapidly changing towards Gen Z shoppers. The least influential factor of the study is web design (30.5%), which explains on layout, comprehension and visual appeal of the website. Despite large online stores changing the game, the demands of Gen Z have risen and retailers are no longer able to get away from distribution systems or the basic web design. Next, ease of use of the shoppers from the website and assurance of the companies in terms of refunds, guaranteed offers and feeling secured while shopping affects the Gen Z shoppers moderately (51 percent). Reliability factors among the Gen Z shoppers also have a better influence (61.1 percent) on customer repurchase. It explains trustworthy of the products, providing the service as promised, and good product quality are the predominant reasons for the reliability of Gen Z. Responsiveness in the second-ranked predictor variable of importance (75 percent) followed by trust and loyalty factor. Gen Z shoppers expect prompt services when ordered online and anticipate online retailers to respond quickly to any queries or product grievance issues raised as this strongly enhances them to repurchase again. From the study among all other independent variables, satisfaction has a 100 percent normalized variable of importance than the other predictor variables in the study.
Conclusion
The present study is one of the endeavor using artificial neural networks to predict the inevitable factors that end up in on-line shopping behavior towards customer repurchase. A multilayer neural perceptron network was equipped with a back-propagation algorithm to determine whether customers will buy again in online. The classification accuracy rate was very high, with 84.4 percent accuracy predicting the customer's behavior on repurchase. Also from the independent variable of importance, it is apparent that e-satisfaction and responsiveness are the strongest predictors in online buying of customer repurchase among the Gen Z customers. Even though the customers preferred to buy online for various reasons, the customer inclination to repurchase on the website depends much on the satisfaction based on the past experience. Therefore, online retailers have to be aware of meeting the customers’ expectations of their service rendered.
The research findings should be viewed with apprehension just because of a few limitations. The research has a drawback to the degree that it has deemed a sample of only postgraduate students which may not be universally applicable. Then there is a scope for more predictors to be included for future research. Next, the study is limited to digital natives that are Gen Z customers. Therefore, there is more scope for conducting a similar study among other groups of online shoppers. The research was eventually formulated, taking into account the population living in India. In examining the predictive model, the study failed to take into account any specific product category. Future research could include the effect of e-shoppers on different product categories. Thus the studies to be taken in the future may formulate a more comprehensive structure by resolving the existing limitations of the current study.
References
Bansal, H.S., & Taylor, S.F. (1999) ‘The Service Provider Switching Model (SPSM): A Model of Consumer Switching Behavior in the Service Industry’, Journal of Service Research 2(2): 200–18.
Indexed at, Google Scholar, Cross Ref
Cai, S., & Jun, M. (2003) ‘Internet Users’ Perceptions of Online Service Quality: A Comparison of Online Buyers and Information Searchers’, Managing Service Quality 13(6): 504–19.
Indexed at, Google Scholar, Cross Ref
Chiang, W.K.D. Zhang, & Zhou, L. (2006). Predicting and explaining patronage behavior toward web and traditional stores using neural networks: A comparative analysis with logistic regression, Decision Support Systems 41: 514-531.
Indexed at, Google Scholar, Cross Ref
Dabholkar, P.A. (1996) ‘Consumer Evaluations of New Technology-based Self-service Options: An Investigation of Alternative Models’, International Journal of Research in Marketing 13(1): 29–51.
Indexed at, Google Scholar, Cross Ref
Engelbrecht, A.P., and I. Cloete. (1996). A sensitivity analysis algorithm for pruning feed forward neural networks, In IEEE International Conference in Neural Networks 1: 1274-1277
Fry, R., & Parker, K. (2018). Post-Millennial’ Generation on Track to Be Most Diverse, Best-Educated. (online) Pew Research Center’s Social & Demographic Trends Project. Available at: http://www.pewsocialtrends.org/2018/11/15/early-benchmarks-show-post-millennials-on-track-to-be-mostdiverse-best-educated-generation-yet/ [Accessed 17 Nov. 2019].
Gefen, D., & Straub, D.W. (2002) ‘The Relative Importance of Perceived Ease of Use in IS Adoption: A Study of e-Commerce Adoption’, Journal of the Association for Information Systems 1(8): 1–28.
Gummerus, J., Liljander, V., Pura, M., & Van Riel, A. (2004) ‘Customer Loyalty to Content-based Websites: The Case of an Online Health Care Service’, Journal of Services Marketing 18(3): 175–86.
Heijden, H., Verhagen, T., & Creemers, M. (2003). Understanding online purchase intentions: contributions from technology and trust perspectives. European Journal of Information Systems, 12(1), 41-48.
Hruschka, H. (1993). Determining market response functions by neural network modelling: A comparison to econometric techniques, European Journal of Operational Research 66(1), 27–35.
Indexed at, Google Scholar, Cross Ref
Jones, R. (2017). Why do people skip online video ads? | Smart Insights. [Online] Smart Insights. Available at:https://www.smartinsights.com/internet-advertising/internet-advertising-strategy/people-skip-online-videoads/ [Accessed 19 Nov. 2018].
Kassim, N., & Nor A. Abdullah. "Customer Loyalty in e-Commerce Settings: An Empirical Study." Electronic Markets, vol. 18, no. 3, 2008, pp. 275-290.
Koenig?Lewis, N., Palmer, A., & Moll, A. (2010). Predicting young consumers' take up of mobile banking services. International journal of bank marketing.
Indexed at, Google Scholar, Cross Ref
Moorman, C., Deshpande, R., & Zaltman, G. (1993) ‘Constructs Affecting Trust in the Market Research Relationships’, Journal of Marketing 57(1): 81–101.
Morgan, R.M., & Hunt, S.D. (1994) ‘The Commitment Trust Theory of Relationship Marketing’, Journal of Marketing 58(7): 20–38.
Indexed at, Google Scholar, Cross Ref
Mundorf, N., & Bryant, J. (2002). Realizing the social and commercial potential of interactive technologies. Journal of Business Research, 55(8), 665-670.
Indexed at, Google Scholar, Cross Ref
Perlstein, J. (2017). Engaging Generation Z: Marketing to a New Brand of Consumer. (Online) Adweek.com. Available at: https://www.adweek.com/digital/josh-perlstein-response-media-guest-post-generation-z/[Accessed 10 Nov. 2019].
Ranaweera, C., & Prabhu, J. (2003) ‘The Influence of Satisfaction, Trust and Switching Barriers on Customer Retention in a Continuous Purchasing Setting’, International Journal of Service Industry Management 14(4): 374–95.
Indexed at, Google Scholar, Cross Ref
Reibstein, D.J. (2002) ‘What Attracts Customers to Online Stores, and What Keeps Them Coming Back? Journal of the Academy of Marketing Science 30(4): 465–73.
Indexed at, Google Scholar, Cross Ref
Sterling, G. (2017). Move over millennials, Gen-Z now the largest single population segment – Marketing Land. (Online) Marketing Land. Available at: https://marketingland.com/move-millennials-gen-z-nowlargest- single-population-segment-219788 [Accessed 1 Nov. 2019].
Tsaih, R. (1999). Sensitivity analysis, neural networks, and the finance. In Neural Networks, International Joint Conference on IEEE 6
Twenge, J. (2017). I Gen: why today’s super-connected kids are growing up less rebellious, more tolerant, less happy – and completely unprepared for adulthood. New York: Atria Books
Voss, C. (2000) ‘Developing an e-Service Strategy’, Business Strategy Review 11(1): 21–33.
Verhagen, T., & Van Dolen, W. (2009). Online purchase intentions: A multi-channel store image perspective. Information & Management, 46(2), 77-82.
Wu, J.H., & Wang, S.C. (2005), “What drives mobile commerce? An empirical evaluation of the revised technology acceptance model”, Information & Management, 42(5), 719-729.
Indexed at, Google Scholar, Cross Ref
Wolfinbarger, M.F. and Gilly, M.C. (2003) ‘EtailQ: Dimensionalizing, Measuring and Predicting Detail Quality’, Journal of Retailing 79(3): 183–98.
Yang, Z., Peterson, R.T., & Cai, S. (2003) ‘Services Quality Dimension of Internet Retailing: An Exploratory Analysis’, Journal of Services Marketing 17(6/7): 685–700.
Yoon, S.J. (2002). The antecedents and consequences of trust in online?purchase decisions. Journal of Interactive Marketing, 16(2), 47-63.
Indexed at, Google Scholar, Cross Ref
Zeithaml, V.A., Parasuraman, A., & Malhotra, A. (2002) ‘Service Quality Delivery through Websites: A Critical Review of Extant Knowledge’, Journal of the Academy of Marketing Science 30(4): 362–75.
Indexed at, Google Scholar, Cross Ref
Received: 03-Jan-2022, Manuscript No. AMSJ-22-11247; Editor assigned: 05-Jan-2022, PreQC No. AMSJ-22-11247(PQ); Reviewed: 19-Jan-2022, QC No. AMSJ-22-11247; Revised: 22-Jan-2022, Manuscript No. AMSJ-22-11247(R); Published: 25-Jan-2022