Research Article: 2025 Vol: 29 Issue: 5
Predictive Inventory Management using Data Mining in the Retail Sector
Nishant Agrawal, IBS Ahmedabad
Ankur Roy, Management Development Institute Gurgaon
Nitin Kr. Saxena, Jaipuria School of Business, Ghaziabad
Priyanka Jain, IBS Ahmedabad
Citation Information: Agrawal, N., Roy, A., Saxena, N.K., & Jain, P. (2025). Predictive inventory management using data mining in the retail sector. Academy of Marketing Studies Journal, 29(5), 1-13.
Abstract
Market Basket Analysis (MBA) is a retail organizational data mining method to determine product location and build sales promotion campaigns for different customer groups to enhance customer satisfaction and supermarket profitability. MBA aims to create a significant association between the group of products or categories. Here, in this study data mining approach has been proposed that uses customer visit segments sales data of 9835 and identified the rules, which predict the frequency of purchase of an item. As per the author’s knowledge, this is the first attempt to explore this evolving area of the retailing problem using data mining.
Keywords
Market Basket Analysis, Retail, Inventory Management, Data Analytics, Retail Management.
Introduction
Retailing is a key industry worldwide, playing a crucial role in driving developed economies and providing growth opportunities for developing nations (Williams, 1997; Mishra et al., 2024). For decades, retail chains sold products without leveraging sales transaction data as a knowledge source for decision-making. However, in recent years, many companies have begun utilizing transactional data to extract valuable insights. Agrawal et al. (1993) highlighted how companies were accumulating increasingly large sales databases, prompting the development of the Apriori algorithm (Agrawal & Srikant, 1994; Chen et al., 2024) to handle such extensive datasets. Most businesses are using advanced software such as ERP, MRP, data warehouse, etc to improve efficiency. Such technological advancement creates complex algorithms that mine interesting information from a large amount of data (Krichen et al., 2024). Retail organizations started using multiple approaches such as market basket analysis (MBA); self-organizing maps; and K mean clustering to find meaningful insights (Kohonen, 1990; Hoque et al., 2024; Jamil et al., 2024). The MBA approach has been widely used in retail organizations to promote products, investment management, and other operations. The main objective of this study is to find customer buying behavior patterns from point of sales data that can be used by top management. There are two important elements antecedent ("if") and consequent ("then") in the association rules. An item that is present in the data set is called an antecedent whereas an item that is linked with the antecedent is called a consequent. It has been found in research that inventory carrying costs typically represent 25–30% of the value of inventory in stock for an average company (Ted Hurlbut, 2004). For a typical Fortune 1000 firm, even a modest savings of 5% in inventories can generate an extra $20 million in profits (Eric Leclair, 2005).
IBM Corporation's (2012) study emphasizes the efficiency of IBM SPSS MBA software, which helped the Brammer Group, a top European distributor of technical components for maintenance, repair, and overhaul, reduce inventory levels by 22%. This reduction led to cost savings of £31.1 million within a year, with inventory turnover improving from 3.2 to 3.7 times. MBA proves to be a powerful data mining technique for managing inventory levels, boosting sales through promotional strategies, and implementing cross-sales campaigns for specific stock-keeping units (SKUs). Decisions concerning individual SKUs influence not only their sales but also the sales of other products (Ma et al., 2012). But in reality, taking into account all possible interactions to make the best decisions may be very difficult (Gooner et al., 2011). Our evaluation results indicate that our approach performs better than the traditional ones. The evaluation results illustrate that our approach dramatically outperforms traditional approaches.
The paper's structure is as follows: Section 2 gives the literature review. After the research methodology in Section 3. Section 4 is the theoretical framework of the MBA followed by findings of the study, accompanied by sophisticated graphical presentations in section 5. Finally, Section 6 wraps up the paper by recapitulating the research contribution, mentioning its limitations, and proposing future research directions. Particular emphasis is put on various Apriori algorithm variations, enriched with state-of-the-art graphical charts to provide profound and meaningful insights.
Literature Review
There is a wealth of literature available on association rule mining algorithms, each offering varying levels of mining efficiency. Notable algorithms include K-Means (Liu et al., 2014), Naïve Bayes (Kamruzzaman and Rahman, 2010), Apriori (Agrawal and Srikant, 1994), Eclat (Kumar et al., 2024), K-Apriori (Annie and Kumar, 2011), FP Growth (Ali & Priscila 2024), and K-Nearest Neighbor (Dubey et al., 2021). Such kinds of algorithms are divided into two parts pattern growth and candidate generation. Apriori algorithm is considered to be one of the most powerful association rules in data mining. Such an algorithm is useful in frequent itemset mining and it learns from large datasets. However, high memory usage due to a large dataset; and inadequacy due to low support values are drawbacks of the Apriori algorithm (Rao and Gupta, 2012). Despite this weakness, such an algorithm remains important in data mining. To overcome to limitations and enhance the performance of the Apriori Algorithm there are many improvements reported in academic literature. Some of the important advancements include mining association rules with multiple minimum support thresholds; and new parameters to maximize profitability (Liu et al., 1999; Alawadh & Barnawi 2022). Ultimately this improves the performance of association rules that solve shortcomings Algorithm. However, Bhandari et al. (2015) proposed utilizing the Improvised Apriori Algorithm with a frequent pattern tree for real-time applications. Such an approach will reduce the calculation time required to solve huge customer datasets while saving memory by removing redundant association rules. Such improvements make algorithms more practical and efficient for large organizations generating huge datasets. The Secure Mining of Association Rules, based on the Fast Distributed Mining Algorithm, is regarded as an enhanced version of the Apriori Algorithm designed to improve performance (Tassa, 2014). Adaptive Implementation of the Apriori Algorithm proposed by Balaji and Rao (2013) also meaningfully decreases response time by optimization. The approach given by Waduge et al. (2016) and Samaraweera et al. (2014) used profit as a key variable that calculates profit margins based on the number of transactions as compared to the minimum support constraint. Such advancement increases the reliability of the Apriori Algorithm and creates more robust and efficient data mining.
There are various numerous extensions of the Apriori Algorithm have been proposed in the literature such as hybrid optimization modeling; algorithmic improvements; quantitative, spatial, inter-transactional, temporal association, multi-level and generalized and fuzzy rules, etc. (Ishibuchi et al. 2001; Kuok, et al. 1998; Lu, et al 2000; Padmanabhan et al., 2003; Lee, et al. 2001; Liu et al. 2002; Park et al. 1997; Srikant, et al. 1996; Wijsen, et al. 1998; Clementine et al. 2000; Han et al. 1999; Alawadh & Barnawi 2022).
Hoque et al., (2024) have suggested an implementation of data mining methods to a chosen business firm with special reference to purchasing behavior. Kim et al. (2012) investigated a transaction dataset from an L department store in Korea which included 68,573 transactions in which 255 products were bought by 3533 customers during 2007. Customer data involve grade, gender, birthday, and customer address. Product details consist of product subclass, product ID, and class product.
Videla-Cavieres and Ríos (2014) conducted a study comparing two different types of retail stores. Retail A operates as a wholesale supermarket catering to grocery store owners, whereas Retail B is affiliated with one of Chile’s largest retail holdings. Data collection for Retail A spanned 30 months, encompassing approximately 238 million transactions, 160 thousand customers, and over 11 thousand SKUs. In contrast, Retail B’s data was gathered over two months, including 128 million transactions, nearly 2 million customers, and 31 thousand unique SKUs. This study focuses on applying association rule data mining techniques in MBA within a multi-store environment, large database networks, and using fast algorithms. (Gupta, et al. 2014). This research aimed to identify the strategy of product arrangement by which the profit of supermarkets may increase.
Methodology
According to Sajwan & Tripathi (2024), several measures can be employed to identify association patterns. Typically, three primary indices—lift, support, and confidence—are utilized to evaluate the existence, characteristics, and strength of an association rule or metric (Linoff et al., 2004; Kumar et al., 2024). These three indexes provide complementary, non-redundant information, each contributing unique insights into the effectiveness and relevance of the association rules.
Support
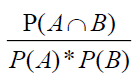
Support is also equal to P(A ∩ B) and is presented as a percentage value between 0 and 100. Support is the probability that A and B occur simultaneously, or in other words, the percentage of transactions in the database with all the items present in the antecedent and consequent of the rule. However, the Support index has some limitations, particularly when dealing with enormous and complex sets of data, i.e., millions of transactions or thousands of items (Cohen et al., 2001). In such scenarios, support values may be relatively low, as other transactions can introduce noise, diminishing the metric's significance. Very low Support values may also be meaningless, as they often fail to provide any significant insight into customer behavior. For instance, an association rule like "customers who buy computers also tend to buy financial management software" might not be meaningful if the support for this rule is extremely low, as it may not accurately reflect actual consumer purchasing patterns (Malik et al., 2024).
Computer -> financial management software
Support = 10%; confidence = 70%
A Support value of 10% on an association rule indicates 10% of all of the transactions within the dataset to indicate computers and financial management software are bought together. By contrast, a Confidence value of 70% would mean that 70% of customers buying a computer also bought the software. This illustrates the strength and probability of the association between the two items in the dataset.
Confidence
Like Support, Confidence is also expressed as a percentage between 0 and 100 and is calculated as P(A ∩ B) / P(A). It indicates the likelihood that a specific set of items will appear, given that another set has already occurred. A major advantage of Confidence is its reliability, even in large and complex datasets, whereas Support may lose significance in such cases. Confidence is not influenced by the size or richness of the dataset, as it only considers transactions that involve both A and B. In other words, if item A is selected, Confidence helps to determine the probability that item B will be selected as well.
The confidence value of an association rule is typically higher than its support since it is derived by dividing the support by P(A). Therefore, even when multiple association rules share the same support values, they can be highly disparate in terms of confidence values. Confidence is therefore superior to support in revealing disparities in association rule strengths. Another theoretical usefulness of confidence lies in the development of causal theories. Confidence can be measured in two ways: (a) the conditional probability of A given B and (b) the conditional probability of B given A. These two confidence values can differ significantly, especially when the frequency of A is much higher (or lower) than that of B (Gu et al., 2003). For example, if P(A ∩ B) / P(A) is 85% while P(A ∩ B) / P(B) is only 10%, a researcher might conclude that A is more likely to lead to B rather than the other way around (Banerjee et al., 2024). In this case, support indicates how frequently the patterns in the rule occur, while confidence measures the strength of the association. As a result, rules with high confidence and substantial support are considered strong rules. However, one limitation of the confidence measure is that it lacks a baseline frequency for the consequent of the rule, making it challenging to evaluate the interestingness of association rules in isolation.
Lift
A couple of years afterward, when association rules were defined, researchers such as Aggarwal & Yu (1998) and Silverstein et al. (1998) refuted the weaknesses of the confidence measure by considering the baseline frequency of the consequent. The lift (or interest) measure was thus defined. Lift is defined as
The denominator presumes A and B are independent, while the numerator presumes, they are related. If the numerator and denominator are comparable, then the lift will be near 1, meaning the association between A and B is random. Therefore, lift tends to eliminate association rules with lift close to 1 (Baralis et al., 2011). A lift value greater than 1 signifies a positive relationship between A and B, whereas a value below 1 indicates a negative relationship. Although several methods exist to evaluate the statistical significance of association rules (Alvarez, 2003), lift is widely preferred (Linoff et al., 2004) due to its greater interpretability. However, there are two significant limitations to the lift measure (Kumar et al., 2024). First, sampling variability may become an issue— for low values of absolute support, lift may change remarkably with minor variations in the absolute support of a rule. Second, the lift statistic will be larger for large itemsets than it will be for small itemsets. This occurs due to the condition independence assumption in the denominator, which makes the value of the denominator reduce faster than the numerator with an increase in the number of items in the itemset. Consequently, lift may overestimate large itemsets' interestingness.
Chi-square Test
The relationship between the antecedent and consequent of an association rule is typically evaluated using the Chi-square test for independence. (Silverstein et al., 1998). The benefit of the chi-square measure is that it captures all information that is present on whether items co-occur or not as combinations, and lift will only capture a measure of the sheer co-occurrence of two item sets. Therefore, if the lift is close to 1 but the counts are large, or if the lift is significantly different from 1 but the counts are low, the Chi-square test should be used to verify the statistical dependence between the events. The Chi-square test also tends to produce larger values as the dataset grows, making it a useful tool for large datasets. Aguinis et al., (2013) suggest the following steps for utilizing association rules effectively:
1. Lift as the Primary Metric: Lift is a crucial metric as it identifies the presence of an association and determines whether the relationship is positive or negative. It operates similarly to statistical significance testing in conventional analyses. Therefore, lift should be calculated first. If the lift value is close to 1, this indicates that the association may be explained by chance, and a statistical Chi-square test should be conducted to verify if the events are statistically dependent.
2. Support Calculation: Lift showcase there is an association rule however support shows the frequency of the item occurs in the transactions in the database.
3. Confidence and Effect Size: Support should be calculated before confidence calculation because support shows an initial measure of the significance of the rule
The two main objectives of this research are to find frequent items from the transaction database with the help of support and confidence and proposed association rules from the frequent items identified.
Market Basket Analysis (MBA)
MBA, or association rule mining, is an effective data mining method that detects patterns of buying behavior from vast transactional datasets (Srikant & Agrawal, 1995). MBA has the principal application of ascertaining the product pairs bought repeatedly, which presents useful insights to retailers on making the best positioning of their merchandise, promoting activities, and promotional strategies (Chen et al., 2005). Gradually, numerous expansions and improvements in this technique have been proposed and it has become extensively used throughout different industries including retail, telecom, finance, and others (Chen et al., 2005).
The Apriori Algorithm is one of the most widely used methods for generating association rules in MBA. It is highly valued for its effectiveness in identifying frequent itemsets and establishing association rules, particularly in the retail industry. (Annie & Kumar, 2011; Raorane et al., 2012). Generally, association rules are considered to be useful if they satisfy two important requirements: they should pass a minimum support requirement and a minimum confidence requirement. These requirements are generally established by analysts or domain specialists depending on the context of the analysis. The uses of association rule mining have been widespread and varied.
It has been used effectively for various applications, such as product selection decisions profit mining, MBA, and even in the credit card business (Wong et al., 2003; Mishra et al., 2024; Wu et al., 2005; Linoff et al., 2011). Russell et al. (1999) emphasized the way MBA has permitted marketing researchers to develop theoretical models that embody the richness of purchasing decisions related to products belonging to more than one category. For retailers, knowing the needs of customers and how to respond to evolving preferences is crucial. MBA gives clues about which products will be bought together, providing useful information that can be used to create effective sales policies. Perhaps the most celebrated use of MBA is the Wal-Mart example, where association rule mining uncovered a surprising relationship: beer and diapers are bought together (Widjaja 2024). This revelation came as a surprise to many but also presented potential cross-selling opportunities, wherein retailers could offer these products together or position them in close vicinity of one another. This study adopts the data mining technique of association rules due to its efficiency in uncovering hidden relationships within large datasets (Liu & Shih, 2005). One of the most intriguing association rules derived from MBA is the rule: {Diapers} → {Beer}. This association is considered particularly interesting because it is unexpected, leading to new business opportunities, such as cross-promotions and targeted marketing. By leveraging the power of MBA, retailers can uncover such surprising relationships and capitalize on them to enhance their business performance (The Register, 2006).
Research Data
For this algorithm, the dataset employed is the Groceries dataset, consisting of one month's real point-of-sale data from a typical local grocery store. The dataset contains 9,835 transactions, with products grouped into 169 categories, and a density of 0.026, as supplied by Hahsler et al. (2006). The density value of 0.026 indicates that only 2.6% of the cells in the matrix contain non-zero values. On average, each transaction consists of 4.409 items. Notably, 2,159 transactions involve the purchase of just a single item, while the maximum number of items bought in a transaction is 32. Some of the most frequently purchased itemsets in the dataset include:
• Whole milk: 2,513 transactions
• Other vegetables: 1,903 transactions
• Rolls/buns: 1,809 transactions
• Soda: 1,715 transactions
• Yogurt: 1,372 transactions
These itemsets provide valuable insights into customer purchasing patterns, helping to uncover associations between products that can drive effective marketing strategies and inventory management.
Discussion
To enhance the sales of non-promoted items, for which the margin is very low for the seller, it should be sold with promoted items which could be an effective sale promotion strategy. In this way, non-promoted can be identified from the rule. Some of the interesting rules are mentioned in Table 1. It shows that if a customer purchases chicken, then he/she will purchase whole milk with a confidence of 40.9% and support of 1.7%. Lift is 1.6 meaning that customers are 1.6 times more likely to buy chicken and whole milk altogether than buy them separately. Similarly, if the customer purchases vegetables and whole milk then he/she will purchase bottled beer with a confidence of 10.1% with support of 0.7% which means there are some chances that if men purchase vegetables, and whole milk for their home then they may purchase bottle beer but chi-square value 0.101 shows that this purchase may be due to chance. Likewise, if men purchase hamburger meat or whole milk then also he will surely purchase bottled beer as the chi-square value is 0.0206 which suggests this purchase is not due to chance Table 1.
| Table 1 Interesting Arules Rules | ||||||
| Antecedent | Consequent | Support | Confidence | Lift | Count | Chi-Square |
| Chicken | whole milk | 0.017 | 0.409 | 1.6 | 173 | 0.004 |
| whole milk | bottled beer | 0.020 | 0.079 | 0.99 | 201 | 0.000 |
| hamburger meat, whole milk | bottled beer | 0.001 | 0.117 | 1.4 | 17 | 0.101 |
| Other vegetables, whole milk | bottled beer | 0.007 | 0.101 | 1.2 | 75 | 0.026 |
Using a support threshold of 0.001 and a confidence level of 0.5 with the Apriori algorithm yields a total of 5,668 results. These are chosen levels to produce a large number of association rules but would be lower if either the support or confidence threshold was raised. It is recommended to experiment with different threshold values to find the most appropriate ones based on the specific use case or objective of the analysis.
Given the large number of generated rules, it may not be feasible to examine each rule independently. Therefore, we can focus on the five rules with the highest lift. These rules, with high lift values, represent stronger and more interesting associations that are unlikely to occur by chance, making them ideal candidates for further analysis and decision-making Table 2.
| Table 2 Five Rules with the Largest Lift | |||
| Rules | Support | Confidence | Lift |
| Instant food products, soda => hamburger meat | 0.001 | 0.632 | 19.00 |
| Soda, popcorn => salty snacks | 0.001 | 0.632 | 16.70 |
| Flour, baking powder => sugar | 0.001 | 0.556 | 16.41 |
| Ham, processed cheese => white bread | 0.002 | 0.633 | 15.05 |
| Whole milk, instant food products => hamburger meat | 0.002 | 0.500 | 15.04 |
A graphical representation of different rules is shown in Figure 1-5. Figure 1 shows 1255 rules using the scatter plot method with min support of 0.001 and min confidence of 0.7. As we decrease the value of the support measure, several rules will be increased. We visualized the rules by plotting confidence, support, and lift in Figure 1, illustrating the relationship between these key metrics. The “support-confidence boundary” creates an optimal rule for the meaningful interpretation of obtained data. On the right side of a scatter plot diagram obtained from that rule, chances of either support, confidence or both may be higher.

Figure 1 A Scatter Plot for 1255 Rules

Figure 2 Graph for 19 Rules

Figure 3 Grouped Matrix for 19 Rules

Figure 4 Larger Group Name in the Dataset

Figure 5 Total Products Available with more in-Depth Segmentation
Apart from a scatter plot visualization to identify the rule, the graph-based visualization is more recommended. The darker the circle the more the probability of purchasing two of the selected items than anything else whereas the bigger circle indicates the probability of purchasing both items together. Figure 2 arrow indicates the direction of a possible basket.
An improved way to present is a Grouped matrix plot shown in Figure 3. It has the same rules before, but additionally, it shows the support of the rules. It can be noted that rules linked with sausages have the most significant support among the listed.
Treemap charts are one of the most advanced tools to represent product segmentation shown in Figure 4,5 and have a different level of depth. Figure 4 shows the bigger group names of categories and Figure 5 shows more in-depth segmentation with available products. With the help of interesting plots, we can analyze data in detail to show how many products of each type are available to buy in the grocery store.
Implications
MBA using data mining enables retailers to optimize inventory by identifying frequently purchased itemsets, leading to better stock allocation and reduced holding costs. By uncovering product associations, businesses can implement strategic pricing and cross-selling strategies, increasing sales of both promoted and non-promoted items. Understanding consumer purchasing patterns allows for targeted marketing efforts, personalized promotions, and customized product placements, enhancing customer satisfaction. Advanced algorithms, such as the Apriori Algorithm and its variations, streamline data processing, helping businesses make data-driven decisions on product arrangement and marketing strategies. Effective application of MBA can lower operational costs by reducing inventory waste, improving demand forecasting, and minimizing stock shortages or overstock situations. The adoption of sophisticated data mining techniques, including graph-based visualizations and machine learning approaches, improves analytical capabilities in large retail datasets. The research highlights that MBA techniques are applicable across various retail sectors, making them a scalable and adaptable solution for businesses of different sizes.
Conclusion
MBA is a powerful tool for retailers seeking to gain insights into the associations between products that customers purchase together. Various techniques and tools can be applied when conducting MBA, with one of the main challenges being the proper selection of confidence and support thresholds for the Apriori algorithm, and identifying the most relevant rules to apply. This typically involves evaluating the rules using metrics that assess their strength and interest, often through advanced visualization techniques. Ultimately, the significance of MBA lies in its ability to extract valuable insights from transaction datasets, helping retailers better understand consumer needs and behavior, which can inform more effective business strategies and decisions. This research paper focuses on proposed meaningful algorithm association rules which may significantly increase the profit gain and maintain an inventory level of retail organizations. In this paper, we found some of the interesting rules like vegetables, whole milk with bottled beer chicken with whole milk, etc. which gives more insights to retailers for marketing activities such as cross-selling or targeted campaigns. MBA is often an initial study intended to identify patterns. Once the pattern is detected, it can be discovered more thoroughly through other methods such as regression, neural network or decision trees. The limitation of the current study is that we have used the lift, support, confidence and statistically checked by chi-square only to assess the rules but different metrics get much more meaningful insights. We have used retail data, in the future researchers can use some different datasets or can change the sector to find meaningful insights. While MBA provides valuable insights, reliance on lift, support, and confidence measures alone may not fully capture complex purchasing behaviors. Future research can incorporate alternative statistical and machine learning techniques for deeper insights. The truthful application of obtaining knowledge from this study may be helpful for retailers to sell merchandising goods strategically.
References
Aggarwal, C. C., & Yu, P. S. (1998) “A new framework for itemset generation” In Proceedings of the seventeenth Acm Sigact-Sigmod-Sigart symposium on Principles of database systems, pp. 18-24.
Indexed at, Google Scholar, Cross Ref
Agrawal, R., & Srikant, R. (1994) “Fast algorithms for mining association rules”, In Proceedings of 20th international conference on very large data bases, VLDB, pp. 1– 32
Agrawal, R., Imieliński, T., & Swami, A. (1993) “Mining association rules between sets of items in large databases” Proceedings of the ACM SIGMOD Conference on Management of Data , Vol. 22, No. 2, pp. 207-216
Agrawal, R., Imielinski, T., & Swami, A. (1993). “Database mining: A performance perspective.” IEEE Transactions on Knowledge and Data Engineering, Vol 5 No 6, pp. 914–925
Aguinis, H., Forcum, L. E., & Joo, H. (2013) “Using Market Basket Analysis in Management Research” Journal of Management, Vol 39, No 7, pp.1799–1824.
Alawadh, M. M., & Barnawi, A. M. (2022). A survey on methods and applications of intelligent market basket analysis based on association rule. Journal on Big Data, 4(1).
Ali, A. A., & Priscila, S. S. (2024). Short Time Comparison of Item Sets With Market Basket Analysis Using Frequent Pattern (FP) Growth Method. In Explainable AI Applications for Human Behavior Analysis (pp. 111-124). IGI Global.
Alvarez, S. A. (2003). “Chi-squared computation for association rules: preliminary results” Boston, MA: Boston College
Annie M.C.L.C., Kumar D.A., (2011) “Frequent Item set mining for Market Basket Data using K-Apriori algorithm”, International Journal of Computational Intelligence and Informatics, Vol 1, No. 1, pp.14-18
Balaji, M., & Rao, G. S. V. (2013) “An adaptive implementation case study of apriori algorithm for a retail scenario in a cloud environment”. Cluster, Cloud and Grid Computing (CCGrid), 2013 13th IEEE/ACM International Symposium , pp. 625-629
Banerjee, A., Nobleza, K., Haddad, C., Eubanks, J., Rana, R., Rider, N. L., ... & Anvari, S. (2024). Applying Market Basket Analysis to Determine Complex Coassociations Among Food Allergens in Children With Food Protein-Induced Enterocolitis Syndrome (FPIES). Health Services Research and Managerial Epidemiology, 11, 23333928241264020.
Baralis, E., Cagliero, L., Cerquitelli, T., Garza, P., & Marchetti, M. (2011) “CAS-Mine: providing personalized services in context-aware applications by means of generalized rules”, Knowledge and information systems, Vol 28 , No 2 pp. 283-310
Bhandari, A., Gupta, A., & Das, D. (2015). “Improvised apriori algorithm using frequent pattern tree for real time applications in data mining”, Procedia Computer Science, Vol 46, pp.644-651.
Chen, H., Yang, M., & Tang, X. (2024). Association rule mining of aircraft event causes based on the Apriori algorithm. Scientific reports, 14(1), 13440.
Chen, Y. L. , Tang, K., Shen, R. J. & Hu, Y. H. (2005) “Market basket analysis in a multiple store environment. Decision Support Systems” Vol 40 No 2 pp.339–354
Clementini, E., Di Felice, P., & Koperski, K. (2000) “Mining multiple-level spatial association rules for objects with a broad boundary” Data & Knowledge Engineering, Vol 34, No 3, pp. 251-270
Cohen, E., Datar, M., Fujiwara, S., Gionis, A., Indyk, P., Motwani, R., Ullman, J. D., & Yang, C. (2001) “Finding interesting associations without support pruning” IEEE Transactions on Knowledge and Data Engineering, 13: pp. 64-78
Dubey, S. K., Mittal, S., Chattani, S., & Shukla, V. K. (2021, March). Comparative analysis of market basket analysis through data mining techniques. In 2021 International Conference on Computational Intelligence and Knowledge Economy (ICCIKE) (pp. 239-243). IEEE.
Indexed at, Google Scholar, Cross Ref
Eric Leclair (2005) “Understanding the True Cost of Inventory,” Vicone High Performance Rubber, Retrieved from https://www.viconerubber.com/en/knowledge-center/futher-readings/white-papers/understanding-the-true-cost-of-inventory/
Gooner, R.A., Morgan, N.A. and Perreault, W.D. Jr, (2011), “Is retail category management worth the effort (and does a category captain help or hinder)?”, Journal of Marketing, Vol. 75 No. 5, pp. 18-33.
Gu, L., Li, J., He, H., Williams, G., Hawkins, S., & Kelman, C. (2003) “Association rule discovery with unbalanced class distributions” Australasian Joint Conference on Artificial Intelligence, Springer, Berlin, Heidelberg, pp. 221-232
Gupta, S., & Mamtora, R. (2014) “A Survey on Association Rule Mining in Market Basket Analysis” International Journal of Information and Computation Technology, Vol 4, No 4, pp.409-414
Hahsler, M., Hornik, K., & Reutterer, T. (2006) “Implications of probabilistic data modeling for mining association rules” In from Data and Information Analysis to Knowledge Engineering, Springer, Berlin, Heidelberg, pp. 598-605
Hoque, E. M. J., Islam, M. S., & Mohtasim, S. A. (2024). Optimizing decision-making through customer-centric market basket analysis. Journal of Operational and Strategic Analytics, 2(2), 72-83.
IBM Corporation (2012) “Predictive inventory management: Keeping your supply chain in balance” Retrieved from https://rav.no/wp-content/uploads/2015/03/Predictive-inventory-IBM.pdf
Ishibuchi, H., Nakashima, T., & Yamamoto, T. (2001) “Fuzzy association rules for handling continuous attributes. In Industrial Electronics”. Proceedings. ISIE 2001. IEEE International Symposium Vol. 1, pp. 118-121
Indexed at, Google Scholar, Cross Ref
Kamruzzaman, S. M., & Rahman, C. M. (2010) “Text Categorization using Association Rule and Naive Bayes Classifier”
Kim, H. K., Kim, J. K., & Chen, Q. Y. (2012) “A product network analysis for extending the market basket analysis”, Expert Systems with Applications, Vol 39 No 8, pp.7403–7410. https://doi.org/10.1016/j.eswa.2012.01.066
Kohonen, T. (1990) “The self-organizing map”. Proceedings of the IEEE, Vol 78 No 9, pp. 1464–1480
Krichen, M., Abdalzaher, M. S., Elwekeil, M., & Fouda, M. M. (2024). Managing natural disasters: An analysis of technological advancements, opportunities, and challenges. Internet of Things and Cyber-Physical Systems, 4, 99-109.
Kumar, P., Manisha, K. N., & Nivetha, M. (2024, February). Market Basket Analysis for Retail Sales Optimization. In 2024 Second International Conference on Emerging Trends in Information Technology and Engineering (ICETITE) (pp. 1-7). IEEE.
Kuok, C. M., Fu, A., & Wong, M. H. (1998) ”Mining fuzzy association rules in databases” ACM Sigmod Record, Vol 27, No 1, pp. 41-46
Lee, C. H., Lin, C. R., & Chen, M. S. (2001) “On mining general temporal association rules in a publication database” In icdm pp. 337
Linoff, G. S., & Berry, M. J. (2011) “Data mining techniques: for marketing, sales, and customer relationship management”. John Wiley & Sons
Liu, Bing, Wynne, H.s.u., Yiming Ma, (1999) “Mining Association Rules With Multiple Minimum Supports” In Proceedings of the fifth ACM SIGKDD international conference on Knowledge discovery and data mining , pp. 337-341
Liu, D. R., & Shih, Y. Y. (2005) “Integrating AHP and data mining for product recommendation based on customer lifetime value”, Information & Management, Vol 42, No 3, pp.387-400
Indexed at, Google Scholar, Cross Ref
Liu, G., Huang, S., Lu, C., & Du, Y. (2014) “An improved K-Means Algorithm Based on Association Rules” International Journal of Computer Theory and Engineering, Vol 6 No 2, pp. 146–149
Liu, J., Pan, Y., Wang, K., & Han, J. (2002) “Mining frequent item sets by opportunistic projection” Proceedings of the eighth ACM SIGKDD international conference on Knowledge discovery and data mining, pp. 229-238
Lu, H., Feng, L., & Han, J. (2000) “Beyond intratransaction association analysis: mining multidimensional intertransaction association rules” Transactions on Information Systems (TOIS), Vol 18, No 4, pp.423-454
Ma, Y., Seetharaman, P.B. and Narasimhan, C. (2012), “Modeling dependencies in brand choice outcomes across complementary categories”, Journal of Retailing, Vol. 88 No. 1, pp. 47-62, available at: http://dx.doi.org/10.1016/j.jretai.2011.04.003
Malik, M. H., Ghous, H., Ismail, M., Jamshaid, S., & Altaf, J. (2024). Market Basket Analysis for Next Basket Item Prediction Using Data Mining and Machine Learning. Journal of Computing & Biomedical Informatics.
Mishra, M., Ghosh, S. K., Sarkar, B., Sarkar, M., & Hota, S. K. (2024). Risk management for barter exchange policy under retail industry. Journal of Retailing and Consumer Services, 77, 103623.
Mishra, N., Mishra, V., & Chaturvedi, S. (2024). A method for solving cold start problem using market basket analysis. International Journal of Advanced Intelligence Paradigms, 28(1-2), 155-168.
Padmanabhan, B., & Tuzhilin, A. (2003) “On the use of optimization for data mining: Theoretical interactions and eCRM opportunities” Management Science, Vol 49 No 10, pp.1327-1343
Park, J. S., Chen, M. S., & Yu, P. S. (1997) “Using a hash-based method with transaction trimming for mining association rules”. IEEE transactions on knowledge and data engineering, Vol 9, No 5, pp. 813-825
Rao, S., Gupta, R.,(2012) “Implementing Improved Algorithm Over APRIORI Data Mining Association Rule Algorithm”, International Journal of Computer Science And Technology, pp. 489-493
Raorane A. A, Kulkarni R. V., Jitkar B.D., (2012) “Association Rule - Extracting Knowledge Using Market Basket Analysis”, Research Journal of Recent Sciences, Vo11 (2)19
Russell, G. J., Ratneshwar, S., Shocker, A. D., Bell, D., Bodapati, A., Degeratu, A., & Shankar, V. H. (1999). “Multiple-category decision-making: Review and synthesis”, Marketing Letters, Vol 10, No 3, pp. 319-332
Sajwan, I., & Tripathi, R. (2024, April). Unveiling Consumer Behavior Patterns: A Comprehensive Market Basket Analysis for Strategic Insights. In 2024 Sixth International Conference on Computational Intelligence and Communication Technologies (CCICT) (pp. 372-377). IEEE.
Indexed at, Google Scholar, Cross Ref
Samaraweera, W.J., Vasanthapriyan, S. and Oza, K.S. (2014) “Designing a multi-level support based association mining algorithm” International Journal of Scientific and Research Publications Available at: http://www.ijsrp.org/research-paper- 0414.php?rp=P282520
Silverstein, C., Brin, S., & Motwani, R. (1998) “Beyond market baskets: Generalizing association rules to dependence rules”, Data mining and knowledge discovery, Vol 2, No 1, pp. 39-68
Srikant, R., & Agrawal, R. (1995) “Mining Generalized Association Rules” In VLDB ’95 Proceedings of the 21th international conference on very large data bases, pp. 407–419
Srikant, R., & Agrawal, R. (1996) “Mining quantitative association rules in large relational tables”. ACM Sigmod Record, Vol. 25, No. 2, pp. 1-12
Indexed at, Google Scholar, Cross Ref
Tassa, T. (2014) “Secure mining of association rules in horizontally distributed databases”. IEEE Transactions on Knowledge and Data Engineering, Vol 26, No 4, pp. 970-983
Ted Hurlbut (2004) “The Full Cost of Inventory: Exploring Inventory Carrying Costs” , Hurlbut & Associates
The Register (2006) “The parable of the beer and diapers” Retrieved from The Register: http://www.theregister.co.uk/2006/08/15/beer_diapers/
Videla-Cavieres, I. F., & Ríos, S. A. (2014) “Extending market basket analysis with graph mining techniques: A real case” Expert Systems with Applications, Vol 41, No 4, pp.1928–1936. https://doi.org/10.1016/j.eswa.2013.08.088
Waduge, C., Meththananda, U. I., Samaraweera, W., Waduge, C., & Meththananda, R. (2016). “Market Basket Analysis: A Profit Based Approach to Apriori Algorithm”.
Widjaja, A. E. (2024). Analysis of Apriori and FP-Growth Algorithms for Market Basket Insights: A Case Study of The Bread Basket Bakery Sales. Journal of Digital Market and Digital Currency, 1(1), 63-83.
Wijsen, J., & Meersman, R. (1998). “On the complexity of mining quantitative association rules” Data Mining and Knowledge Discovery, Vol 2 No 3, pp.263-281
Williams, C. C. (1997). “Rethinking the role of the retail sector in economic development”, Service Industries Journal, Vol 17 No 2, pp. 205-220
Wong, R. C. W., Fu, A. W. C., & Wang, K. (2003). “MPIS: Maximal-profit item selection with cross-selling considerations”. In Data Mining, 2003. ICDM 2003. Third IEEE International Conference, pp. 371-378
Wu, R. C., Chen, R. S., & Chen, C. C. (2005). “Data mining application in customer relationship management of credit card business”. In Computer Software and Applications Conference, 2005. COMPSAC 2005. 29th Annual International, Vol. 2, pp. 39-40
Indexed at, Google Scholar, Cross Ref
Received: 17-Jun-2025, Manuscript No. AMSJ-25-16006; Editor assigned: 18-Jun-2025, PreQC No. AMSJ-25-16006(PQ); Reviewed: 10- Jul-2025, QC No. AMSJ-25-16006; Revised: 25-Aug-2025, Manuscript No. AMSJ-25-16006(R); Published: 01-Sep-2025