Research Article: 2024 Vol: 28 Issue: 3
Price Forecasting of Sweet Lime using Arima Model for Better Marketing Decisions
Satyveer Singh Meena, Swami Keshwanand Rajasthan Agricultural University, Bikaner
Ragini Naikoti, Dr. Yashwant Singh Parmar University of Horticulture & Forestry
Avadh Bihari Pal, Swami Keshwanand Rajasthan Agricultural University, Bikaner
Anand Kumar, Swami Keshwanand Rajasthan Agricultural University, Bikaner
Citation Information: Singh Meena, S., Naikoti, R., Bihari Pal, A., & Kumar, A. (2024). Price forecasting of sweet lime using arima model for better marketing decisions. Academy of Marketing Studies Journal, 28(3), 1-6.
Abstract
This study focuses on the essential task of forecasting sweet lime prices in Telangana State, employing the ARIMA model to evaluate its efficacy and implications for marketing stakeholders. The significance of price predictions, especially for farmers making critical marketing decisions, underscores the practical value of this research. The data was collected from reliable government sources. The application of the ARIMA model using 'R' programming add methodological rigor to the study. The ARIMA (1,1,0) was identified as the most accurate model based on the lowest AIC which enhances the practical utility of the findings. This study succinctly encapsulates the core objective, methods, and key outcomes, offering a comprehensive overview in the intersection of agricultural pricing, forecasting, decision-making and optimizing market efficiency across diverse agricultural sectors in the context of sweet lime in Telangana.
Introduction
Horticulture in India has become a vital sector, particularly for small-scale farmers, offering sustainable opportunities and supporting diverse agro-industries. Accurate agricultural forecasting, especially in price predictions, holds a significant influence on both farmers and traders. Merchants rely on forecasts to plan market strategies, while farmers base production decisions on expected prices, impacting choices in inputs and land use. The study highlights the pivotal role of precise forecasting in maintaining production balance, influencing marketing strategies, and averting significant price fluctuations, thereby emphasizing its practical importance for stakeholders in the agricultural marketing sector.
The reviewed studies collectively underscore the pivotal role of ARIMA (Auto Regressive Integrated Moving Average) models in shaping agricultural marketing strategies and facilitating informed decision-making. Keerthi and Naidu (2013) employed ARIMA models to forecast tomato prices, demonstrating their efficacy in predicting market trends. Shafaqat and Zahid (2013) extended this approach to forecasting mango cultivation areas, showcasing ARIMA's versatile application in anticipating agricultural trends. Chaudhari and Tingre (2014) further reinforced the practical use of ARIMA by forecasting green gram prices, illustrating its utility for crop pricing strategies. Bannor and Sharma (2015) compared ARIMA and VAR models for groundnut prices, highlighting ARIMA (0,1,0) as a fitting model for specific contexts, indicating its applicability in marketing decisions. Tularam and Saeed's (2016) study on oil-price forecasting emphasized that ARIMA (2, 1, 2) has superior performance, offering valuable insights for policymaking and marketing in the oil sector. The comprehensive work by Darekar and Reddy (2017) on groundnut price forecasting for the kharif season revealed ARIMA models' significant contribution to farmers' decision-making processes. Similarly, studies by Mohapatra et al. (2018) on groundnut prices and Darekar and Reddy (2018) on wheat prices showcased the ARIMA model’s practical application in forecasting staple crop prices. The proposed Next Generation Agricultural Marketing System by Shrivastava and Pal (2019) embraced ARIMA alongside modern technologies, underlining its enduring relevance in agricultural decision-making. Pramod et al. (2020) research on brinjal prices and Kathayat and Dixit (2020) study on paddy prices further substantiate the ARIMA model's integral role in guiding marketing and production decisions. In essence, these studies collectively highlight ARIMA's instrumental role in shaping marketing strategies, enhancing decision-making processes, and contributing significantly to the agricultural sector's resilience and adaptability.
Material and Methods
This research employed a descriptive methodology, sourcing pricing data from reliable secondary platforms like AGMARKNET. To conduct the study and employ forecasting models, weekly averages were computed from daily pricing data. The sampling unit was a subset of the original daily price dataset. The market in Gaddiannaram from Hyderabad district of Telangana was chosen based on high arrivals using judgmental sampling. Utilizing convenience sampling, daily sweet lime prices were collected over the past 10 years (January 1, 2012, to December 31, 2021), forming the foundation for analysis Tables 1 & 2.
| Table 1 Choosing the Sampling Unit and the Sample Size | ||
| Sampling Unit | Sample Size | Sampling Criteria |
| State | Telangana | Judgmental sampling based on researcher’s convenience |
| Market | 1(Gaddiannaram, Hyderabad) | Judgmental sampling- Market with highest arrivals |
| Price Data | 1 | Convenience sampling based on data availability |
| Table 2 AIC Values of Different Arima Models | |
| ARIMA (0,1,0) | 7703.89 |
| ARIMA (1,1,0) | 7695.02 |
| ARIMA (0,1,1) | 7698.78 |
| ARIMA (0,1,0) | 7701.89 |
| ARIMA (2,1,0) | 7696.56 |
| ARIMA (1,1,1) | 7695.57 |
| ARIMA (2,1,1) | 7697.97 |
| ARIMA (1,1,0) | 7693.03 |
| ARIMA (2,1,0) | 7694.57 |
| ARIMA (1,1,1) | 7693.59 |
| ARIMA (0,1,1) | 7696.78 |
| ARIMA (2,1,1) | 7695.99 |
ARIMA Models are Applied as Follows
Working with time series lags requires the use of the backward shift operator B, which may be written as follows:
Byt=yt−1
B, operating on yt, causes the data to be shifted back one period.
The formula for an order p autoregressive model is-
yt=c+ϕ1yt−1+ϕ2yt−2+....+ϕpyt−p+εt
Where εt is white noise. Similar to multiple regression but using yt's lagged values as predictors. A model of autoregression of order p, or AR(p), was used to describe this.
A moving average model creates a regression-like model using previous forecast failures.
yt=c+εt+θ1εt−1+θ2εt−2+....+θqεt−q,
Where εt is white noise. Referred to this as a moving average model of order q, or an MA(q) model.
Auto-Regressive Integrated Moving Average is known as ARIMA. The complete model can be expressed as,
y′t=c+ϕ1y′t−1+...+ϕpy′t−p+θ1εt−1+...+θqεt−q+εt,
Where y′t is a series of differences (it may have been differenced more than once). Lagged yt values and lagged errors are both included in the "predictors" on the right-hand side. This is what we refer to as an ARIMA (p, d, q) model.
p = order of the autoregressive part;
d = degree of first differencing involved;
q = order of the moving average part.
The backshift notation for the equation looks like this,
(1−ϕ1B−⋯−ϕpBp) (1−B)dyt=c+(1+θ1B+...+θqBq)εt
Results and Discussion
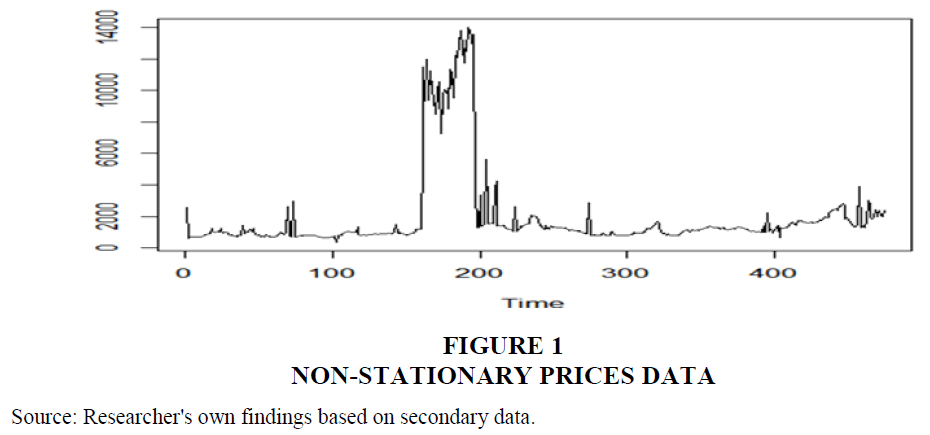
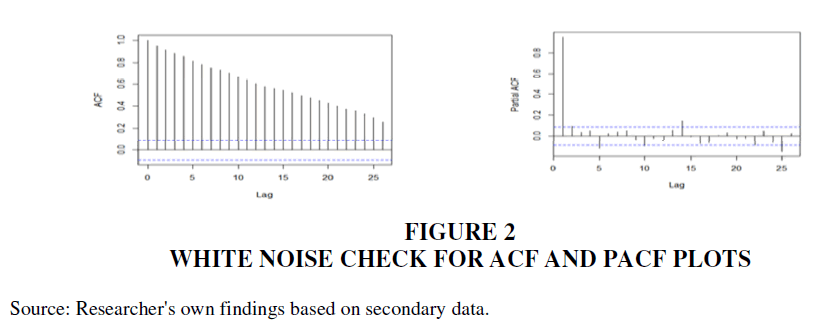
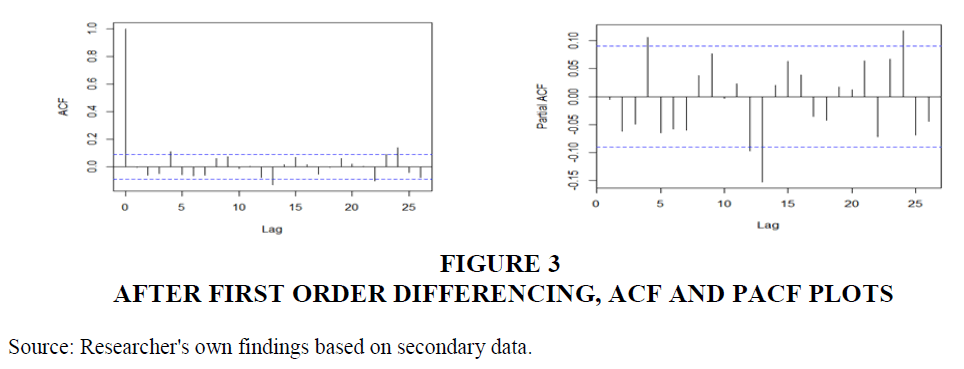
ARIMA models transform non-stationary time series data into a stationary form, essential for accurate forecasting. Initial steps involve testing for stationarity using tools like ADF, ACF, and PACF. Stationarity is crucial as ARIMA models perform best on stationary datasets. Stationary time series have parameters unaffected by observation time, while non-stationary ones exhibit trends or seasonality. White noise series are stationary, maintaining a constant appearance. Cycles without trends or seasonality are stationary but present forecasting challenges. Figure 1 illustrates non-stationarity with varying mean and variance. Confirming stationarity through differencing (Figures 2 & 3) is vital for reliable ARIMA modeling, ensuring accurate predictions.
Figure 2 White Noise Check for ACF and PACF Plots
Source: Researcher's own findings based on secondary data.
Figure 3 After First Order Differencing, ACF and PACF Plots
Source: Researcher's own findings based on secondary data.
The optimal model after analyzing the various AIC values is thought to have the least AIC value, which is 7693.02 ARIMA (1,1,0). Following forecasting, the mean absolute percentage error (MAPE) and root mean square error (RMSE) were discovered to be 826.07 and 15.24, respectively, as shown in table 3.
| Table 3 Accuracy Parameters of Arima Model | |
| MAPE | 13.75% |
| RMSE | 826.07 |
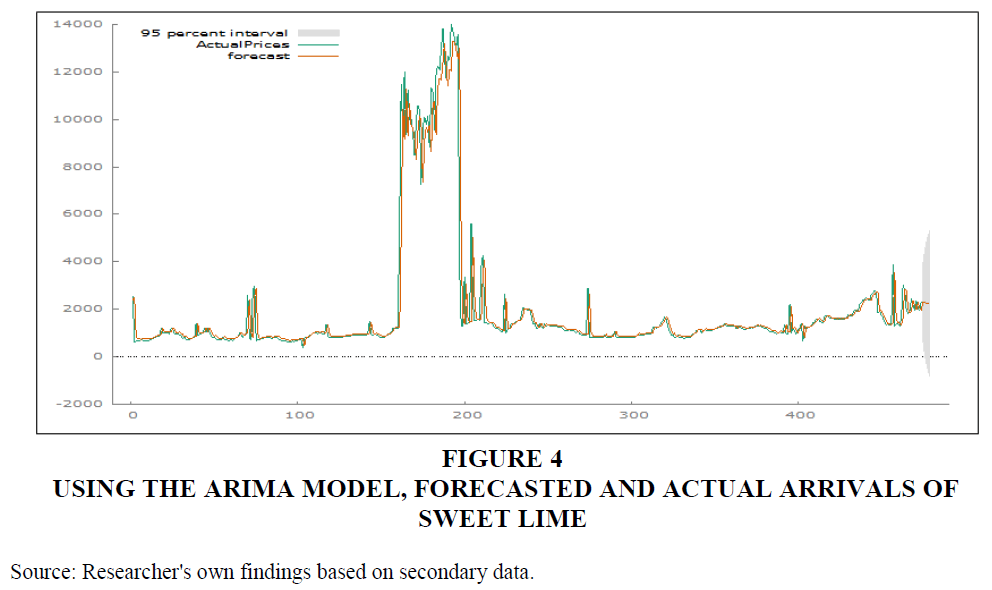
In figure 4 and table 4, forecasted values for the following five weeks are presented.
Figure 4 Using the Arima Model, Forecasted and Actual Arrivals of Sweet Lime
Source: Researcher's own findings based on secondary data.
| Table 4 Using the Arima Model, Forecasted and Actual Arrivals of Sweet Lime | ||
| Weeks | Actual Prices | Forecast |
| 470 | 1879.17 | 2205.9 |
| 471 | 1454.35 | 1983.12 |
| 472 | 1738.69 | 2297.39 |
| 473 | 2378.00 | 2070.38 |
| 474 | 2177.68 | 1968.55 |
| 475 | 2295.82 | |
| 476 | 2283.98 | |
| 477 | 2272.62 | |
Conclusion
The significance of utilizing advanced forecasting techniques, such as the ARIMA (1,1,0) model, in the context of sweet lime prices in Telangana aligns with broader agricultural market dynamics. The advice for farmers to prefer regulated markets over local ones for improved price realization resonates with similar guidance provided in previous studies, especially those related to the groundnut industry. The emphasis on improved data availability in achieving better forecasting results is a common thread, reinforcing the notion that precise forecasts are contingent on robust data. The observation about missing values and potential for more sophisticated treatments echoes the broader need for continuous refinement of forecasting methodologies. Combining multiple error measures, as suggested in this study, aligns with the trend observed in previous research, emphasizing the pursuit of enhanced accuracy in forecasting models. In summary, the findings underscore the continued relevance of advanced forecasting techniques, particularly the ARIMA model, in guiding decision-making processes and optimizing market efficiency across diverse agricultural sectors.
References
Bannor, R. K., & Sharma, A. (2015). Comparing the forecasting power of multivariate VAR and univariate ARIMA models: A case of groundnut prices in Bikaner District of Rajasthan. Asian Journal of Research in Business Economics and Management, 5(3), 51-64.
Indexed at, Google Scholar, Cross Ref
Chaudhari, D.J., & Tingre, A.S. (2014). Use of ARIMA modeling for forecasting green gram prices for Maharashtra. Journal of Food Legumes, 27(2), 136-139.
Darekar, A., & Reddy, A.A. (2018). Forecasting wheat prices in India. Wheat and Barley Research, 10(1), 33-39.
Darekar, A., & Reddy, A.A. (2017). Forecasting Oilseeds Prices in India: Case of Groundnut. Journal of Oilseeds Research, 34(4), 235-240.
Indexed at, Google Scholar, Cross Ref
Kathayat, B., & Dixit, A. K. (2021). Paddy price forecasting in India using ARIMA model. Journal of Crop and Weed, 17(1), 48-55.
Keerthi, P. K., & Naidu, G. M. (2013). Forecasting monthly prices of tomato in Madanapalli market of Chittoor district. Bioinfolet, 10(1 B), 201-203.
Mohapatra, S., Mohapatra, U., & Mishra, R. K. (2018). Price forecasting of groundnut in Odisha. The Pharma Innovation Journal, 7(3), 111-114.
Pramod, K., Badal, P.S., Paul, R. K., Jha, G.K., Venkatesh, P., Kingsly, I.T., Kamalvanshi, V., Balasubramanian, M., & Anbukkani, P. (2020). Empowering farmers through future price information: A case study of price forecasting of Brinjal in eastern Uttar Pradesh. Indian Journal of Economics and Development, 16(4), 479-488.
S. Shrivastava & S.N. Pal, "A Framework for Next Generation Agricultural Marketing System in Indian Context," 2019 IEEE International WIE Conference on Electrical and Computer Engineering (WIECON-ECE), Bangalore, India, 2019, 1-4.
Shafaqat, M., & Zahid, A. (2013). Time Series Model to Forecast Area of Mangoes from Pakistan: An Application of Univariate ARIMA Model. Academy of Contemporary Research Journal, 7(1), 1-7.
Tularam, G., & Saeed, T., (2016). Oil-price forecasting based on various univariate time-series models. American Journal of Operations Research, 6, 226-235.
Indexed at, Google Scholar, Cross Ref
Received: 12-Dec-2023, Manuscript No. AMSJ-23-14259; Editor assigned: 13-Dec-2023, PreQC No. AMSJ-23-14259(PQ); Reviewed: 29-Jan-2023, QC No. AMSJ-23-14259; Revised: 29-Feb-2024, Manuscript No. AMSJ-23-14259(R); Published: 23-Mar-2024


