Research Article: 2020 Vol: 24 Issue: 4
Retail Service Quality and Customer Commitment: The Role of Affective and Continuance Commitment on Word of Mouth Communication
Dr. Priti Bakhshi, Jaipuria Institute of Management Indore
Dr. Charu Dubey, Jaipuria Institute of Management Indore
Abstract
The purpose of the study is to understand the relationships between service quality of a retail outlet, customer commitment towards the retail outlet, and their tendency to communicate his/her experience with others through word of mouth (WoM). The population for the study is the retail shoppers across different 5 big cities one each from east, west, north, south, and central India, consisting of a mix of gender, income levels, age levels, and marital status. From this population, a random sample of 1000 was drawn which was then split randomly into two sets to test the hypothesis. Structured Equation Modelling is used to study the objectives of the Study. It is found in the study that both affective and continuance commitments jointly mediate the influence of retail service quality on WoM communication. Continuance commitment also mediates the influence of affective commitment on WoM communication. Quality of services enhances the customer commitment towards the store and customer commitment leads to propagating the in-store experience to other likely customers. As genders behave differently, proper practice should be taken into consideration while providing the service. Also, Retailers should adopt all those practices of providing quality services which can result in positive word of mouth communication.
Keywords
Service Quality, Customer Satisfaction, Affective Commitment, Continuance Commitment, Word of Mouth Communication.
Introduction
Customer satisfaction is an emotional state. Customers are satisfied if a service provider makes quality improvements based on customer needs which results in positive Word-of-Mouth (WoM) communication for providers of goods and services based on trust and satisfaction. It can be said that for any retail organization, the best salesperson is the satisfied customer. Satisfaction results in loyalty which results in customer advocacy. Customer advocacy can time and again lead to positive WoM (Griffin, 1995). WoM recommendations are extremely important to consumers (Beatty et al., 1996) as it helps them in their decision-making process about a product or service (Murray, 1991; Giese & Spangenberg, 1997).
Based on these premises, the purpose of the study is to understand the relationships between service quality of a retail outlet, customer commitment towards the retail outlet, and their tendency to communicate his/her experience with others through word of mouth. Satisfied retail customers were more likely to engage in positive WoM advertising for the retailer. We start with a premise, that though service quality appears to have a direct influence on the customers’ inclination to communicate their experience to others through word of mouth, the customer commitment towards the retail outlet mediates this relationship. That is the quality of services enhance the customer commitment towards the store and customer commitment leads to propagating the in-store experience to other likely customers.
This paper is further divided into sections that include literature review, model & hypotheses, research methodology, analysis, findings, and implications.
Literature Review
Customer satisfaction is the assessment of pre-purchase expectations with the post-purchase outcome (Fornell, 1992) and it is an emotive phenomenon often a result of response after evaluating these experiences (Crosby et al., 1990). Customer satisfaction thus is an emotional feeling resulting from customers’ interactions with the salespersons (Crosby et al., 1990; Fornell, 1992). Customer satisfaction comprises of a response of a particular customer which is focussed and determined at a particular given time (Giese & Cate, 1999; Leung, 2020). Baker-Prewitt & Sivadas (2000) established that store loyalty was not influenced by attitude, purchase decisions, or recommendations. Some other studies show customer satisfaction as a predictor of purchase intentions to a large degree (Newman & Webel, 1973; Kasper, 1988).
Available literature in Services Marketing suggests a powerful relation among service quality and satisfaction of the customer (Woodside et al., 1989; Cronin & Taylor, 1992; Spreng & McKoy, 1996; Caruana, 2002; Spreng & Chiou, 2002; Yildiz, 2017). Experts use the two terms i.e. “satisfaction” and “quality” as synonymous, yet the two constructs are distinct as most researchers would vouch, "Satisfaction is the consumer fulfillment response” (Woodside et al., 1989; Taylor & Baker, 1994; Spreng & McKoy, 1996; Parsuraman et al., 1998; Zeithaml & Bitner, 2003). Satisfaction is a bigger concept and in contrast judgments about service quality are more specific. There has been considerable emphasis on the relationships among service quality and customer satisfaction, but the articles examining these relations are mostly non-empirical (Bolton & Drew, 1994; Lacobucci et al., 1995; Meng & Sego, 2020). Some studies suggest a lack of distinction between quality and satisfaction, (Anderson & Fornell, 1994). Service quality is an assessment of setting global parameters of service providers’ deliverables (Parsuraman et al., 1985; Anderson & Fornell, 1994). Service Provider is responsible for the quality of product/service on one end and on the other end satisfaction is more of the satisfaction at customers’ end on the experiences with the service (Lacobucci et al., 1995). Many studies claim that that customer satisfaction follows quality which in turn stems from attitudes about service quality. Service quality as an antecedent to satisfaction (Anderson & Fornell, 1994; Dick & Basu, 1994; Rust & Oliver, 1994; Iacobucci et al., 1995). An enhancement in service quality will enhance customer experience and the same will be followed by customer satisfaction (Bolton & Drew, 1994); Bitner et al., 1994; Anderson et al.,1994). A favorable review by the customer, like praising the firm, about the service quality strengthens the relationship and are indicative of behavioral intentions with a likelihood of recommending the firm, of the customer while negative reviews weaken it and lead to negative publicity (Zeithaml et al., 1996; Danaher & Rust, 1994; Dabholkar et al., 1996). Positive behavioral intentions are a corollary of customer satisfaction leading to customer loyalty (Taylor & Baker, 1994; Spreng & Chiou, 2002). Satisfaction quality and intention acts as an intervening variable (Cronin & Taylor, 1992; Spreng & McKoy, 1996; Caruan, 2002; Zeithaml & Bitner, 2003). Behavioral intentions can be inclined by perception about service quality (Bloemer, et al., 1999; Baker & Crompton, 2000; Zeithaml et al., 1996; Tian Cole et al., 2002). Attitudinal component of loyalty is an offshoot of psychological commitment, influenced by personal and socio-situational factors, predictors of behavioral loyalty (Iwasaki & Havitz, 1998; Pritchard et al., 1992; Park & Kim, 2000). Long term success of a business entity can be attributed to service quality to a large extent, (Rust & Oliver, 1994; Parasuraman et al., 1988). Organizations gain significantly by providing service quality and the other benefits of providing good service quality in business to business relations are customer loyalty (Bloemer & Kasper, 1995; Bolton & Myers, 2003; Boulding et al., 1993).
A desire to sustain a relationship with the seller is referred to as commitment, (Morgan & Hunt 1994). This is a long-term orientation wherein a customer and seller have a fruitful long-term relationship (Gruen, 1995). In the event of a strong and committed relationship with the seller, there will be customer loyalty in the offing (Dick & Basu, 1994; Day, 1969). There exists a relationship between commitment and loyalty, and that commitment leads to loyalty (Beatty et al.,1988). Intention to continue with a relationship could perhaps have an opposite effect if underlying motivation is not considered (Geyskens, 1998; Allen & Meyer, 1990).
Loyalty affects affective commitment most noticeably (Harrison-Walker, 2001). Affective commitment as
“A party’s desire to continue a relationship because of the enjoyment of the relationship for its own sake, apart from the instrumental worth and because they experience a sense of loyalty and belongingness” (Geyskens et al., 1996; Allen & Meyer, 1990).
The satisfaction of the customer or the dissatisfaction of the customer is a ‘cognitive or affective reaction’ and is a result of a repeated and prolonged set of service encounters (Rust & Oliver, 1994). A comparison of apparent quality and expected quality with experience after consumption if met leads to customer satisfaction. There is in effect no effect of continuance commitment on positive WOM (Verhoef et al., 2002; Harrison-Walker, 2001) and negative affect is reported by Fullerton (2003, 2005). Greater WOM led to greater continuance commitment, if customers felt positive about the service relationships (Jones et al., 2007). Continuance Commitment does not affect when customers are reporting a negative service relationship.
The customers’ views of functional and social benefits affect satisfaction with the sales staff positively (Reynolds & Beatty, 1999). As a result, satisfaction with the sales staff is associated with loyalty to the sales staff, Word-of-Mouth (WoM), and purchases (LaBarbera & Mazursky, 1983). Two things that are important for a positive WoM for providers of goods and services are trust and satisfaction (Ranaweera & Prabhu, 2003). Purchaser is willing to make repeated purchases and referrals based on positive experiences and trust in the service provider also negated the willingness to spread negative WoM (Goles et al., 2009).
When a customer spreads a positive WoM about an organization, he is showing his loyalty to the organization (An & Han, 2020). Trust is an important factor when it comes to pre-purchase and post-purchase behavior and results in more satisfied customers and in turn customer loyalty (Kuan et al., 2005; Singh & Sirdeshmukh, 2000; Rita et al., 2019). This results in forming a strong relationship among customers and sellers (Bettencourt, 1997). This also leads to more interactions with the seller, (Morgan & Hunt, 1994). Positive assessments by customers for service quality and satisfaction show intentions of loyalty and intention of dispersal of positive WoM (Zeithaml et al., 1996). Service quality perceptions have a direct relation to positive WoM and positive behavioral intentions (Alexandris et al., 2001). Positive communication about firms offering leads to positive WoM (Hennig-Thurau et al., 2002; Harrison-Walker, 2001; Freiden & Goldsmith, 1988). A positive WOM serves as a powerful input during the decision-making process. Aimed at altering consumer buying behavior consumers are bombarded with a lot of marketing information, and WOM communication is one of the highest trusted sources towards this end. Long term economic success of a firm is dependent on WoM to a great extent (Hennig-Thurau et al., 2002). It saves the customers of cognitive dissonance, feeling that a wrong decision has been made (Festinger, 1957; Wangenheim, 2005), post-purchase customers will give a positive WoM on the purchase decisions they have made (Wangenheim, 2005; Festinger, 1957). Customers rely on advice from people who have experienced services, this is because trust between customers is stronger than trust in communication from the firm (Anderson, 1998; Arndt, 1968; Kinard & Capella, 2006; Gremler et al., 2001; Herr et al., 1991; Bone, 1995; Burzynski & Bayer, 1977; Swan & Oliver, 1989; Singh, 1990; Richins, 1983; Anderson, 1998; Bone, 1992; File et al., 1992). Loyalty can be termed as a relation among viewpoint toward an entity (brand/product/service/store/vendor) and patronizing behaviour (Dick & Basu,1994; Jacoby, 1971). Loyalty is also established as an attitudinal factor existing within the loyalty process (Fuentes et al., 2017). The final objective of customer satisfaction must be customer loyalty (Zeithaml et al., 1996; Fitzell, 1998; Reynolds & Beatty, 1999, Sivadas & Baker-Prewitt, 2000). It is believed that satisfied customers are predisposed to go for repeat buying (Zeithaml et al., 1996) and that these customers will recommend to others as well (Reynolds & Beatty, 1999; Reynolds & Arnold, 2000). Satisfaction of customer result in the loyalty of the customer and this will thwart efforts of competitors to woo them as loyal customers will not be amenable to the marketing exertions of the customers (Fornell et al., 1996; Fitzell, 1998). Customer satisfaction, customer loyalty, and profitability are related in respective order (Heskett et al., 1990; Reichheld & Sasser, 1990; Zeithaml et al., 1990; Gummeson, 1993; Anderson et al., 1994; Heskett et al., 1994; Storbacka et al., 1994; Rust et al., 1995; Schneider & Bowen, 1995; Hallowell, 1996; Tripathi, 2017) as satisfaction leads to consumers’ recommending a product or service (Howard & Sheth, 1969; Oliver, 1980, 1987; Richins, 1983; Brown & Beltramini, 1989; Wilson & Peterson, 1989; Reichheld & Sasser, 1990; Blodgett et al., 1993; Dick & Basu, 1994; Beatty et al., 1996). Impact of loyalty on WoM communication plays a significant role (Gremler & Brown, 1999; Reynolds & Arnold, 2000; Harrison-Walker, 2001; Srinivasan et al., 2002; Ifie et al., 2018; Ngoma & Ntale, 2019).
Customer commitment as a mediating variable can influence future intentions (Garbarino & Johnson, 1999). The commitment follows the premise that the current relationship with another is of importance and that maximum effort should be put into maintaining it. The parties so committed believe that it is important to work on this relationship and ensure that the relationship endures (Morgan & Hunt, 1994). In marketing relationships, adequate consumption experience has a positive effect on the level of commitment (Brown et al., 2005). Customer satisfaction is related to affective commitment in industries such as hairstyling, auto-repair, banking (Fullerton, 2011). Trust between sellers and buyers ensures commitment and the parties value the relationship. This commitment lends sustainability over an extended period (Morgan & Hunt, 1994; Duhan & Sandvik, 2009). There are many studies on impact of word of mouth communications in various sectors but very few on retail sector across the globe. In context of developing countries and in India, very limited or no studies are undertaken in the retail sector to study the role of service quality on affective and continuance commitment impacting the word of mouth communication.
Model & Hypotheses
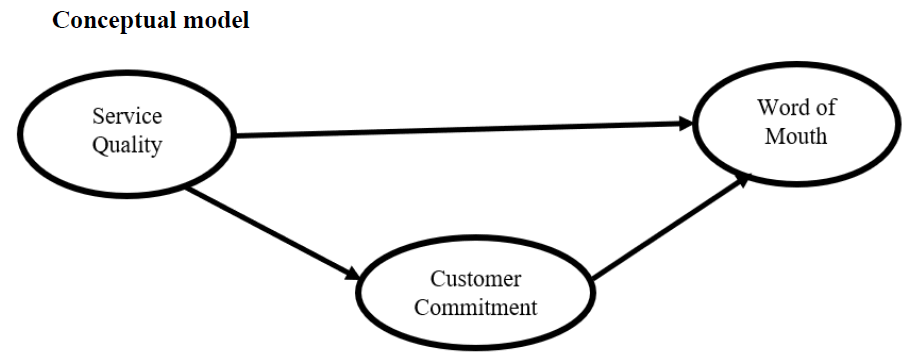
Customer commitment mediates the impact of service quality on WoM communication and the relation between service quality, customer commitment, and WoM communication is invariant across gender, income levels, location, age levels, and marital status.
Research hypotheses
1. Affective commitment does not mediate the impact of retail service quality on WoM communication.
2. Continuance commitment does not mediate the impact of retail service quality on WoM communication.
3. Both affective and continuance commitment jointly do not mediate the impact of retail service quality on WoM communication.
4. The relationship between retail service quality, affective commitment, continuance commitment, and is not moderated by gender.
5. The relationship between retail service quality, affective commitment, continuance commitment, and is not moderated by age levels.
6. The relationship between retail service quality, affective commitment, continuance commitment, and is not moderated by income levels.
7. The relationship between retail service quality, affective commitment, continuance commitment, and is not moderated by marital status.
Research Methodology
Sample
The population for the study is the retail shoppers across different metros across India, consisting of a mix of gender, income levels, age levels, and marital status. From this population, a random sample of 1000 was drawn from five different cities of East, West, North, South, and Central India. They were Kolkata, Mumbai, Delhi, Hyderabad, and Indore. The sample was drawn in evening times (from 5 to 9 pm). Every 5th customer was intercepted, by trained student volunteers and sought participation in the study. The data were collected from the five locations simultaneously. The total sample was then split randomly into two sets. Sample 1 consisted of 399 respondents used to study the measuring instruments. Sample 2 consisted of 601 respondents used to test the hypothesis. Table 1 shows the sample characteristics for total as well as split samples.
| Table 1 Sample Characteristics | |||||||
| Attributes | Categories | Full Sample (N=1000) | Sample 1 Measurement Sample (N=399) | Sample 2 Analysis Sample (N=601) | |||
| Frequency | Percent | Percent | Frequency | Percent | |||
| Gender | Female | 370 | 37.0 | 143 | 35.8 | 227 | 37.8 |
| Male | 630 | 63.0 | 256 | 64.2 | 374 | 62.2 | |
| Income Categories | <= 4 L | 394 | 39.4 | 157 | 39.3 | 237 | 39.4 |
| >4 to 8 L | 426 | 42.6 | 162 | 40.6 | 264 | 43.9 | |
| >8 L | 180 | 18.0 | 80 | 20.1 | 100 | 16.6 | |
| Location | Kolkata | 200 | 20.0 | 74 | 18.5 | 126 | 21.0 |
| Delhi | 200 | 20.0 | 80 | 20.1 | 120 | 20.0 | |
| Mumbai | 200 | 20.0 | 83 | 20.8 | 117 | 19.5 | |
| Hyderabad | 200 | 20.0 | 83 | 20.8 | 117 | 19.5 | |
| Indore | 200 | 20.0 | 79 | 19.8 | 121 | 20.1 | |
| Age Categories | <= 25 yrs | 424 | 42.4 | 164 | 41.1 | 260 | 43.3 |
| > 25 to 40 yrs | 364 | 36.4 | 146 | 36.6 | 218 | 36.3 | |
| > 40 ye=rs | 212 | 21.2 | 89 | 22.3 | 123 | 20.5 | |
| Marital Status | Single | 490 | 49.0 | 195 | 48.9 | 295 | 49.1 |
| Married | 510 | 51.0 | 204 | 51.1 | 306 | 50.9 | |
Measuring Instruments
Retail Services Quality Scale (RSQL): A 26 statements scale developed by Dabholkar et al., (1996) was used to assess retail service quality. This scale comprised five dimensions namely, reliability (five items), responsiveness (four items), empathy (five items), assurance (five items), and tangibles (ten items).
Customer Commitment Scale: A 24 statement scale developed and evaluated by Harrison-Walker (2001), Schechter (1985), and Mayer & Schoorman (1992) were used. This scale comprised of two Sections C1 (14 statements) and C2 (10 statements). The C1 statements pertain to affective commitment (AFC) and C2 statements pertain to continuance commitment (CNC). The wording of the statements was suitably modified to suit retail customers.
Word-Of-Mouth Communication Scale (WOM): A 13 statements scale developed by Harrison-Walker (2001). The wordings of this scale too were suitably modified to suit retail customers.
Demographic Details: In addition to these scales, demographic information about respondents were collected by separate questions about their gender, age, income, and marital status.
Psychometric Properties of the Scales
The respondents were asked to respond to each statement of all three scales on a 7-point Likert scale, rating 1 as strongly disagree to 7 as strongly agree.
Sample 1 consisting of 399 respondents were used to assess the psychometric properties of the scales. Factor structure, convergent and discriminant validities of the scales were studied using exploratory and confirmatory factor analysis. Exploratory factor analysis (EFA) with principal component extraction and varimax rotation methods were performed on each of the three scales. EFAs have extracted 5 factors with 57.685% of the variance in the RSQL scale, 3 factors with 57.435% of the variance in the AFC scale, 2 factors with 57.111% of the variance in CNC scale, and 3 factors with 54.421% of the variance in the WoM scale. Since we are interested in the overall construct and not its dimensions, it was decided to develop item parcels comprising randomly drawn items from each factor such that each parcel could represent a mine version of the whole scale. These item parcels were used to confirmatory factor analysis (CFA).
Lack of the common method, bias is evident from 43.87% average variance extracted when all indicator variables (item parcels) were linked by one common latent factor (Herman, 1960; Podsakoff et al., 2003). Three CFA models were formulated and tested. In model 1, indicants of two commitment variables namely, AFC and CNC were linked to one overall construct viz., customer commitment. In model 2, the indicants of each commitment variables were linked to two separate constructs. In model 3, two first-order commitment constructs derived in model 2, was linked to one second-order factor. Table 2 shows model comparison statistics.
| Table 2 CFA Models Comparisons | ||||||||||
| Model No | Remarks | χ2 | df | p | CFI | Comparison of nested models | ||||
| Models | Δχ2 | Δdf | p | CFI | ||||||
| M1 | Two Commitment scales merged into one and error covariance (e11 <-> e12 added | 609.621 | 86 | 0.000 | 0.892 | M2 vs M1 | 400.690 | 2 | 0.000 | 0.082 |
| M2 | Two Commitment scales demerged | 208.931 | 84 | 0.000 | 0.974 | M3 vs M1 | 266.830 | 1 | 0.000 | 0.055 |
| M3 | Second-order factor extracted from two commitment scales | 342.791 | 85 | 0.000 | 0.947 | M3 vs M2 | 133.860 | 1 | 0.000 | -0.027 |
The model fit, as evaluated by the chi-square difference test and the difference in CFI favors model 2, over models 1 and 3. Hence model 2 with four latent constructs was considered as the best representation of the factor structure of the measurement tools used in the study. The details of factor loadings, factor covariance, convergent and discriminant validity and composite reliability of constructs are given in Table 3.
| Table 3 Confirmatory Factor Analysis (Measurement Model) | |||||||||
| Part A: Factor Loadings | Part C: Convergent Validity | ||||||||
| Indicator Parcels | First-Order Latent Factors | Un-Std. Loadings | Std. Error | Critical ratio | P | Std. Loadings | Average Variance Extracted | Composite Reliability | |
| PS1 | <--- | Retail Service Quality (RSQL) | 1.000 | 0.897 | 0.776 | 0.945 | |||
| PS2 | <--- | 0.984 | 0.038 | 25.847 | *** | 0.876 | |||
| PS3 | <--- | 0.969 | 0.037 | 26.463 | *** | 0.885 | |||
| PS4 | <--- | 0.993 | 0.039 | 25.737 | *** | 0.874 | |||
| PS5 | <--- | 1.212 | 0.047 | 25.544 | *** | 0.871 | |||
| PC11 | <--- | Affective commitment (AFC) | 1.000 | 0.851 | 0.736 | 0.918 | |||
| PC12 | <--- | 1.305 | 0.059 | 22.074 | *** | 0.863 | |||
| PC13 | <--- | 1.000 | 0.050 | 19.950 | *** | 0.812 | |||
| PC14 | <--- | 1.427 | 0.060 | 23.880 | *** | 0.904 | |||
| PC21 | <--- | Continuance commitment (CNC) | 1.000 | 0.824 | 0.691 | 0.870 | |||
| PC22 | <--- | 1.294 | 0.068 | 19.057 | *** | 0.848 | |||
| PC23 | <--- | 0.939 | 0.051 | 18.341 | *** | 0.822 | |||
| PW1 | <--- | Word of mouth (WOM) | 1.000 | 0.800 | 0.689 | 0.943 | |||
| PW2 | <--- | 1.344 | 0.070 | 19.140 | *** | 0.885 | |||
| PW3 | <--- | 1.091 | 0.063 | 17.255 | *** | 0.802 | |||
| Part B: Factor Covariances | |||||||||
| First order Constructs | Covariance | Std. Error | Critical ratio | P | Correlation | r2 | |||
| Retail Service Quality | <--> | Affective commitment | 10.023 | 1 | 10.027 | *** | 0.688 | 0.473 | |
| Retail Service Quality | <--> | Continuance commitment | 4.639 | 0.953 | 4.868 | *** | 0.283 | 0.080 | |
| Retail Service Quality | <--> | Word of mouth | 5.11 | 0.961 | 5.317 | *** | 0.312 | 0.097 | |
| Affective commitment | <--> | Continuance commitment | 5.242 | 0.649 | 8.08 | *** | 0.535 | 0.286 | |
| Affective commitment | <--> | Word of mouth | 4.882 | 0.639 | 7.643 | *** | 0.499 | 0.249 | |
| Continuance commitment | <--> | Word of mouth | 8.947 | 0.888 | 10.081 | *** | 0.813 | 0.661 | |
| Model Fit: Model χ2 = 208.931 (df=84, p=.000); χ2/df = 2.487; GFI=.936; CFI=.974; TLI=.968; PNFI=.766; RMSEA=.061 (90% CI=.051 - .072; pClose=.000) | |||||||||
| Part D: Discriminant validity | |||||||||
| RSQL | AFC | CNC | WOM | ||||||
| RSQL | 0.776 | 0.473 | 0.080 | 0.097 | |||||
| AFC | 0.736 | 0.286 | 0.249 | ||||||
| CNC | 0.691 | 0.661 | |||||||
| WOM | 0.689 | ||||||||
All factor loadings and factor covariance are significant beyond the 5% level. The model fit is very good as revealed by all fit indices (CFI=0.974 and RMSEA = 0.061). The convergent validity of all the latent constructs are greater than 0.500 (RSQL=0.776, AFC = 0.736, CNC = 0.691 and WOM = 0.689). All constructs are distinct from each other as seen from Part D of the table. The AVEs of all latent constructs are greater than their squared correlations with other latent constructs. The composite reliabilities of the constructs are also very high (RSQL=0.945, AFC=0.918, CNC=0.870, and WOM=0.943) (Figure 1).

Figure 1 Measurement Model
Analysis
To test the adequacy of the conceptual model, the structural equation modeling (SEM) technique was used. The analysis sample (Sample 2, N=601) was used to estimate the structural path coefficients. Item parcels used as indicators in the measurement model was used to estimate SEM. The measurement models of sample 1 were compared with the measurement model derived from sample 2, to ascertain the invariance of the measurement structure of tools in both the samples. SEM was employed to study the configuration of the relationship between the four constructs. Mediation effects of constructs AFC and CNC were tested by estimating indirect effects using the bootstrapping technique.
Moderator effects of gender, age, income, and marital status were estimated by adapting the structural invariance method. The unconstrained model (all path coefficients across the categories of all moderator variables are unequal and thereby freely estimated), was compared with the constrained model (all path coefficients across the categories are fixed as equal). Differences in chi-square values and CFI are used to estimate the adequacy of the models. Critical ratios were used to compare the individual path coefficients across categories.
Findings and Discussion
The factor structures of the measurement tools of samples 1 and 2 were compared to ascertain invariance. Table 4 gives a comparative evaluation of three models. In model 1, parameters for both samples were freely determined; in model 2, measurement weights (factor loadings) of both samples were constrained to equality; and in model 3, both measurement weights and structural covariance of both the samples were constrained to equality. When models were compared, the p values of all Δχ2 are not significant, implying that all three models do not vary in factor loadings and correlation among constructs. Differences in CFI, TLI, and RMSEA are negligible reinforcing the invariance
| Table 4 Comparison of Measurement Models Of Sample 1 and Sample 2 | |||||||||||
| Model no | Model descriptions | Model Fit | Model comparisons | ||||||||
| Model χ2 | df | CFI | TLI | RMSEA | Δχ2 | Δdf | p | ΔCFI | |||
| M1 | Unconstrained | 492.889 | 168 | 0.97 | 0.962 | 0.044 | M2 vs M1 | 11.333 | 11 | 0.419 | 0 |
| M2 | Measurement weights constrained | 504.222 | 179 | 0.97 | 0.965 | 0.043 | M3 vs M1 | 20.921 | 21 | 0.464 | 0 |
| M3 | Measurement weights and Structural Covariance Constrained | 518.509 | 189 | 0.97 | 0.967 | 0.041 | M3 vs M2 | 9.587 | 10 | 0.477 | 0 |
Descriptive statistics of all measured variables in the analysis sample are given in Table 5. Skewness and kurtosis values for all variables are within ± 1 range, implying deviation from normality is within a tolerable range. The internal consistency (Cronbach’s α reliability) of all variables are in the range of 0.758 to 0.926. All inter-correlations among the variables are moderate, positive, and significant.
| Table 5 Descriptive Statistics of Variables | |||||||||
| N | Mean | Skewness | Kurtosis | Cronbach's α Reliability | Inter-correlations | ||||
| RSQL | AFC | CNC | WOF | ||||||
| Retail Service Quality (RSQL) | 601 | 120.2 | 0.077 | -0.217 | 0.926 | 1 | 0.601** | 0.158** | 0.168** |
| Affective Commitment (AFC) | 601 | 62.36 | -0.086 | -0.216 | 0.875 | 1 | 0.399** | 0.369** | |
| Continuance Commitment (CNC) | 601 | 40.03 | -0.255 | 0.241 | 0.85 | 1 | 0.658** | ||
| Word of Mouth (WOM) | 601 | 53.17 | 0.023 | 0.283 | 0.758 | 1 | |||
SEM was used to estimate the path coefficients and mediating effects. Table 6, presents direct effects. The measurement model is not shown in the table for brevity. The model fit is highly satisfactory (CFI = 0.966, RMSEA – 0.063). The direct paths, except RSQL ◊ WOM, and AFC ◊ WOM is significant. Retail service quality enhances affective commitment (b=0.379, p = 0.000) and diminishes continuance commitment (b = -0.137, p = 0.000). Affective commitment enhances continuance commitment (b = 0.686, p = 0.000). Continuance commitment enhances word of mouth communication (b = 0.698, p = 0.000). Retail service quality (b = 0.008, p = 0.798) and affective communication (b = 0.079, p = 0.216) have not shown any significant influence of word of mouth communication.
| Table 6 Structural Path Analysis (Structural Model) | |||||||
| Structural Equation Model (path coefficients) | |||||||
| First-order latent factors | UnStd. Estimates | Std. Error | Critical ratio | P | Std. Estimates | ||
| Affective Commitment | <--- | Retail Service Quality | 0.379 | 0.025 | 15.088 | *** | 0.659 |
| Continuance Commitment | <--- | Retail Service Quality | -0.137 | 0.041 | -3.302 | *** | -0.200 |
| Continuance Commitment | <--- | Affective Commitment | 0.686 | 0.078 | 8.802 | *** | 0.579 |
| Word of Mouth | <--- | Retail Service Quality | 0.008 | 0.032 | 0.256 | 0.798 | 0.013 |
| Word of Mouth | <--- | Affective Commitment | 0.079 | 0.064 | 1.236 | 0.216 | 0.072 |
| Word of Mouth | <--- | Continuance Commitment | 0.698 | 0.054 | 12.949 | *** | 0.754 |
The direct effects imply that retail service quality has not influenced word of mouth communication. But these influences appear to have been mediated by commitment factors, especially continuance commitment. Table 7 shows the mediating (indirect) effects.
| Table 7 Mediation Effects | ||||||||
| Mediators | ||||||||
| AFC (RSQL-->WOM) | CNC (RSQL__>WOM) | AFC + CNC (RSQL-->WOM) | CNC (AFC-->WOM) | |||||
| Effect | p | Effect | p | Effect | p | Effect | P | |
| Before Mediation | 0.038 | 0.090 | -0.087 | 0.048 | 0.190 | 0.003 | 0.558 | 0.004 |
| Mediation | 0.030 | 0.470 | -0.095 | 0.005 | 0.182 | 0.002 | 0.479 | 0.002 |
| After Mediation | 0.008 | 0.730 | 0.008 | 0.730 | 0.008 | 0.730 | 0.079 | 0.470 |
Affective commitment has not shown any mediatory influence on RSQL- WOM relationship. Though the direct effect of RSQLs on WOM before mediation (0.038, p = 0.090) has been reduced after mediation (0.008, p = 0.730), the direct path coefficients and the mediation effect (0.030, p = 0.470) are not significant. Continuance commitment, on the other hand, has mediated the relationship between RSQL and WOM, but negatively (-0.095, p = 0.005). The negative direct effect of RSQL on WOM before mediation (-0.087, p = 0.048) has been significantly reduced and after mediation, the initial negative effect has almost vanished (0.008, p = 0.739). Both the commitment factors (AFC and CNC jointly) show a strong mediatory influence (0.182, p = 0.002). The direct effect of RSQL on WOM (0.190, p = 0.003), has disappeared after mediation (0.008, p = 0.0730). Another interesting mediatory influence that emerged is that of CNC on AFC and WOM. AFC has significant direct effect on WOM before mediation (0.558, p = 0.003). But a greater part of this effect is mediated by CNC (0.479, p 0.002). After accounting for mediation effects, the direct effect of AFC on WOM becomes negligible (0.079, p = 0.470). This highlights the significance of WOM as stated by Zeithaml and Bitner, (1996).
Summary of Mediation Effects
1. Retail service quality has not influenced the word of mouth communication, but this relationship is mediated by customer commitment.
2. Among customer commitment factors, the affective commitment has no mediatory influence on the effect of retail service quality on word of mouth communication. (hypothesis 1 accepted)
3. The continuance commitment, on the other hand, has negative mediatory influence. It reduces the negative influence of retail service quality on word of mouth communication. (hypothesis 2 rejected)
4. Both affective and continuance commitments jointly mediate the influence of retail service quality on word of mouth communication. (hypothesis 3 rejected)
5. Continuance commitment also mediates the influence of affective commitment on word of mouth communication.
Moderator Effects of Demographic Variables
Moderator effects of gender, age, income, and marital status were tested using invariance tests. For each demographic variable, two models were built, one with all coefficients free (unconstrained) and the other with equalizing all structural path coefficients across the categories of each variable (constrained). The differences in model chi-square, of these two models (M2 vs M1), were tested for statistical significance. Also, differences in CFI and RMSEA were computed. If difference chi-square is significant (P<= 0.05), then we conclude that both models differ and M1 (unconstrained model), which is assumed correct is accepted, implying the possibility of moderator effects. On the other hand, if chi-square difference is not significant (p > 0.05), then we conclude that both models do not differ and M2 could also be true, implying moderator effects may not be present.
Table 8 gives model comparison details. The difference chi-square for gender is significant (p = 0.017), whereas for all other variables difference chi-squares are not significant. Hence, we can consider the possibility of gender differences in the structural configuration. To further verify the difference in individual path coefficients between females and males, we compute the critical ratio test. Hence hypothesis 4 is rejected and hypotheses 5, 6, and 7 are accepted.
| Table 8 Moderator Effects (Invariance Testing) | ||||||||||||
| χ2 | df | P | CFI | RMSEA | Δχ2 | Δdf | p | ΔCFI | ΔRMSEA | |||
| Gender | M1 | Unconstrained | 455.64 | 168 | 0 | 0.953 | 0.053 | |||||
| M2 | Constrained | 471.101 | 174 | 0 | 0.951 | 0.053 | 15.461 | 6 | 0.017 | -0 | 0 | |
| Age | M1 | Unconstrained | 633.829 | 252 | 0 | 0.937 | 0.05 | |||||
| M2 | Constrained | 652.917 | 264 | 0 | 0.936 | 0.05 | 19.088 | 12 | 0.086 | -0 | 0 | |
| Income | M1 | Unconstrained | 559.93 | 252 | 0 | 0.949 | 0.045 | |||||
| M2 | Constrained | 567.2 | 264 | 0 | 0.95 | 0.044 | 7.27 | 12 | 0.839 | 0 | -0.001 | |
| Marital Status | M1 | Unconstrained | 440.204 | 168 | 0 | 0.955 | 0.052 | |||||
| M2 | Constrained | 451.339 | 174 | 0 | 0.954 | 0.052 | 11.134 | 6 | 0.086 | -0 | 0 | |
Table 9 shows, the comparison of individual path coefficients between male and female respondents. The only difference, that we can see is the path coefficient of AFCCNC is stronger for females than males. When compared to male respondents, female respondents’ continuance commitment is strongly influenced by their affective commitment.
| Table 9 Moderator Effect of Gender | |||||
| Structural paths | Male | Female | CR | ||
| Affective Commitment | <--- | Retail Service Quality | 0.343 | 0.4 | 1.308 |
| Continuance Commitment | <--- | Retail Service Quality | -0.075 | -0 | 1.273 |
| Word of Mouth | <--- | Retail Service Quality | -0.035 | 0 | 1.158 |
| Word of Mouth | <--- | Affective Commitment | 0.121 | 0.1 | 0.479 |
| Word of Mouth | <--- | Continuance Commitment | 0.708 | 0.7 | 0.183 |
| Continuance Commitment | <--- | Affective Commitment | 0.407 | 0.9 | 3.063** |
| ** significant beyond 0.05 level | |||||
Conclusion
Retail service quality on its own does not induce respondents to communicate a positive message to others about the shopping experience through word of mouth. Emotional attachment (affective commitment) has not influenced the effect of retail service quality on word of mouth communication. But if the shoppers are compelled to shopping with the same outlet due to lack of alternative shopping sources and other advantages (continuance commitment), negative effects of service quality if any is nullified and made neutral.
Both affective and continuance commitment enhances the effect of retail service quality on word of mouth communication. The relationship among retail service quality, affective and continuance commitment factors and word of mouth communication is invariant for different levels of age, income, and marital status of retail shoppers. The relationship between affective commitment and continuance commitment is stronger in female shoppers than male shoppers. Positive word of mouth communication includes recommending a firm’s offerings, giving positive comments about service, recommending friends and relatives to buy from a recommended provider. As genders behave differently, a proper practice should be taken into consideration while providing the service. Also, Retailers should adopt all those practices of providing quality services which can result in positive word of mouth communication.
Acknowledgement
We are thankful to Dr. VSR Vijaykumar in guiding us.
References
- Alexandris, K., Dimitriadis, N., & Kasiara, A. (2001). The behavioral consequences of perceived service quality: An exploratory study in the context of private fitness clubs in Greece. European Sport Management Quarterly, 1(4), 280-299.
- Allen, N.J., & Meyer, J.P. (1990). Organizational socialization tactics: A longitudinal analysis of links to newcomers' commitment and role orientation. Academy of Management Journal, 33(4), 847-858.
- An, M.A., & Han, S.L. (2020). Effects of experiential motivation and customer engagement on customer value creation: Analysis of psychological process in the experience-based retail environment. Journal of Business Research.
- Anderson, E.W. (1998). Customer satisfaction and word of mouth. Journal of Service Research, 1(1), 5-17.
- Anderson, E.W., Fornell, C., & Lehmann, D.R. (1994). Customer satisfaction, market share, and profitability: Findings from Sweden. Journal of Marketing, 58(3), 53-66.
- Arndt, J. (1968). Selective processes in word of mouth. Journal of Advertising Research, 8(3), 19-22.
- Baker, D. A., & Crompton, J.L. (2000). Quality, satisfaction and behavioral intentions. Annals of Tourism Research, 27(3), 785-804.
- Beatty, S.E., Homer, P., & Kahle, L.R. (1988). The involvement commitment model: Theory and implications. Journal of Business Research, 16(2), 149-167.
- Bettencourt, L.A. (1997). Customer voluntary performance: Customers as partners in service delivery. Journal of Retailing, 73(3), 383.
- Bitner, M.J., & Hubbert, A.R. (1994). Encounter satisfaction versus overall satisfaction versus quality. Service quality: New directions in theory and practice, 34(2), 72-94.
- Bloemer, J.M., & Kasper, H.D. (1995). The complex relationship between consumer satisfaction and brand loyalty. Journal of Economic Psychology, 16(2), 311-329.
- Bloemer, J., De Ruyter, K.O., & Wetzels, M. (1999). Linking perceived service quality and service loyalty: a multi‐dimensional perspective. European Journal of Marketing.
- Bolton, R.N., & Drew, J.H. (1994). Linking customer satisfaction to service operations and outcomes. Service quality: New directions in theory and practice, 3(2), 173-200.
- Bolton, R.N., & Myers, M.B. (2003). Price-based global market segmentation for services. Journal of Marketing, 67(3), 108-128.
- Bone, P.F. (1995). Word-of-mouth effects on short-term and long-term product judgments. Journal of Business Research, 32(3), 213-223.
- Boulding, W., Kalra, A., Staelin, R., & Zeithaml, V.A. (1993). A dynamic process model of service quality: from expectations to behavioral intentions. Journal of Marketing Research, 30(1), 7-27.
- Brown, T.J., Barry, T.E., Dacin, P.A., & Gunst, R.F. (2005). Spreading the word: Investigating antecedents of consumers’ positive word-of-mouth intentions and behaviors in a retailing context. Journal of the Academy of Marketing Science, 33(2), 123-138.
- Burzynski, M.H., & Bayer, D.J. (1977). The effect of positive and negative prior information on motion picture appreciation. The Journal of Social Psychology, 101(2), 215-218.
- Caruana, A. (2002). Service loyalty. European journal of Marketing.
- Cronin Jr, J.J., & Taylor, S.A. (1992). Measuring service quality: a reexamination and extension. Journal of Marketing, 56(3), 55-68.
- Crosby, L.A., Evans, K.E., & Cowles, D. (1990). Relationship quality in services selling: an interpersonal influence perspective. Journal of Marketing, 54, 68-81.
- Dabholkar, P.A., Thorpe, D.I., & Rentz, J.O. (1996). A measure of service quality for retail stores: scale development and validation. Journal of the Academy of Marketing Science, 24(1).
- Danaher, P.J., & Rust, R.T. (1994). Determining the optimal level of media spending. Journal of Advertising Research, 34(1), 28-35.
- Dick, A. S., & Basu, K. (1994). Customer loyalty: toward an integrated conceptual framework. Journal of the Academy of Marketing Science, 22(2), 99-113.
- Duhan, D.F., & Sandvik, K. (2009). Outcomes of advertiser–agency relationships: The form and the role of cooperation. International Journal of Advertising, 28(5), 881-919.
- File, K.M., Judd, B.B., & Prince, R.A. (1992). Interactive marketing: the influence of participation on positive word‐of‐mouth and referrals. Journal of Services Marketing.
- Fornell, C. (1992). A national customer satisfaction barometer: The Swedish experience. Journal of Marketing, 56(1), 6-21.
- Fuentes-Blasco, M., Moliner-Velázquez, B., & Gil-Saura, I. (2017). Analyzing heterogeneity on the value, satisfaction, word-of-mouth relationship in retailing. Management Decision.
- Fullerton, G. (2011). Creating advocates: The roles of satisfaction, trust and commitment. Journal of Retailing and Consumer Services, 18(1), 92-100.
- Garbarino, E., & Johnson, M. S. (1999). The different roles of satisfaction, trust, and commitment in customer relationships. Journal of Marketing, 63(2), 70-87.
- Geyskens, I., Steenkamp, J.B.E., & Kumar, N. (1998). Generalizations about trust in marketing channel relationships using meta-analysis. International Journal of Research in Marketing, 15(3), 223-248.
- Giese, J., & Cate, A. (1999). Defining customer satisfaction. Academy of Marketing Science Review. available at: www.amsreview.org/amsrev/theory/giese00-01.html
- Goles, T., Rao, S.V., Lee, S., & Warren, J. (2009). Trust violation in electronic commerce: customer concerns and reactions. Journal of Computer Information Systems, 49(4), 1-9.
- Gruen, T.W. (1995). The outcome set of relationship marketing in consumer markets. International Business Review, 4(4), 447-469.
- Harrison-Walker, L.J. (2001). The measurement of word-of-mouth communication and an investigation of service quality and customer commitment as potential antecedents. Journal of Service Research, 4(1), 60-75.
- Hennig-Thurau, T., Gwinner, K.P., & Gremler, D.D. (2002). Understanding relationship marketing outcomes: an integration of relational benefits and relationship quality. Journal of Service Research, 4(3), 230-247.
- Herr, P.M., Kardes, F.R., & Kim, J. (1991). Effects of word-of-mouth and product-attribute information on persuasion: An accessibility-diagnosticity perspective. Journal of Consumer Research, 17(4), 454-462.
- Ifie, K., Simintiras, A.C., Dwivedi, Y., & Mavridou, V. (2018). How service quality and outcome confidence drive pre-outcome word-of-mouth. Journal of Retailing and Consumer Services, 44, 214-221.
- Iwasaki, Y., & Havitz, M.E. (1998). A path analytic model of the relationships between involvement, psychological commitment, and loyalty. Journal of Leisure Research, 30(2), 256-280.
- Jacoby, J. (1971). Model of multi-brand loyalty. Journal of Advertising Research, 11(3), 25-31.
- Jarvis, C.B., MacKenzie, S.B., & Podsakoff, P.M. (2003). A critical review of construct indicators and measurement model misspecification in marketing and consumer research. Journal of Consumer Research, 30(2), 199-218.
- Jones, H., & Farquhar, J.D. (2007). Putting it right: service failure and customer loyalty in UK banks. International Journal of Bank Marketing.
- Kasper, H. (1988). On problem perception, dissatisfaction and brand loyalty. Journal of Economic Psychology, 9, 87-97.
- Kinard, B.R., & Capella, M.L. (2006). Relationship marketing: the influence of consumer involvement on perceived service benefits. Journal of Services Marketing.
- Kuan, F.Y., Yang, Y.C., & Cheng, Y.H. (2005). Relationship between perceived quality and network word-of-mouth communication–customer commitment as mediator. Marketing Review, 2(2), 149-170.
- LaBarbera, P., & Mazursky, D. (1983). A longitudinal assessment of consumer satisfaction/dissatisfaction: the dynamic aspect of the cognitive process. Journal of Marketing Research, 20, 393-404.
- Leung, L.S.K. (2020). The Impact of Diurnal Preferences on Customer Satisfaction, Word of Mouth and Repurchasing: A Study in Indian College Online Shoppers. Asia-Pacific Journal of Management Research and Innovation, 16(1), 21-30.
- Mayer, R.C., & Schoorman, F.D. (1992). Predicting participation and production outcomes through a two-dimensional model of organizational commitment. Academy of Management Journal, 35(3), 671-684.
- Meng, M., & Sego, T. (2020). THE RELATIONSHIP BETWEEN MOBILE RETAIL SERVICE QUALITY, CUSTOMER SATISFACTION AND BEHAVIOR INTENTIONS. Academy of Marketing Studies Journal, 24(2), 1-16.
- Morgan, R.M., & Hunt, S.D. (1994). The commitment-trust theory of relationship marketing. Journal of Marketing, 58(3), 20-38.
- Newman, J., & Webel, R. (1973). Multivariate analysis of brand loyalty for major household appliances. Journal of Marketing Research, 10, 404-9.
- Ngoma, M., & Ntale, P.D. (2019). Word of mouth communication: A mediator of relationship marketing and customer loyalty. Cogent Business & Management, 6(1), 1580123.
- Ostrom, A., & Lacobucci, D. (1995). Consumer trade-offs and the evaluation of services. Journal of Marketing, 59(1), 17-28.
- Parasuraman, A., Zeithaml, V.A., & Berry, L.L. (1985). A conceptual model of service quality and its implications for future research. Journal of Marketing, 49(4), 41-50.
- Parasuraman, A., Zeithaml, V., & Berry, L. (1988). SERVQUAL: a multi-item scale for measuring consumer perceptions of service quality. Journal of Retailing, 64(1).
- Park, C.H., & Kim, Y.G. (2006). The effect of information satisfaction and relational benefit on consumers' online shopping site commitments. Journal of Electronic Commerce in Organizations (JECO), 4(1), 70-90.
- Pritchard, M.P., Howard, D.R., & Havitz, M.E. (1992). Loyalty measurement: A critical examination and theoretical extension. Leisure Sciences, 14(2), 155-164.
- Ranaweera, C., & Prabhu, J. (2003). The influence of satisfaction, trust and switching barriers on customer retention in a continuous purchasing setting. International Journal of Service Industry Management.
- Reichheld, F.F., & Sasser, W.E. (1990). Zero defeofions: Quoliiy comes to services. Harvard Business Review, 68(5), 105-111.
- Reynolds, K., & Beatty, S. (1999). Customer benefits and company consequences of customer-salesperson relationships in retailing. Journal of Retailing, 75(1), 11-32.
- Richins, M.L. (1983). Negative word-of-mouth by dissatisfied consumers: A pilot study. Journal of Marketing, 47(1), 68-78.
- Rita, P., Oliveira, T., & Farisa, A. (2019). The impact of e-service quality and customer satisfaction on customer behavior in online shopping. Heliyon, 5(10), e02690.
- Rust, R.T., & Oliver, R.L. (1994). Service quality: insights and managerial implications from the frontier. Service quality: New directions in theory and practice, 1-19.
- Singh, J., & Sirdeshmukh, D. (2000). Agency and trust mechanisms in consumer satisfaction and loyalty judgments. Journal of the Academy of Marketing Science, 28(1).
- Sivadas, E., & Baker-Prewitt, J. (2000). An examination of the relationship between service quality, customer satisfaction, and store loyalty. International Journal of Retail and Distribution Management, 28(2), 73-82.
- Spreng, R.A., & Chiou, J.S. (2002). A cross‐cultural assessment of the satisfaction formation process. European journal of Marketing.
- Spreng, R.A., & Mackoy, R.D. (1996). An empirical examination of a model of perceived service quality and satisfaction. Journal of Retailing, 72(2), 201-214.
- Swan, J. E., & Oliver, R.L. (1989). Postpurchase communications by consumers. Journal of Retailing, 65(4), 516.
- Taylor, S.A., & Baker, T.L. (1994). An assessment of the relationship between service quality and customer satisfaction in the formation of consumers' purchase intentions. Journal of Retailing, 70(2), 163-178.
- Tian-Cole, S., Crompton, J.L., & Willson, V.L. (2002). An empirical investigation of the relationships between service quality, satisfaction and behavioral intentions among visitors to a wildlife refuge. Journal of Leisure Research, 34(1), 1-24.
- Tripathi, G. (2017). Customer satisfaction and word of mouth intentions: testing the mediating effect of customer loyalty. Journal of Services Research, 17(2), 1-16.
- Wangenheim, F.V. (2005). Postswitching negative word of mouth. Journal of Service Research, 8(1), 67-78.
- Wold, H. (1975). Path models with latent variables: The NIPALS approach. In Quantitative sociology (307-357). Academic Press.
- Woodside, A.G., Frey, L.L., & Daly, R.T. (1989). Linking sort/ice anlity, customer satisfaction, and behavioral intention. Journal of Health Care Marketing, 9(4), 5-17.
- Yildiz, E. (2017). Effects of service quality on customer satisfaction, trust, customer loyalty and word of mouth: an application on cargo companies in gümüşhane. Global Journal of Economics and Business Studies, 6(12).
- Zeithaml, V.A., Berry, L.L., & Parasuraman, A. (1996). The behavioral consequences of service quality. Journal of Marketing, 60(2), 31-46.