Research Article: 2020 Vol: 24 Issue: 4
Revealed Comparative Advantage Index: An Analysis of Regional Comprehensive Economic Partnership from Indian Perspective
Dr. Monika Jain, Birla Institute of Management Technology
Abstract
India aborted the Regional Comprehensive Economic Partnership (RCEP) deal at the last moment in November 2018 over its concerns & issues not being addressed properly. This paper tries to evaluate India’s concerns and also the cost of not joining RCEP, Dairy sector, economic slowdown, past experience with FTA’s (Free trade agreements), China factor, data localization, rules of origin, experience of ASEAN countries with Sino- FTA have been some of the factors responsible for this decision. The main objectives of the paper is to study the Revealed Comparative Advantage Index of Indian exports in relation to RCEP Countries. Though a lot of literature is available where in RCA index has been used to analyse trade vis-a vis other countries and there are some studies which have used RCA index to analyse India’s trade with ASEAN countries but no study was done using RCA index for analysing India’s proposed trade with RCEP countries. Despite all the concerns it’s still in India’s favor to go ahead with the deal as RCA index portrays a different picture. The RCA index reveals that India has comparative advantage in many product categories but we have not been able to utilize our advantage and in absolute terms is reflected by widening trade deficits with RCEP countries. Paper also evaluates long term repercussion of this decision and that whether India would miss out becoming part of global value chain & having greater market access through this block. India’s experience following protectionist policies did not yield desired results in the past. So, an in-depth analysis has been done to analyze if India has made a mistake by not joining RCEP or her concerns and fears were justified.
Keywords
RCEP, FTA’s, Trade Deficit, China, Trade Agreements, ASEAN, Revealed Comparative Advantages (RCA).
JEL Classification
F31, O34, F1.
Introduction
India Decided to pull out of the Regional Comprehensive Economic Partnership (RCEP) trade deal in November last year. The mega deal if gone through would have contributed 40% of global trade, 35% of world GDP with almost half the population of the world. Combined GDP of RCEP countries was $49.5 trillion in 2017. RCEP is a proposed free trade agreement in the Asia-Pacific region between ASEAN (Indonesia, Thailand, Singapore, Malaysia, the Philippines, Vietnam, Myanmar, Brunei, Cambodia, Laos) plus six nations (Australia, China, India, Japan, New Zealand and Korea). These plus 6 nations were those who already had standalone FTA’s with ASEAN countries. There is no denying the fact that the Indian economy was slowing down pre Covid. World Bank has sharply scaled down its projections for India’s economy, forecasting 3.2 per cent contraction in the fiscal year 2020-21 because of the Covid-induced. In the second quarter of 2020 Indian economy contracted by -21%. India's trade deficit with RCEP countries has almost doubled in the last couple of years. At present, India ships 20 per cent of all its exports to the RCEP countries and receives 35 per cent of total imports from them. India has sizeable trade deficits with 13 out of 17 RCEP nations. The trade deficit from these countries which stood at $49 billion in 2010 jumped to $112 billion in 2018. Out of this $112 billion trade deficit, China accounts for $57 billion.
“As of now, India has 42 trade agreements (including preferential agreements) either in effect or signed or under negotiation or proposed”.
In case of imports growth from ASEAN countries surpassed India’s total imports growth from rest of the world. The trade deficit which stood at less than US$ 8 billion in 2009-10 jumped to about US$ 22 billion in 2018-19 (IMF) in turn moving up the share of ASEAN countries in India’s total trade deficit from 7% to 12%. In his study Alam, (2015) found that there was a structural change in India’s trade post liberalization. Ironically, this structural change has been more for imports than exports. Even though the share of developed countries has reduced in the overall trade, they still remain an important source of destinations for India’s exports. On the other hand, the Asian countries have become important sources for India’s imports. A study by Saraswat et al. (2018) for NITI Aayog highlighted that free trade agreements have not worked well for India and that there has been huge surge in the imports from these countries imports leading to huge deficits in India’s balance of trade with these nations. It studied the major 15 FTA’s signed with Sri Lanka, Malaysia, Singapore, and South Korea etc. The study found that not only FTA utilization by India has been abysmally low between 5 and 25 per cent but also net gains from these agreements. India is being seen as the prime target for its export expansion (Jennings, 2018). India’s trade deficit with China has grown significantly in the past two decades and stands at $53 billion (2018-19). Opening up of India’s market to RCEP countries which includes China would lead to an influx of cheap Chinese goods crowding out Indian market & further adding to our woes of widening trade deficit. RCEP could have been dumping ground for China’s excess production (Mazumdar, 2018). New Delhi wanted an auto trigger mechanism to shield against the onslaught of cheap Chinese goods to be included in the RCEP negotiations which would automatically snapback safeguard duties on imports if mutually agreed threshold was reached so that any damage to the domestic industries would be restricted. But no agreement on the same could be reached. Since India might have to bring down tariff to zero on almost 90% of commodities with ASEAN countries, a lot of Chinese products would come to India through that route. Hence India was looking for conservative rules of origin, so that in case of abuse of trade pact an auto-trigger mechanism should be in place to check surge in imports. Already Chinese garments are finding ways to Indian markets via South Asia Free Trade Pact and the Duty-Free Quota-Free window from Bangladesh. Australia, Japan, New Zealand & ASEAN countries have objected to India’s proposal of stricter rules of origin. Globally, the average threshold for domestic content to get originating status for a product is 40-60%. But it has met with resistance as some of the countries do not have resources or developed manufacturing sector. There is an also the fear that Indian farmers dependent on the protected sector would suffer if tariffs are liberaralized under the RCEP, allowing more imports from countries like Australia and New Zealand. Data localization was another bone of contention between India & RCEP countries.
Literature Review
Though there is lot of literature available using RCA index for other countries and a lot of studies have been conducted on analyzing India’s trade with ASEAN countries however none of the studies used RCA index for analyzing India’s trade relation with proposed RCEP countries. Balassa (1965), revealed comparative advantage (RCA) has been used in number of studies to study ability for a country to produce commodities for trade with partner countries. Leu (1998) used RCAI to measure a systematic shift of comparative advantage of ten selected East Asian countries in the US market. The author also found that Korea, Taiwan and Singapore have taken over some Japan’s export share in the US market but Hong Kong and Singapore faced higher competition from Indonesia and Malaysia respectively. Richardson & Zhang (2001) used the RCA index for determining comparative advantage for the US across time, sectors and regions. According to them there was a pattern in these and were influenced by variables such as geographical proximity, with trading partner, income etc. Yue & Hua (2002) used RCA index to explore if China's export pattern was in sync with the law of comparative advantage and if there were some regional variations in these patterns. The results of RCA indices proved that as the country liberalized and reduced barriers to trade the country moved from distortion to completely in sync with the law of comparative advantage. Bandara & Smith (2002) used RCA (Revealed Comparative Advantage) & TII Trade Intensity Index) to measure trade between Australia and SAARC nations and that Australian exporters should increase their in those sectors or commodity group in which they had a comparative advantage. Batra & Khan (2005) used Balassa’s RCA index to examine the pattern of trade flow between India and China. The index was calculated sector wise and commodity wise level based on harmonized system of classification. Kowalski & Bottini (2011) argued that even though India was relatively abundant in skilled labour and capital, its manufactured export items were strongly concentrated in low- technology items and the share of high-technology manufactured items in its total exports had barely changed since the mid of 1990s and remained under five per cent as compared to thirty per cent for China. Sanidas & Shin (2010) explored quantitatively the RCA indices between some developed Asian economies namely China, Japan and South Korea and some developing south east Asian countries for structural changes between two different time periods and concluded that only China is still in the divergence stage (industries with initial RCA become stronger while those with RCD become weaker) although on a descending trend. According to Chandran (2011) in his study analyzed 16 product group by constructing Trade Intensity Index (TII) and Revealed Comparative Index (RCA) between India & ASEAN countries. He found that India had comparative advantage in food grains, minerals, chemicals, gems and jewellery and some manufactured products while ASEAN countries had comparative advantage in producing electrical goods, electronic products, vegetable oils, rubber products and agricultural products. Francis (2011) in her analysis on trade between India & ASEAN found that ASEAN countries will have a greater market access in semi-processed and processed agricultural products in India because of tariff cuts more so by India thereby resulting in significantly reduction in domestic demand. Thus, affecting the domestic agricultural sector negatively. Bilas & Bošnjak, (2015) in their paper explored the relationship between commodity exports and revealed comparative advantage (RCA) indicators between Croatia & the European Union (EU). They explored the long and short run relationship using econometric model for the period 1995-2012. They found that Croatia had comparative advantages in the exports of raw materials, electronic machinery and vehicles to the European Union. Ashish & Kannan, (2015). In their study on India’s agro- processed products used four variants of revealed comparative advantage (RCA) indices to find out comparative advantage. They conducted study on 116 agro- processed products classifying them in three categories found that India had comparative advantage in 7 out of 32 processed animal products, 12 out of 40 processed vegetable products and 7 out of 44 processed food products for exports. Their investigation using Ballasa’s RCA Index showed that India’s was losing its RCA in processed animal & vegetable product.
Methodology
The paper uses Revealed Comparative Advantage (RCA) index to measure the trade competitiveness of India and RCEP countries. Revealed Comparative Advantage (RCA) index calculates comparative advantage in exporting certain commodities vis-a- vis its partner country in a free trade agreement or a regional economic integration. Its shows advantages & disadvantages in exporting certain commodities. The RCA index is defined as the ratio of a country’s total exports of the commodity to its total exports divided by share of world exports of the same commodity in total world export. This index was first proposed by Balassa (1965) and defined as:
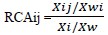
Where, RCAij = Revealed Comparative Advantage index for country i of commodity j
Xij is the ith country?s export of commodity j, Xi is the total exports of country i
Xwj is world exports of commodity j, Xw is total world exports.
This index gives values between 0 and +1. When the value is greater than one it indicates country i has a strong comparative advantage, and when the value is less than one it shows that country i has comparative disadvantage in a specified commodity. Note that the RCA is a measure of international specialization and not of international competitiveness or any other concept indicating performance. RCA is a measure of relative not absolute strength. The values of the measure imply that regardless of how poorly (or strongly) a country is performing, by definition the country will be specialized in something, and therefore will always have high values of RCA/RSCA for some sectors of the economy and low values for other sector.
The Analysis of Revealed Comparative Advantage: India
The Table 1 presents the average of Revealed Comparative Advantage index (RCA) of RCEP countries and India for the period 2000 and 2018 for 13 product categories as described by WITS (world Integrated Trade Solutions). For this purpose, annual data has been taken from the website of World Bank & WITS. Data is taken in million USD for RCA analysis. So, if we look at India’s trade with RCEP countries in the table below, India has a positive RCA in only 6 product categories out of 13 with Vietnam & Singapore, with Brunei & Cambodia in 4 product categories, and with Myanmar & Thailand in only 3 product categories. However, for Australia, New Zealand, Japan, S Korea, China, Indonesia, Malaysia and Philippines India has positive RCA in more than 8 product categories. India is at disadvantage in case of Machinery & Transport Equipment’s with all the RCEP nations except Laos. Similar is the case with Plastic & Rubber & miscellaneous products where India is placed disadvantageously. Metals & Minerals which are again raw materials to industries is where India has advantage.
| Table 1: Product Analysis RCA Index Of India’s Exports With RCEP Countries |
||||||||||||||
| Countries | Animal | Chem-icals | Food Products | Footwear | Fuels | Hides and Skins | Mach and Elec | Metals | Minerals | Miscellaneous | Plastic or Rubber | Stone and Glass | Textiles and Clothing | |
|---|---|---|---|---|---|---|---|---|---|---|---|---|---|---|
| Singapore | 0.82 | 1.36 | 0.71 | 0.79 | 2.11 | 0.77 | 0.24 | 1.89 | 1.25 | 0.36 | 0.56 | 4.50 | 2.38 | |
| Thailand | 2.81 | 2.00 | 3.61 | 1.30 | 0.30 | 1.42 | 0.39 | 1.29 | 2.23 | 0.38 | 0.52 | 4.25 | 2.00 | |
| Australia | 1.59 | 1.30 | 0.56 | 1.89 | 0.70 | 6.40 | 0.45 | 1.60 | 2.02 | 0.55 | 0.93 | 2.99 | 4.03 | |
| NewZeealand | 1.02 | 1.67 | 0.56 | 3.14 | 0.08 | 6.76 | 0.35 | 1.72 | 1.39 | 0.88 | 0.93 | 6.42 | 4.46 | |
| Japan | 2.47 | 1.37 | 1.35 | 0.46 | 0.80 | 1.08 | 0.21 | 1.09 | 4.07 | 0.25 | 0.24 | 4.90 | 1.66 | |
| S Korea | 0.45 | 1.36 | 4.13 | 0.44 | 1.33 | 2.01 | 0.17 | 1.55 | 1.92 | 0.15 | 0.27 | 1.24 | 3.65 | |
| Vietrnam | 4.21 | 2.13 | 6.31 | 0.08 | 0.14 | 1.95 | 0.33 | 0.91 | 2.85 | 0.22 | 1.16 | 0.76 | 0.74 | |
| Laos* | 0.51 | 3.83 | 0.26 | 29.37 | 0.87 | 0.55 | 1.48 | 0.06 | 0.09 | 3.66 | 2.57 | 0.21 | 0.83 | |
| Brunei** | 4.59 | 0.37 | 0.44 | 0.34 | 0.06 | 0.53 | 0.47 | 0.63 | 2.97 | 0.26 | 0.39 | 1.04 | 2.07 | |
| China | 1.57 | 1.48 | 1.08 | 7.95 | 0.13 | 2.77 | 0.13 | 1.73 | 9.16 | 0.14 | 0.81 | 3.95 | 5.13 | |
| Cambodia*** | 0.07 | 7.72 | 1.31 | 0.02 | 0.08 | 3.29 | 0.72 | 0.37 | 2.70 | 0.59 | 0.43 | 0.04 | 0.61 | |
| Indonesia | 0.89 | 2.28 | 2.92 | 1.26 | 0.29 | 1.97 | 0.52 | 1.34 | 1.62 | 0.29 | 0.64 | 1.09 | 1.13 | |
| Malaysia | 9.55 | 2.16 | 1.26 | 2.07 | 0.94 | 5.44 | 0.30 | 1.83 | 1.97 | 0.40 | 0.43 | 0.87 | 3.09 | |
| Myanmmar | 0.44 | 3.58 | 3.16 | 0.38 | 0.11 | 0.32 | 0.65 | 1.56 | 0.41 | 0.73 | 0.59 | 0.36 | 0.53 | |
| Phillippines | 8.11 | 2.74 | 1.74 | 0.36 | 0.40 | 1.85 | 0.29 | 2.22 | 1.00 | 0.40 | 1.22 | 1.12 | 1.51 | |
Source: Average data from 2010-2018 calculated by author using WITS database 2020* Average of the years trade happened between India & Laos, **There was no trade data for year 2000, ***for some products no trade happened between India & Cambodia.
Chemicals is where India has huge potential & is at advantage and India showed its supremacy while combating COVID 19 as well. Textiles & clothing, Hides & skins, Animal we are at advantage. If we analyses the comparative advantage product wise which is relative, India’s RCA in. Hides & skin with Australia is as high as 6.40 between 2010 & 2018. The absolute value of India’s exports to Australia in Hides & skins was only Rupees 11228.82 thousand USD and constituted only 2.35% of India’s exports to Australia in the year 2018. So even if we have comparative advantage some product categories, in terms of absolute number it’s very less. RCA index reveals the potential India has but it needs to be converted in advantage. If we look at Sector wise analysis of RCA data of RCEP countries baring Laos we do not have comparative advantage in Capital goods with any of the countries. India has comparative advantage with majority of countries in case of consumer goods & Intermediate goods. If we look at Intermediate goods sector India has comparative advantage with all the RCEP countries except Cambodia & Brunei which means that India exports intermediate goods to majority of RCEP countries and in some cases end up buying finished products from these same countries reminiscence of British colonialism. In case of raw materials & capital good India has major disadvantage with majority of countries. So even though we comparative advantage in case of consumer goods & Intermediate goods but we have not been able to encase these advantages and that explains why India is running deficit with 13 out of 15 RCEP proposed countries. Despite the dismal performance of India’s Exports with countries having FTA’s the RCA index gives a different picture. We do have comparative advantage with RCEP countries and need is make efforts in the right direction (Table 2).
| Table 2: Cross-Sector Analysis RCA index of India’s exports with RCEP Countries |
||||
| Countries | Capital goods | Consumer goods | Intermediate goods | Raw materials |
|---|---|---|---|---|
| Thailand | 0.49 | 0.78 | 2.20 | 0.44 |
| Australia | 0.48 | 1.29 | 1.52 | 0.66 |
| New Zealand |
0.30 | 1.34 | 1.55 | 0.50 |
| Japan | 0.26 | 1.10 | 2.27 | 0.90 |
| S Korea | 0.19 | 2.01 | 2.05 | 0.39 |
| Vietrnam* | 0.34 | 0.76 | 1.37 | 2.83 |
| Laos** | 1.04 | 0.94 | 1.25 | 0.11 |
| Brunei*** | 0.41 | 0.82 | 0.68 | 7.94 |
| China | 0.13 | 0.33 | 1.99 | 2.29 |
| Cambodia**** | 0.65 | 1.43 | 0.70 | 4.65 |
| Indonesia | 0.58 | 0.58 | 1.75 | 0.97 |
| Malaysia | 0.31 | 1.23 | 1.69 | 2.81 |
| Myanmmar***** | 0.63 | 1.29 | 1.03 | 1.28 |
| Phillippines | 0.42 | 1.24 | 1.72 | 1.97 |
Source: Average data from 2010-2018 calculated by author using WITS database 2020 *No data available for India’s exports to Vietnam for 2018 **Data was available for only 7 years for India’s exports to Laos***No trade data was available for India’s exports to Cambodia for the years 2000 & 2005**** No trade data was available for India’s exports to Myanmmar for the year 2018.
Conclusion
Joining RCEP would have meant India making maximum cuts in the existing tariff rates on account of having one of the highest average tariff rates as against the other member nations of RCEP. So probably removal of tariff barriers would not have helped us in case of our exports but could have witnessed an import surge further adding to the problem of already widening trade deficit woes with majority of RCEP nations Agreed RCEP would have been our gateway to Asia-Pacific global value chain but lack of infrastructure would have diluted this impact. The fear that China would be dumping its cheap products is not unfound. There has been great jump in anti-dumping duties against Chinese companies; highest against any country. The recent fall in GDP has been largely attributed to the falling domestic demand. The government’s decision to not join RCEP makes some sense in the short run at least and that it would protect the domestic industry from the onslaught of cheap foreign goods.
“The utilization rate of India's FTAs is very low. Most estimates put it at less than 25 per cent. RCA index reveals India’s comparative advantage in product categories and important is to utilize these advantages but so far in case of existing FTA’s we have not been able to do so and the same is reflected in widening trade deficits with these countries. Lack of information on FTAs, low margins of preference, delays and administrative costs associated with rules of origin, non-tariff measures, are major reasons for underutilization" (SBI Ecowrap, 2019).
However, the protectionist policies do not work in the long run & makes the domestic industries cumbersome & uncompetitive globally, as was evident in the pre globalization era. In fact, a big reason behind aborting RCEP deal has been competitiveness of Indian exports.
“RCEP may hit domestic producers if India fails to build capabilities” "(SBI Ecowrap, 2019).
What India should look at this as an opportunity to make structural reforms so that our industries become competitive in the long run so that not only agreements like RCEP but the existing FTA’s are fully utilized and reap the intended benefits. India should leverage its relative advantage in service sector. There is no denying the fact that international trade is an engine to growth. Professor of Economics at Columbia University and former Niti Aayog vice chairman Arvind Panagariya said, India hasn’t shut the door on the RCEP. I have always maintained that India should bargain hard in RCEP negotiations though with the intention to eventually join it.
References
- Alam, M.I. (2015). Indo-Asean Trade relation: An Analysis, Journal of International Economics (0976-0792), 6(1).
- Ashish, A., & Kannan, E. (2015). Analysis of India's Revealed Comparative Advantage in Agro-Processed Products. Indian Journal of Economics and Business, 14(1).
- Balassa, B. (1965). Trade Liberalisation and Revealed Comparative Advantage. The Manchester School, 33(2), 99-123.
- Bandara, J.S., & Smith, C. (2002). Trade Policy Reforms in South Asia and Australia-South Asia Trade: Intensities and Complementarities. South Asia Economic Journal, 3(2), 177-199.
- Batra, A., & Khan, Z. (2005). Revealed comparative advantage: An analysis for India and China (No. 168). Working paper. No. 168, Indian Council for Research on International Economic Relations (ICRIER), New Delhi
- Bilas, V., & Bošnjak, M. (2015). Revealed comparative advantage and merchandise exports: The case of merchandise trade between Croatia and the rest of the European Union member countries. Ekonomska Misao i Praksa, 1, 29-47.
- Chandran, D. (2011). Trade Complementarity and Similarity between India and ASEAN Countries in the Context of the RTA. Available at SSRN 1763299.
- Francis, S. (2011). The ASEAN-India Free Trade Agreement: A sectoral impact analysis of increased trade integration in goods. Economic and Political Weekly, 46(2), 46-55.
- Kowalski, P., & Bottini, N. (2011). Comparative advantage and export specialisation mobility. Globalisation, Comparative Advantage and the Changing Dynamics of Trade, 81.
- Leu, M.G.J. (1998). Changing comparative advantage in East Asian economies. Nanyang Technological University, School of Accountancy and Business Research Centre.
- Mazumdar, R. (2018). India Must Go Bullish on ASEAN, The Hindu Business Line, January 22,
- Richardson, J.D., & Zhang, C. (2001). Revealing comparative advantage: chaotic or coherent patterns across time and sector and US trading partner?. In Topics in Empirical International Economics: A Festschrift in Honor of Robert E. Lipsey (195-232). University of Chicago Press.
- Sanidas, E., & Shin, Y. (2010). Comparison of revealed comparative advantage indices with application to trade tendencies of East Asian countries. In 9th Korea and the World Economy Conference, Incheon.
- Saraswat, D.V., Priya, P., & Ghosh, A. (2018). A note on free trade agreements and their costs. NITI Aayog https://niti. gov. in/writereaddata/files/document_publication/FTA-NITI-FINAL.
- SBI Ecowrap. (2019). Building Capabilities must for a fruitful RCEP deal for India” Issue No. 50, FY20 Bank. https://openknowledge.worldbank.org/handle/10986/33478 License: CC BY 3.0 IGO.
- Yue, C., & Hua, P. (2002). Does comparative advantage explains export patterns in China?. China Economic Review, 13(2-3), 276-296.