Research Article: 2019 Vol: 20 Issue: 2
Revisiting the Role of a Basic Math Assessment in Predicting Student Performance in Principles of Microeconomics
Melanie A. Fennell, Randolph-Macon College
Irene R. Foster, George Washington University
Abstract
Anecdotal evidence from principles of economics faculty and previous research suggest that many students fail to comprehend foundational material in economics due to gaps in their understanding of basic math concepts. To address this issue, principles of economics faculty at this university administer a basic math assessment at the start of each fall semester. Unlike other assessments on which research has previously been conducted in this area, students are given multiple attempts to pass the assessment and are given optional review sessions in between opportunities. This paper presents results from data collected on 1104 students who completed principles of microeconomics class. Our model predicts that additional attempts on the assessment have a significant positive effect on performance in the course that diminishes as the number of attempts increases.
Keywords
Economic Education, Teaching Economics, Microeconomics, Math Assessment
Introduction
The expectation of economics faculty is that if students have been admitted into college, they should have the math skills necessary to navigate principles of economics course. However, evidence suggests that this is not the case. Previous research has shown that mastery of basic math concepts, as assessed through a basic math quiz or assessment, is integral to students’ understanding of foundational material in economics (Ballard & Johnson, 2004; Schuhmann et al., 2005; Douglas & Sulock, 1995).
To ensure mastery of basic math skills in introductory courses, principles of economics faculty at this university administer a Basic Math Assessment (BMA) at the start of the semester. The questions are simple and cover only those skills required for a micro principles class-percentage change, ratios, proportions, fractions and decimals, order of operations, place value, the area of a triangle, simple exponents, and the graph of a straight line. Students are informed two weeks before class that the BMA, worth 10% of the course grade, will be administered in the first week of class. They are pointed towards learning resources and told that calculators will not be allowed on the assessment. Any student who does not achieve an 80% (indicating mastery) on the first try has three other chances to pass the assessment during the first part of the semester. A targeted, one-hour math review is offered in between assessment opportunities. Students who do not pass the assessment, even after four attempts, are strongly encouraged to drop the class and re- enroll only after they have mastered the math prerequisite.
This paper seeks to determine if a basic math assessment with multiple attempts and optional targeted review sessions predicts better course performance. We seek to find if these additional attempts have a significant positive effect on understanding of principles of microeconomics material as measured by cumulative final exam scores.
The data used for the analysis is BMA results from the fall of 2012 at this university in the principles of microeconomics courses. The dataset contains BMA results, SAT Math scores, SAT Verbal scores, ACT Math scores, ACT English scores, student characteristics (including gender, ethnicity, attendance at public vs. private high school, and current class), and cumulative final exam scores for 1104 who registered and completed the course. Of these 1104 students, 1022 provided all characteristics asked. These 1022 students make up the sample for our analysis.
We present regression results on whether additional attempts on a basic math assessment predict better course performance as represented by students’ cumulative final exam scores. Results suggest that performance on the BMA has a positive effect on final exam scores, and additional attempts on the assessment are associated with better performance, but this effect diminishes as the number of attempts taken increases.
Literature Review
Research on the determinants of performance in principles of economics is vast. Individual research papers and surveys of the literature have found that quantitative skills, attendance, race, class, attitudes, and high school performance are all significant determinants of performance in principles of economics. (Owen, 2012; Mallik & Lodewijks, 2010; Allgood et al., 2015; Durden & Ellis, 1995; Cohn et al., 2004, Benedict & Hoag, 2002) Even where research has focused on the contribution of only certain determinants, one or more measures of quantitative skills are typically included as co-determinants of course performance and found to have a positive and significant correlation to course performance (Mallik & Lodewijk, 2010; Jensen & Owen, 2003; Ballard & Johnson, 2004; Hoag & Benedict, 2010; Douglas & Sulock, 1995; Gallo & Johnson, 2008; Schuhmann et al., 2005; Durden & Ellis, 1995). Many of these studies measure quantitative skills in a range of ways, including SAT and ACT math scores, performance in high school math classes, whether the student has taken calculus, and enrollment in a remedial math class.
Ballard & Johnson (2004) and Schuhmann et al. (2005) find that in addition to good standardized test scores, a student’s score on a basic mathematics assessment has a statistically significant positive correlation with performance in an economics course. Ballard & Johnson (2004) analyze the correlates with students’ performance in principles of economics course. They use multiple measures of math preparedness, including ACT math scores, performance on a basic math test, whether the student has taken calculus, and whether the student was required to take a remedial mathematics course. They measure performance in the course by the percentage of correct answers given over three exams in the course, all multiple-choice questions. They find that all of the measures of math skills correlate with students’ performance in a principle of microeconomics course. Their results suggest that the different measures of math preparedness reflect different quantitative skills, all of which are important to the mastery of principles of economics material. They find that a remedial math class is not correlated with better performance in economics.
Schuhmann et al. (2005) analyze the determinants of pre- and post-scores on a 10-question assessment of microeconomics and macroeconomics. Results were collected in a pre-survey given on the first day of class at multiple universities and a post-survey given on the final day of class. Students were also asked basic math questions during these surveys. When comparing the average score on math questions across time periods, the authors find no significant improvement. However, for those students who did improve their math scores throughout the course, there was a significant increase in the probability of scoring more questions correctly on the microeconomics questions.
Pozo & Stull (2006) and Lagerlof & Seltzer (2009) analyze the impact of remedial math classes on performance in principles of economics. Pozo & Stull (2006) ran a randomized experiment in principles of macroeconomics where all students were asked to complete an online basic math diagnostic test and some students were randomly assigned to have this test score count towards their overall course grade (the treatment group). Students in the treatment group were allowed to complete online tutorials and take a post-review online test to improve their scores. Students in the control group also had access to online tutorials and the post-review test, but the test did not count towards their overall grade. It is found that students who were a part of the treatment group scored higher on average on the midterm exam than students who were in the control group. They also found that the largest increase in scores was driven by the bottom half of performers in the class. Authors suggest that additional effort with respect to improving ones score has a significant positive effect on performance on the midterm exam in principles of macroeconomics. They find no evidence of improvement on the final exam.
Largerlof & Seltzer (2009) finds the opposite of Pozo & Stull (2006). Lagerlof & Seltzer (2009) finds no evidence of a positive correlation between taking a remedial math class and performance in economics courses in the UK. Starting in 1999 at this university students who performed poorly in mathematics prior to college were assigned to a remedial math course. The remedial math course covered basic math concepts. Authors ran difference in difference regressions and found that there was no impact of the remedial course on students’ performance for economics courses where mathematics is used. Authors suggest that this might be because students who attained higher math skills substitute time and effort away from these classes so they can achieve the same grade they wanted to begin with.
Douglas & Sulock (1995) analyze the determinants of course performance, adjusting for selection bias from students who drop the course. The authors give a basic math assessment as one determinant of course performance. They find that selection bias results in a negative bias on the quantified impact of math skills on course performance. When this bias is adjusted for, the impact of a basic math assessment on students’ performance in the course becomes even more positive.
The BMA covered the same topics as the basic math assessments used in previous research, but these assessments allowed for the use of a calculator, and all had a multiple-choice framework. The BMA does not allow for the use of a calculator and does not have a multiple-choice framework. All questions are open-ended, and students are required to calculate answers and supply the answer in a box provided. This is an important distinction for the type of questions being asked on these math assessments. For example, solving a system of equations can be easily solved when potential multiple-choice answers are given. Students can simply plug in the answers available and see which option is correct. In an economics course, it is important to be able to calculate these answers and not just be able to pick out the correct answer to the question. Questions on final exams at this university in the principles courses are not all multiple choice. Some questions are multiple choices, but the common questions given across all faculties in principles are open-ended, meaning students would not be able to use this rudimentary way of solving a system of equations to answer the problem.
The regression framework we use in this paper is similar to Ballard & Johnson (2004); however, these authors only allowed one attempt on the assessment. In our BMA, multiple attempts are given to students with a necessary threshold that must be met to receive 10% of the overall grade. This allows students to refresh these skills at the beginning of the semester. In Schuhmann et al. (2005), students did take the assessment twice; the second time was on the last day of the course. In this way, the assessment does not act as a learning tool but an assessment tool to deduce if any additional skills were acquired throughout the semester. By allowing students to take the assessment multiple times at the beginning of the semester, we hopefully can remind students of some of the skills they may have forgotten over time. Pozo & Stull (2006) allow students to take the math diagnostic test twice and requires completion of an online math tutorial to take the assessment a second time. The results of Pozo & Stull (2006) are for principles of macroeconomics class, where it has been found by Schuhmann et al. (2005) that understanding of principles of microeconomics concepts, rather than principles of macroeconomics concepts, are significantly impacted by improvement of math skills. Pozo & Stull (2006) also do not find a lasting impact of improved math scores on student performance in the course. Because Pozo & Stull (2006) randomize by social security number, they do not control for SAT or ACT scores.
BMA
The BMA is administered at the start of each semester at this university to principles of microeconomics students. To ensure that students take the assessment seriously, the assessment counts towards 10% of each student’s overall course grade. It is made up of 20 questions covering four topics: arithmetic, algebra, geometry, and graphing. The points are split evenly between the four topics. Students are given multiple opportunities to pass the BMA. These opportunities are scheduled every other week in order to allow students to review basic math skills on their own and partake in a targeted, one-hour review session given by teaching assistants between attempt opportunities.
To pass the assessment, students must score 80% (16 correct out of the 20 possible questions) or higher to indicate mastery of simple math skills. The pass rate was carefully chosen to allow students a few careless mistakes. Each student is given 30 minutes to complete the assessment. Once students pass, they earn the full 10% of their overall grade and do not have to take the assessment again. Students who score below 80% on an assessment do not pass the assessment. Students who do not pass the assessment after the four possible attempts receive zero percent and are encouraged to drop the class and retake it after first taking a class in remedial math.
The question is whether students should be allowed to use calculators on the assessment or not was heavily debated by the principles of economics faculty at this university. While most faculties allow students to use calculators in their classes, principles of economics faculty wanted to ensure that students knew the correct process or method to answer a problem. We ensure that questions are easy enough to be calculated by hand and that students are given ample time. Questions from an assessment given in the fall of 2012 are located in the Appendix.
Methodology
Data used in this paper is from the BMA given in the fall of 2012 at this large, private university. Initially, 1361 students were enrolled across the five sections of the course taught by three professors. 134 of the 1361 students had initially registered for the course but dropped the course before the first day of class. 123 of the 1361 students dropped the course after taking at least one attempt on the BMA. This leaves us with a sample of 1104 students who completed the course and took the final exam. Of these 1104 students, 1022 had all data available about their characteristics. Table 1 contains summary statistics of these students’ cumulative final exam scores, BMA performance, SAT Math and SAT Verbal scores, number of AP/IB courses transferred into the university, and additional characteristics. Not all students took the SAT Math and SAT Verbal for entrance to the university. Those who did not take the SAT took the ACT. All ACT scores are transformed to SAT scores using the national percentile rankings for the ACT and SAT (ACT, 2012; The College Board, 2012). This is the same method used in Dorans (1999).
| Table 1: Summary Statistics | ||||
| Mean | Std. Dev. | Min | Max | |
| Final | 68.32 | 14.39 | 2 | 98 |
| BMA Score on 1st attempt | 15.39 | 2.97 | 3 | 20 |
| BMA Score on Final attempt | 17.57 | 1.38 | 11 | 20 |
| Passed BMA on 1st attempt | 0.53 | 0.5 | 0 | 1 |
| Passed BMA on 2nd attempt | 0.34 | 0.47 | 0 | 1 |
| Passed BMA on 3rd attempt | 0.07 | 0.25 | 0 | 1 |
| Passed BMA on 4th attempt | 0.04 | 0.19 | 0 | 1 |
| SAT Math | 660 | 66 | 420 | 800 |
| SAT Verbal | 640 | 74 | 410 | 800 |
| Number of AP/IB courses | 1.91 | 2.65 | 0 | 12 |
| Freshman | 0.90 | 0.3 | 0 | 1 |
| Asian | 0.10 | 0.3 | 0 | 1 |
| Black | 0.04 | 0.2 | 0 | 1 |
| Hispanic | 0.07 | 0.26 | 0 | 1 |
| International | 0.13 | 0.34 | 0 | 1 |
| Other | 0.07 | 0.25 | 0 | 1 |
| Female | 0.47 | 0.5 | 0 | 1 |
| Private High School | 0.49 | 0.5 | 0 | 1 |
As mentioned above, students took the principles of microeconomics course across three different professors and in multiple sections. All professors at this university are required to include common problems on the final exam that have been agreed upon beforehand as critical to students’ mastery of principles of microeconomics. The average final exam score across all students was 68.32%.
BMA performance is measured in three ways: student’s BMA score on the first attempt, student’s BMA score on the final attempt, and the number of attempts it took the student to pass the BMA. The average assessment score on the first attempt was 15.39 out of a total 20 points possible. This reflects the level of basic math skills students had upon entering the course. No review sessions were given prior to the first attempt. The average assessment score on the final attempt was 17.57 out of a total 20 points possible. This reflects the basic math skills students had after all attempts were taken on the BMA. 53% of students who continued in the course passed the assessment on the first attempt, 34% passed on their second attempt, 7% passed on their third attempt, and 4% passed on their fourth attempt. 3% of students who continued in the course failed to pass the assessment after four attempts and continued in the course (Please note that these are attempts to pass, not number of assessment opportunities given. Though each student was given the opportunity to take the assessment 4 times, they were not required to take every assessment offered to them). This reflects the numbered attempt on which students mastered the basic math skills.
The average SAT Math score was 660, and the average SAT Verbal score was 640. On average, students transferred in two AP/IB courses upon entrance into the university. At this university, freshmen make up the majority of students in the principles of microeconomics course. In the fall of 2012, 90% of students who completed principles of microeconomics were freshmen. In all previous research, freshmen make up a minority of the students in the principles courses. Fifty-nine percent of students identified as white, and the rest were different ethnicities. Sixteen percent of students are classified as international. International students are defined by the admissions office as those students that are foreign nationals and applied for admission with a valid visa. Students who are US citizens, US permanent residents, or are in the US as refugees or asylum seekers are not classified as international (International Application Process, 2019). Each student is classified as only one ethnic group. Students who are biracial or do not identify as one of the ethnic groups are classified as “other” ethnicity. The ethnic diversity in our sample is unusual in this type of research. In previous research, 80-90% of students were characterized as white. Ethnicity information was received from the admissions office at this university.
Within the BMA, additional characteristics were collected on students, including gender and whether the student attended a public or private high school. Forty-seven percent of students were female. This is similar to the gender makeup of previous research. Forty-nine percent of students attended private high-school.
Research Methodology
As discussed in the literature review, it is clear that a mastery of basic math skills is necessary to fully comprehend material covered in principles of economics course. To determine if additional attempts on a basic math assessment are correlated with an increase in students’ comprehension of principles of microeconomics material, we run an OLS regression of final exam scores on students’ performance on the BMA, SAT Math scores, SAT Verbal scores, and number of AP/IB courses. This is a similar framework to Ballard & Johnson (2004). The functional form is:
Finali = β0 + β1 BMA Performancei + β2 SATMATHi + β3 SATVERBALi + β3 Number APIBi + β5 Chari + εi
Finali is student i’s cumulative final exam score measured on a scale of 0-100%. BMA Performancei is measured in three ways: student i’s initial score on the BMA, student i’s final score on the BMA, and four dummy variables indicating if student i passed on the first, second, third, or fourth attempt (if the student passed on the numbered attempt, he/she received a 1, otherwise a 0)-the omitted category is an indicator of whether the student failed. SATMATHi is student i’s SAT Math score; SATVERBALi is student i’s SAT Verbal score, Number APIBi is the number of AP/IB courses that student i transferred into the university, and Chari is a list of characteristics of student i, including gender, ethnicity, public or private high school, and class. Because the exam was given by different professors, fixed effects are included for individual professors. We run the regression including each measure of BMA performance separately and then run the regression with combinations of the measures of BMA performance and analyze for each specification if additional attempts are positively correlated with final exam scores.
Results and Discussion
Results of the regression analysis can be found in Table 2. The first column of Table 2 presents a baseline that does not include BMA performance. The next three columns present regression results when BMA performance is measured in one of three ways. In column 2, BMA performance is measured by the student’s score on the first attempt. This reflects the level of basic math skills the student had upon entering the course. In column 3, BMA performance is measured by the student’s score on the final attempt. This reflects the basic math skills the student had after all attempts were taken on the BMA. In column 4, BMA performance is measured by four dummy variables indicating if the student passed on the first, second, third, or fourth attempt. The omitted category is an indicator of whether the student failed. This reflects the numbered attempt when the student mastered the basic math skills.
| Table 2: Effect of BMA Performance on Cumulative Final Exam Score | |||||||
| Variables | (1) | (2) | (3) | (4) | (5) | (6) | (7) |
| Passed on 1st attempt | 11.99*** (2.545) |
8.990*** (2.849) |
6.879** (2.929) |
||||
| Passed on 2nd attempt | 9.286*** (2.519) |
9.375*** (2.575) |
5.586* (2.876) |
||||
| Passed on 3rd attempt | 7.638*** (2.800) |
8.054*** (2.831) |
4.084 (3.133) |
||||
| Passed on 4th attempt | 4.653 (3.081) |
6.301** (3.104) |
1.131 (3.565) |
||||
| Score on 1st attempt | 0.913*** (0.154) |
0.804*** (0.156) |
0.819*** (0.233) |
0.488* (0.259) |
|||
| Score on Final attempt | 1.343*** (0.287) |
1.061*** (0.288) |
1.044*** (0.358) |
||||
| SAT Mathematics | 0.0680*** (0.00638) |
0.0468*** (0.00720) |
0.0610*** (0.00648) |
0.0523*** (0.00696) |
0.0440*** (0.00720) |
0.0435*** (0.00726) |
0.0412*** (0.00728) |
| SAT Verbal | 0.0152** (0.00621) |
0.0164*** (0.00611) |
0.0160*** (0.00615) |
0.0152** (0.00612) |
0.0168*** (0.00607) |
0.0157** (0.00608) |
0.0165*** (0.00607) |
| Number of AP/IB Courses |
0.804*** (0.160) |
0.721*** (0.158) |
0.745*** (0.159) |
0.759*** (0.158) |
0.689*** (0.157) |
0.708*** (0.157) |
0.684*** (0.157) |
| Freshman | -4.205*** (1.322) |
-4.020*** (1.301) |
-3.957*** (1.310) |
-4.044*** (1.305) |
-3.835*** (1.294) |
-4.114*** (1.296) |
-3.869*** (1.294) |
| Asian | -3.876*** (1.336) |
-4.265*** (1.316) |
-4.344*** (1.326) |
-3.962*** (1.317) |
-4.601*** (1.311) |
-4.119*** (1.310) |
-4.482*** (1.311) |
| Black | -1.197 (2.017) |
-1.117 (1.984) |
-1.260 (1.997) |
-0.118 (2.003) |
-1.163 (1.972) |
-0.253 (1.990) |
-0.447 (1.983) |
| Hispanic | 0.148 (1.478) |
0.397 (1.454) |
-0.122 (1.464) |
0.243 (1.463) |
0.157 (1.447) |
0.148 (1.453) |
0.0365 (1.448) |
| International | 4.887*** (1.399) |
4.137*** (1.383) |
4.349*** (1.390) |
4.519*** (1.381) |
3.843*** (1.377) |
4.089*** (1.376) |
3.837*** (1.374) |
| Other Ethnicity | 2.796* (1.559) |
3.141** (1.534) |
2.562* (1.544) |
2.952* (1.539) |
2.910* (1.526) |
3.070** (1.528) |
2.894* (1.523) |
| Female | -0.334 (0.773) |
-0.00933 (0.763) |
-0.480 (0.766) |
-0.204 (0.764) |
-0.146 (0.759) |
-0.0824 (0.761) |
-0.241 (0.760) |
| Private High School | -0.963 (0.812) |
-0.684 (0.801) |
-1.001 (0.804) |
-0.951 (0.803) |
-0.733 (0.796) |
-0.879 (0.799) |
-0.866 (0.796) |
| Constant | 12.60** (5.460) |
11.44** (5.378) |
-6.916 (6.844) |
12.59** (5.854) |
-3.939 (6.783) |
7.004 (6.012) |
-2.413 (6.805) |
| Observations | 1022 | 1022 | 1022 | 1022 | 1022 | 1022 | 1022 |
| Adjusted R-squared | 0.297 | 0.319 | 0.310 | 0.317 | 0.327 | 0.326 | 0.331 |
In Column 5, BMA performance is measured by the student’s initial score on the BMA and final score on the BMA. In column 6, BMA performance is measured by the student’s initial score on the BMA and dummy variables indicating if the student passed on the first, second, third, or fourth attempt. By including score on the first attempt in columns 5 and 6, we can measure students’ initial skills with which they entered the course with to determine if additional attempts had any impact on performance in the course. The last column of Table 2 presents the nested model which includes all measures of BMA performance.
All measures of BMA performance remain statistically significant positive for all specifications of assessment performance. Column 2 is the specification that is most closely linked to the previous literature. From column 2, answering one additional question correctly on the first attempt on the BMA is associated with an increase in the final exam score by approximately one percentage point (significant at the 1% level). From column 3, answering one additional question correctly on the final attempt on the BMA is associated with an increase in the final exam score by approximately one percentage point (significant at the 1% level). From column 4, students who pass on the first attempt are predicted to score 12 percentage points higher on the final exam than students who failed (significant at the 1% level). Students who passed on the second attempt are predicted to score nine percentage points higher on the final exam than students who failed (significant at the 5% level). Students who passed on the third attempt are predicted to score eight percentage points higher on the final exam than those who failed (significant at the 5% level). The performance of students who passed on the fourth attempt is not predicted to score significantly differently than those students who failed. Results from columns 3 and 4 suggest that additional attempts have a significant positive effect on performance in the course, but we do not know if the measures of BMA performance are simply proxying for the score on the initial attempt. This is why we include multiple measures of performance in the next three columns.
From column 5, when including both the score on the first attempt and final attempt, the coefficients on BMA performance remain very similar to those from columns 2 and 3. The statistical significance and positive sign on the coefficient for score on the final attempt provides evidence that allowing for at least one additional attempt at the assessment has a positive effect on performance in the course. However, we cannot determine if only one additional attempt or multiple additional attempts significantly impact performance.
In column 6, again, coefficients on BMA performance remain similar to those found in columns 2 and 4. Holding students’ scores on their initial attempt constant, students who pass on the first attempt are predicted to score nine percentage points higher on the final exam than students who failed (significant at the 1% level). Students who pass on the second attempt are predicted to score nine percentage points higher on the final exam than students who failed (significant at the 5% level). Students who pass on the third attempt are predicted to score eight percentage points higher on the final exam than students who failed (significant at the 5% level). Students who pass on the fourth attempt are predicted to score six percentage points higher on the final exam than students who failed (significant at the 5% level). Again, results provide evidence that additional attempts on the assessment have a positive effect on performance in the course that eventually diminishes as the number of attempts increases. This is our preferred specification of the regression equation as it allows us to take into account all attempts on the assessment and therefore allows us to identify if more than one additional attempt on the assessment impacts performance.
In column 7, all measures of BMA performance are statistically significant. The coefficient on initial score is slightly lower than previous specifications. Now, answering one additional question correctly on the first attempt on the BMA is associated with an increase in the final exam score by approximately one-half of a percentage point (significant at the 10% level). Similar to columns 3 and 5, answering one additional question correctly on the final attempt on the BMA is associated with an increase in the final exam score by approximately one percentage point (significant at the 1% level). The coefficients on the dummy variables are slightly lower from previous specifications, but the interpretation of these coefficients differs than those coefficients in columns 4 and 6. Now we are holding the final score attained over all attempts constant and analyzing how passing on a numbered attempt improves performance on the final exam. Holding students’ scores on the initial and final attempt constant, students who pass on the first attempt are predicted to score seven percentage points higher than students who fail. Students who pass on the second attempt are predicted to score six percentage points higher than students who fail. These results again provide evidence that additional attempts on the assessment have a significant positive effect on performance and that additional attempts yield a positive and diminishing effect as the number of attempts increases.
Coefficients on the rest of the variables in the regression equation remain relatively consistent no matter the specification of BMA performance. A one-point increase in a student’s SAT Math score is associated with an increase in the final exam score by 0.04-0.06 percentage points (significant at the 1% level). One additional AP/IB course is associated with an increase in the final exam score by 0.7-percentage points. Freshmen are predicted to score four points lower than all other students on the final exam. These results are consistent with results found in previous research, including Ballard & Johnson (2004).
Students of Asian ethnicity are predicted to score four points lower on the final exam than students of white ethnicity. International students are predicted to score four points higher on the final exam than students of white ethnicity. Students of “other” ethnicity are predicted to score three points higher on the final exam than students of white ethnicity. These results differ from what has been found in previous research, where no ethnicity factors have shown to be statistically significant. This is likely because there was more representation across different ethnicities at this university.
Comparing adjusted R2 in column 1 to all other columns of Table 2 shows that there is an improvement of fit when BMA performance is included in the regression equation. This observation and statistical significance of all measures of BMA performance confirms the conclusions of Ballard & Johnson (2004) that multiple measures of quantitative skills explain students’ performance in principles of microeconomics. Adjusted R2 is very close for each specification of BMA performance and increases when multiple measures of BMA performance are included.
These results suggest that additional attempts on a basic math assessment with the opportunity of partaking in a brief review of targeted material are associated with better performance in principles of microeconomics. This is a unique result and adds to the current literature. Similar to Ballard & Johnson (2004) and Schuhmann et al. (2005), we find that a basic math assessment is a significant determinant of performance in principles of economics course. However, these authors do not allow multiple attempts on the assessment prior to the end of the course. Similar to Pozo & Stull (2006), we find that additional attempts on the assessment improve performance in principle of economics. However, Pozo & Stull (2006) analyze their results for principles of macroeconomics class where it has been found by Schuhmann et al. (2005) that understanding of principles of microeconomics concepts, rather than principles of macroeconomics concepts, is significantly impacted by improvement of math skills. Pozo & Stull (2006) also do not find a lasting impact of improved math scores on student performance in the course. We find a long-lasting impact of additional attempts on performance in principles of microeconomics. In no other research that the authors have found has anyone required mastery of basic math skills as represented by a particular score on a basic math assessment or analyzed the impact on course performance in principles of economics of taking more than two attempts on a basic math assessment.
There may be concern that we do not include a measure of whether the student took calculus or took principles of economics course as determinants of performance in the course. We did not collect this information, but we do have information on whether the student submitted AP/IB calculus and AP/IB economics credits upon entrance to the university. This is not a perfect measure of whether a student took calculus or economics previous to taking the course as not all students submit AP/IB scores to the university. When including these variables in the regression, the coefficient on having taken API/IB economics is positive but not statistically significantly different from zero. The coefficient on having taken AP/IB calculus is positive and significant. Coefficients on all other variables remain the same and therefore robust to adding these variables.
It may be suggested that students who passed the BMA on an earlier attempt performed better than those who failed for psychological reasons. Students who failed may have felt labeled as failures and therefore performed poorly on the final exam. If so, this could be driving our results. However, if we replace the BMA measure number of attempts to pass with number of attempts taken irrespective of whether the student passed, the results above continue to hold. Only half of students who failed took four attempts to pass. The rest took between one and three attempts to pass. Therefore, it is not a psychological effect that is driving these results.
A significant problem in all of the literature in this area is differentiating between attained basic math skills and effort. In previous literature where multiple attempts have been taken, it is assumed that the impact is a combined effect of effort and additional math skills learned.
There may also be some bias to this result because 134 students dropped the course after taking the BMA. However, the average SAT Math score for students that dropped the course is statistically significantly lower than the rest of the class, suggesting that weaker students dropped the course that would have likely performed worse in the course than their counterparts. An analysis of the performance of students who drop principles of economics courses was done in Boshhardt (2004), and it is found that students with lower GPAs and lower test scores are more likely to drop a course. We suggest that ignoring students who dropped the course from our analysis creates a downward bias on our results. Douglas & Sulock (1995) find that correcting for selection bias resulting from students who drop principles of economics strengthens the estimated coefficient on a math preparation exam given at the beginning of the class.
Conclusion
Research suggests that a good knowledge of mathematics aids students in understanding economic concepts. Principles of economics faculty at this university administer a Basic Math Assessment (BMA) at the start of the semester in principles of microeconomics. The questions are simple and cover only those skills required for a principles class - percentage change, ratios, proportions, fractions and decimals, order of operations, place value, the area of a triangle, simple exponents, and the graph of a straight line. Students are given multiple attempts to pass in the beginning of the semester with optional review sessions between attempts.
This paper continues the work of previous researchers to determine if a basic math quiz or assessment predicts better course performance. Using primary data collected on 1104 students who completed principles of microeconomics class, we analyzed whether additional attempts on a basic math assessment were correlated with better performance in principles of microeconomics as measured by cumulative final exam scores. We found that additional attempts on the assessment have a positive effect on performance in the course that diminishes as the number of attempts increases, holding the student’s initial scores constant. These results suggest that additional attempts on a basic math assessment with the opportunity of partaking in a brief review of targeted material are associated with better performance in principles of microeconomics. We cannot ensure that this improvement in performance is causally due to an improvement in students basic math skills as it is also possible that the positive correlation is due to increased effort by students rather than improvement of skills.
Appendix
I.
1. Express $2.56 trillion in dollars.
2. Express $2.56 trillion in billions of dollars.
3. If it takes 30 minutes to cook a one pound piece of pork, how many minutes will it take to cook two and a half pounds of pork?
4. Express 2/5 as a decimal.
5. Express 2/6 as a percent. (Please round your answer to 2 decimal places).
6. Solve 5[2(42-32)-4]
7. When the iPhone was released in June 2007, it sold for $600. By September, the price had fallen to $400. What was the percent change in price of the iPhone between June and September? (Please round your answer to 2 decimal places).
II.
1. Solve for n in the following equation: 
2. Solve for x and y: 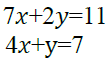
3. Consider the following equation 4P+18Q=12-2P. Solve for P in terms of Q.
4. What is the slope of 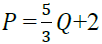 if P is on the vertical axis and Q is on the horizontal axis?
(Please answer as a fraction).
if P is on the vertical axis and Q is on the horizontal axis?
(Please answer as a fraction).
III.
1. Calculate the area of the figure below (include units).

2. Calculate the area of the figure below (include units).

IV.
1. Plot the following points on the graph below (16, 0), (8, 6), (12, 3), (0, 12), and (4, 9) and connect them with a straight line.
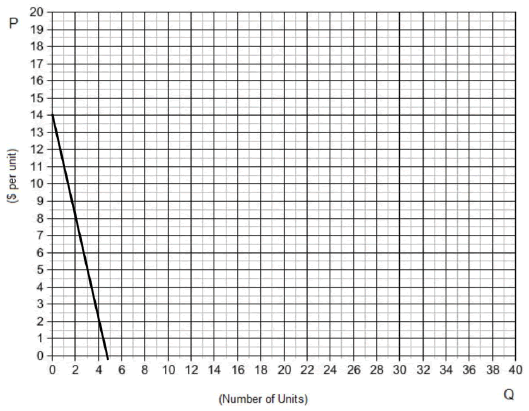
a. Write the equation of the line drawn above.
b. Find the area of the triangle created by the horizontal axis, vertical axis, and the line drawn above (include units).
Approval
This research was granted exemption from Institutional Review Board at this institution.
Acknowledgements
We thank Tara Sinclair and Barry Pfitzner for their valuable comments and feedback. And, our thanks to Cheryl Beil & Stephen Ehrmann for their interest and support of this research.
References
- ACT, Inc. (n.d.). ACT profile report-national-graduating class 2012. Retrieved from www.act.org/content/dam/act/unsecured/.../Natl-Scores-2012-National2012.pdf
- Allgood, S., Walstad, W.B., & Siegfried, J.J. (2015). Research on teaching economics to undergraduates. Journal of Economic Literature, 53(2), 285-325.
- Ballard, C.L., & Johnson, M.F. (2004). Basic math skills and performance in an introductory economics class. The Journal of Economic Education, 35(1), 3-23.
- Benedict, M.E., & Hoag, J. (2002). Who’s afraid of their economics classes? Why are students apprehensive about introductory economic courses? An empirical investigation. The American Economist, 46(2), 31-44.
- Boshhardt, W. (2004) Student drops and failure in principles courses. Journal of Economic Education, 35(2), 111- 128.
- Cohn, E., Cohn, S., & Balch, D.C. (2004). The relation between student attitudes toward graphs and performance in economics. The American Economist, 48(2), 41-52.
- Dorans, N.J. (1999). Correspondences between ACT™ and SAT® I scores. ETS Research Report Series, 1999(1), 1-18.
- Douglas, S., & Sulock, J. (1995). Estimating educational production functions with correction for drops. The Journal of Economic Education, 26(2), 101-112.
- Durden, G.C., & Ellis, L.V. (1995). The effects of attendance on student learning in principles of economics. The American Economic Review, 85(2), 343-346.
- Gallo, A.A., & Johnson, C.K. (2008). Math skills and everyday problem solving. Journal of Economic and Finance Education, 7(1), 7-20.
- Hoag, J., & Benedict, M.E. (2010). What influence does mathematics preparation and performance have on performance in first economics classes? Journal of Economics and Economics Education Research, 11 (1), 19-42.
- International Application Process. (2019). GW office of undergraduate admissions.
- Jensen, E.J., & Owen, A.L. (2003). Appealing to good students in introductory economics. The Journal of Economic Education, 34(4), 299-325
- Lagerlof, J.N.M., & Seltzer, A.J. (2009). The effects of remedial mathematics on the learning of economics: Evidence from a natural experiment. The Journal of Economic Education, 40(2), 114-137.
- Mallik, G., & Lodewijks, J. (2010). Student performance in a large first year economics subject: Which variables are significant? Economic Papers: A Journal of Applied Economics and Policy, 29(1), 80-86.
- Owen, A.L. (2012) Student characteristics, behavior, and performance in economics classes. International Handbook on Teaching and Learning Economics. Elgar, Edward Publishing, Inc.
- Pozo, S., & Stull, C.A. (2006). Requiring a math skills unit: Results of a randomized experiment. American Economic Review, 96(2), 437-441.
- Schuhmann, P., McGoldrick, K., & Burrus, R. (2005). Student quantitative literacy: Importance, measurement, and correlation with economic literacy. The American Economist, 49(4), 49-65.
- The College Board. (2012). SAT percentile ranks-2012 college-bound seniors-critical reading, mathematics, and writing percentile ranks. The College Board.