Research Article: 2023 Vol: 27 Issue: 5
Satisfaction-Importance Matrix: Measuring Customer Satisfaction In Mobile Sector
Prasanna Mohan Raj, Alliance University, Bangalore
Akanksha Choubey, Alliance University, Bangalore
Citation Information: Raj, P.M & Choubey, A. (2023). Satisfaction-importance matrix: measuring customer satisfaction in mobile sector. Academy of Marketing Studies Journal, 27(5), 1-11.
Abstract
India’s telecommunication network is one of the largest in the world providing wide-ranging services such as basic, cellular, internet, radio paging, VSAT. The Research findings of Ovum, the reputed international agency, say that Indian mobile industry is a major contributor to the social and economic growth of the country. It is quite evident that competition is increasing among players in mobile industry. The increased competition has reduced the price of service and customers are bombarded with various services and changing tariff plans. Differentiation from competitors is the need of the day for service providers to lead the market. So, it is momentous for mobile service brands to understand the gap between expectations and perceptions of quality among customers, so that they can retain them as well as attract new customers. This paper tries at identifying the key factors responsible for customer preferences for Mobile service brands by using factor analysis. This study analyzes satisfaction level for four major brands (BSNL, Vodafone Idea, Airtel and Jio) in above key factors. This paper also captures the Importance-satisfaction matrix for four major brands which will offer valid suggestions.
Keywords
Customers’ Expectations, Customers’ perception, Customers’ Satisfaction, Importance- Satisfaction Matrix, The Noel-Levitz Instrument.
Introduction
India’s telecommunication network is one of the largest in the world providing wide-ranging services such as basic, cellular, internet, radio paging, VSAT. With a 1.17 Bn subscriber base (wireless + wireline subscribers) as of August 2022, India's telecom sector is the second biggest in the world. India has an overall tele-density of 85.15%, of which the rural market, which is mainly untapped, has a tele-density of 58.44%, and the urban market has a tele-density of 134.71%. This industry is the largest employer and has given rise to several ancillary sectors, including real estate, catering, security, housekeeping, and transit. Direct employment in the telecom sector was 5.1million in FY 2021-2022 (E) with an addition of 4,45,000 people (consisting of ~ 36 percent women workers). Over 12.0 million indirect jobs were created. On September 15, 2021, the Union Cabinet approved significant structural and procedural changes in the telecom sector with the goals of preserving and expanding employment opportunities, fostering healthy competition, safeguarding the interests of consumers, injecting liquidity, encouraging investment, and easing regulatory burdens on telecom service providers.
85% of India's populace now has access to 4G mobile coverage, according to data from Telecom Service Providers (TSPs). This extensive 4G rollout has stimulated economic activity nationwide, leading to expansion and the creation of new job possibilities. Regarding 5G, Indian TSPs have been given permission to perform trials for the use and applications of the technology. The Department of Telecommunications has established a Technology Study Group on 6G with the goal of driving innovations in the following stage of technological growth.
The potential for growth is massive, but significant investment will be required to improve the quality of the service for the existing customer. There are still unserved segments of the population, but they are likely to be very low ARPU (Average Revenue per User) customers; operators could find it difficult to generate a return for these segments. Large players will have an advantage as they expand their presence and take advantage of economies of scale. But even they will face tremendous challenges in finding the right balance between yield and market share. Customers with low disposable incomes will form a significant proportion of the base
If the mobility is what a user wants, the most important decision they make regarding their service may not have anything to do with the special features usually considered important. The fact remains that Indian users are getting used to using their phones to do more. There is a huge nationwide uptake on services like railway booking checks, for example. Long-distance tickets are often bought “waitlisted” in India, whereby lists clear up as the journey date nears, so users send an SMS to their passenger record numbers to get an updated status of their coach and berth numbers when confirmed. Credit card and bank account alerts have also picked up in many areas as banks increasingly computerize their systems and as credit card usage increases. There are special services like stock market applications are offered by the service provider to track stocks and portfolio values. The Indian consumers also call for innovative Value-added services that will augment the core product.
Another issue that is quite evident in Indian spectrum is increasing competition among players in mobile industry. The increased competition has reduced the price of service and customers are bombarded with various services and changing tariff plans. So, an effort to differentiate from competitors is the need of the day for service providers to lead the market. So, it is momentous for mobile service brands to understand the gap between expectations and perceptions of quality among customers, so that they can retain them as well as attract new customers by filling up this gap and earn significant portion of revenue out of their pocket. Marketers should broaden their customer base in line with retaining its existing customers. Brand loyalty will function like insulator for brands which prevent competitors to grab their customers. Customer Satisfaction is decisive component for creating loyal customer base. Unless, customers are satisfied, they may not be truly loyal to the brand.
This paper tries at identifying the key factors responsible for customer preferences for Mobile service brands. This study analyzes satisfaction level for four major brands (BSNL, Hutch, Airtel, and Aircel) in above key factors. This paper also captures the Importance-satisfaction matrix for four major brands which will offer the valid suggestions.
An Overview of Indian Mobile Communication Sector
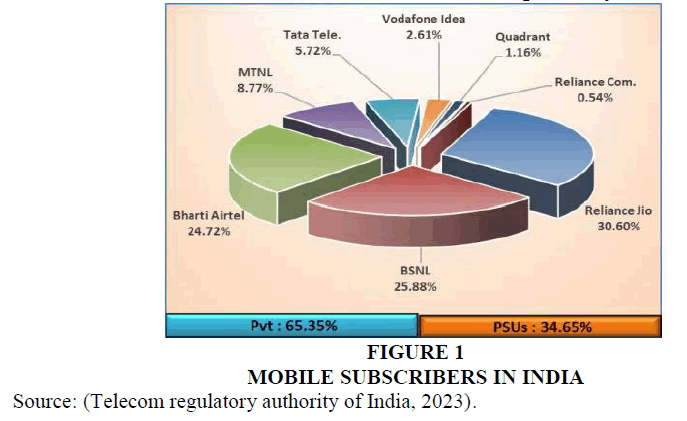
According to a report released by the TRAI, the amount of FDI inflow into the telecom industry increased by 8.2% of all FDI from April 2008 to March 2019, totaling US$ 30,284 million. In December 2021, India's subscriber population totaled 1178.41 million. In December 2021, the tele-density of rural users was 44.40%. The total amount of wireless internet data used in India grew from roughly 4,200 petabytes in 2018 to 32,397 petabytes in 2021, a nearly 7-fold increase. By 2026, 350 million 5G subscriptions in India will exist, making up 27% of all mobile subscribers. India will require 22 million skilled employees in 5G-focused industries by 2025, including cloud computing, robotics, and the Internet of Things (IoT) Figure 1.
By the close of December 2022, there were 27.45 million wireline subscribers, up from 27.13 million at the end of November 22. With a monthly growth rate of 1.18%, the wireline subscriber base saw a net rise of 0.32 million. At the end of December 2022, the proportion of urban and rural wireline subscribers in the overall subscriber base was 92.35% and 7.65%, respectively. From 1.96% at the end of November to 1.98% at the end of December, India's overall wireline tele-density rose. During the same time span, the urban and rural wireline tele-densities were 5.21 and 0.23%, respectively.
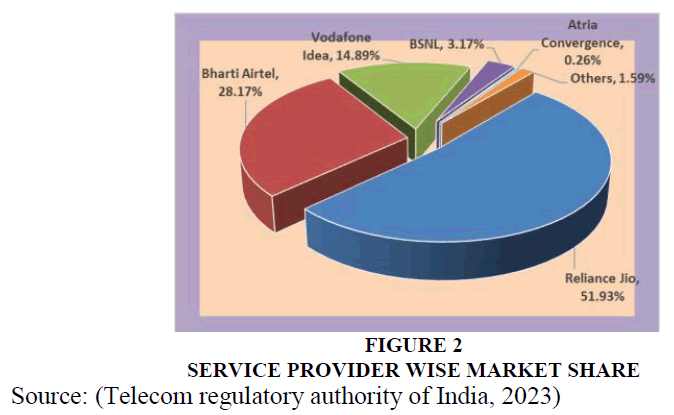
Reliance Jio InfoComm Ltd (7.65 million subscribers), Bharti Airtel (5.71 million), BSNL (4.11 million), Atria Convergence Technologies (2.14 million), and Hathway Cable & Datacom were the top five mobile service carriers as of December 31, 2022. (1.13 million). The top five mobile service companies as of December 31, 2022, were Reliance Jio Infocom Ltd (424.52 million subscribers), Bharti Airtel (228.76 million subscribers), Vodafone Idea (123.87 million subscribers), BSNL (22.24 million subscribers), and Intech Online Pvt. Ltd. (0.23 million) Figure 2
GSM was first introduced in 1991 and until recently before the establishment of CDMA networks; the mobile industry in India is divided between the two technologies-GSM and CDMA. Whether GSM is better, or CDMA is more superior is certainly a debatable issue, GSM has continued to be the dominant technology in the mobile market. As per the present scenario of the country, most GSM operators have concentrated their efforts on expanding their subscriber numbers in volumes; these service providers have specifically targeted B and C class cities, which are considered less lucrative. Increasingly the focus is on these areas and specifically semi-urban and rural areas3.
GSM has been the prime growth driver of Telecom services in India and continue to be the same for new evolving technologies and will contribute to the growth and prosperity of the industry. In India GSM technology is enjoying advantages over other cellular technologies like widest choice of handsets with widespread sales and service distribution network and Handset availability in all price segments and ongoing introduction of wide variety to meet customer requirements. Subscription process (SIM based) is made easier in GSM.
The Growth of GSM mobiles is remarkable in the last five years. 15 million GSM subscribers in the first quarter of 2003 had been increased to 120 million in Q1 2007. The Growth GSM scene in India has shown better growth potential in coming years4.
Currently, pre-paid users account for 77-78 per cent of users. “By end-2009, this share is likely to go up to around 88 per cent.5 As it is evident that prepaid is the most popular service in the mobile industry of India, so a comprehensive analysis will give a true picture of satisfaction level of majority of mobile users in India. To survive in this competitive and demanding atmosphere players must satisfy customers in basic service area. Apart from this prerequisite, there is also a need to provide Value added services with technological advancements. This study is focused on analyzing the gap between the expectation and perception of customers related to various service variables in telecom industry. This study has focused on 4 major players Hutch, Airtel, Aircel, and BSNL. The performance of these brands is analyzed by Importance-Satisfaction Matrix. This Matrix involves 4 quadrants based on the variation in the expectation - perception scale.
Literature Review
Customer Satisfaction is critical component for profitability of business. The concept of customer satisfaction has attracted much attention in recent years. Building on a loyal customer or user base is the best and easiest way to grow the business. Customer loyalty is an important strategic objective for all mangers. A survey of Chief Executive Officers (CEO) conducted by the conference board found that retaining the customers was the most important challenge in their business (Bell, 2002). Loyal customers are most valuable to the companies as they are easier to serve, and they provide higher and long- term profitability (Taylor, 2007). Brand loyalty (Oliver ,1999) is defined as “a deeply held commitment to rebuy or repatronize a preferred product/service consistently in the future, thereby causing repetitive same-brand or same brand-set purchasing, despite situational influences and marketing efforts are having the potential to cause switching behavior. Early Research works had found strong link between Satisfaction and the Brand loyalty. (Bruce Cooil, Keiningham, Timothy L., Lerzan Aksoy, 2006; Bernhardt, Kenneth, 2000; Robert A.Peterson, 1992; Sharma & Choubey, 2020).
Customer Satisfaction is the Major factor, which influence the loyalty behavior. An increase in the amount of satisfaction goes along with an increase in the loyalty (Jose, 1995). The Research has also that the nature of the relationship between satisfaction and consumer behavior (repurchase intention and retention) is moderated by the differentiating characteristics of various customer groups (e.g., age, sex, education) (Mittal, 1996). There are several key benefits of high customer satisfaction to the firm, which include increased loyalty for current customers, reduced price elasticities, insulation of current customers from competitive efforts, lower costs of future transactions, reduced failure costs, lower costs of attracting new customers, and an enhanced reputation for the firm (Fornell ,1992; Sharma & Choubey, 2021)
The crucial role of satisfaction in influencing customer retention was viewed as a prerequisite for loyalty formation (Anderson & Fornell 1994; Patterson, Johnson & Spreng, 1997). Musa & palister has proved the linear relationship between satisfaction and loyalty has been supported empirically by many authors.
Oliver Definition of Satisfactions is Widely Accepted Would be the Following
“Satisfaction is the consumer’s fulfillment response. It is a judgment that a product or service feature, or the product of service itself, provided (or is providing) a pleasurable level of consumption-related fulfillment, including levels of under- or over- fulfillment…” (Oliver, R.1997). The macro model of satisfaction developed by Woodruff & Gardial, 2021, has found that Satisfaction feeling is a state of mind, an attitude and Perceived is confirmation is the evaluation of perceived performance according to one or more comparison standards. Disconfirmation can have a positive effect (generally implying a satisfying result), a negative effect (generally implying a dissatisfying result), or a zero effect (Woodruff ,1996). But other model (Bitner & Hubbert, 1994) supports the conceptualization of perceived quality as a separate construct, distinct from satisfaction. Furthermore, it highlights the construct of a “global” level of satisfaction (the overall service satisfaction) in contrast to the construct of a component level of satisfaction (the encounter service satisfaction). Norms Models resemble the Expectations Disconfirmation Model in that the consumer compares perceived performance with some standard for performance. In this case, however, the standard is not a predictive expectation. Rather than considering what will happen in the consumption experience, the consumer uses what should happen as the comparison standard.
Customer satisfaction research in services encompasses service quality. Service quality and customer satisfaction are widely recognized as key influences in the formation of customers’ purchase intention in service environments (Steven, 1994). Customers perceive service in terms of the quality of the service and how satisfied they are overall with their experiences. The two concepts are fundamentally different in terms of their underlying causes and outcomes (Zeithaml, 2005; (Raj, 2021). She added although they have certain things common, satisfaction is generally viewed as a broader concept, whereas service quality assessment focuses specifically on dimensions of service. According to the view, perceived service quality is a component of customer satisfaction.
Research Objectives
➢ To identify the factors influencing customers’ preference in choosing brands in Mobile telecommunication market.
➢ To measure the customers’ satisfaction in above important factors for all mobile service providers taken for the study
➢ To develop the “Importance-Satisfaction Matrix” for all mobile service providers taken for the study.
➢ To suggest the suitable strategies to increase the customer satisfaction level.
Research Methodology
Research Design
In This study descriptive research design was followed in this research because the information collected was intended to be used to describe the customers’ preferences and satisfaction in the study area.
Questionnaire Design
The Noel-Levitz instrument was used in the as survey instrument after conducting the reliability and validity tests. The data is subjected to reliability test and factor analysis. Factor analysis delivers the results of convergent validity. The value Cronbach alpha was calculated for all 19 attributes. The value of reliability coefficient is about .71, a well-accepted value for showing reliability of the data (Cronbach alpha values and KMO values of factor analysis for the 19 The respondents were asked to the rate to which extent they think firms offering telecom services should possess these parameters described by each statement (Customers’ expectations). They are also asked rate their satisfaction level of that features offered by their mobile service provider. Respondents rate each item in the inventory on a 1-7 scale by its “importance” of the specific expectation as well as their “satisfaction” with how well that expectation is being met.
Sample Characteristics
Sample size of 138 respondents was selected for survey. The sampling technique used for the survey was convenient sampling. The primary data collected using pilot tested questionnaire. The respondents were spread across all service providers. This study is pertained to pre-paid users of GSM service providers.
Results and Discussion
Factor analysis identifies the Underlying Dimensions or factors that explain the correlation among a set of variables. In this study, Factor analysis is used to identify the underlying dimensions, which influence the customer preference of brands in mobile service providers which will address the first objective Droge (1998). Principle Component Analysis is the commonly used method for grouping the variables under few unrelated factors. Variables with a factor loading of higher than 0.5, are grouped under a factor. A factor loading is the correlation between the original variable with the specified factor and is the key to understanding the nature of the factor. In this study, Principal Component analysis has been used since the objective is to summarize most of the original information in a minimum number of factors for prediction purposes. Here the factors are extracted in such a way that factor axes are maintained at 90 degrees, meaning that each factor is independent of all others. Varimax rotation is used in this study to simplify the factor structure. Only the factors having the Eigen values greater than unity are considered. An Eigen value is the column sum of squares for a factor. It represents amount of variance in the data. The 19 Variables used for the factor analysis were coded using the seven-point importance (Noel-Levitz instrument) scale. The table shown in Exhibit provides the Varimax rotated factor loadings. This was obtained in 7 iterations through 11th Version of SPSS Dietz (1997).
Factor analysis using Varimax rotation finds 5 derived factors, each having eigen value greater than unity. In the rotated factor matrix, those variables which had factor loading of above 0.50 (ignoring signs) are grouped under their respective derived factors. Thus the 17 variables were loaded on the five factors Dell (2002).
Factor- 1 (F1) has an eigen value of 4.076 and explains 20.98% of total variance. The eigen values of the second factor, third factor, fourth factor and fifth factor are 3.833, 2.464, 1.920 and 1.529, respectively Bloemer & Kasper (1995) the total variance accounted for by all the five factors was 72.74% which is quite high. This establishes the validity of the study Bai et al. (2007) Table 1.
| Table 1 Rotated Component Matrix | |||||
| Component | 1 | 2 | 3 | 4 | 5 |
| E1 | 0.612 | ||||
| E2 | 0.896 | ||||
| E3 | 0.829 | ||||
| E4 | 0.850 | ||||
| E5 | 0.834 | ||||
| E6 | 0.947 | ||||
| E7 | 0.585 | ||||
| E8 | 0.951 | ||||
| E9 | 0.845 | ||||
| E11 | |||||
| E12 | |||||
| E15 | 0.873 | ||||
| E17 | 0.872 | ||||
| E18 | |||||
| E19 | 0.872 | ||||
| E20 | 0.741 | ||||
| E21 | 0.879 | ||||
| E22 | 0.630 | ||||
| E23 | 0.824 | ||||
The first factor (F1) known with Value added services of Mobile services are quick activation of number, connecting calls easily, Speedy delivery of SMS and voice clarity on network and facing no problems in getting calls from any other network. These are the core service product of Mobile service providers, which may be the common expectation of customers. The Second factor (F2) identified with Value added services of Mobile services are Song options for dialer tones, Facility of getting missed calls while cell is switched off, Getting news, jokes & cricket score, and Availability of booster re-charge. These are value added services of mobile service providers, which may be the used as differentiating platform for most of the service providers. The Third factor (F3) identified with Recharging options in Mobile services like Recharging without hassles through coupons, Recharging Without hassles through Easy deal and various price Options in Recharge coupons. This recharging comfortability is the key to be successful in the pre-paid segment. The Fourth factor (F4) identified with Customer care services like Easy connection with customer care and knowledgeable customer care executives. The Fifth factor (F5) deals with Technological part and internet support. This factor is identified with GPRS connection and Recharging through internet.
Importance-satisfaction Analysis
To analysis, Authors have decided the score of “4” as the threshold level. Satisfaction score of 4 and above are classified as satisfied and below 4 as not satisfied. The same criterion is applicable to Expectations of the customers. The reason being that 4 is the average of the scale (1-7) used for getting responses from the customers. Using the criterion, the various attributes are distributed in four quadrants.
➢ “High-high” quadrant refers to the quadrant in which the expectations of the customers are high, and their satisfaction levels are also high. This quadrant gives the strengths of the service provider.
➢ High-Low” refers to the quadrant where the expectations of the customers are high but their satisfaction with the service provider is less. This quadrant has the greatest significance as it reveals the weaknesses of the service providers.
➢ “Low-high” refers to the quadrant in which the expectations of the customers are low, but satisfaction levels of the customers are high.
➢ “Low-Low” refers to the quadrant in which both the levels of expectation and satisfaction from the attributes are less Table 2.
| Table 2 Key Factors Influencing Customer in Mobile Services | ||||
| Basic service/Network performance | Value added services | Recharging comfortability | Customer care support | Internet support |
| Quick activation of number (6.51) | Song options for dialer tunes (4.70) | Recharging Without hassles thro’ coupons (6.18) | Easy connection with customer care. (6.09) | GPRS connection (3.43) |
| Connecting calls easily (6.88) | Facility of getting missed calls while cell is switched off (4.77) | Recharging Without hassles thro’ Easy deal. (5.72) | Knowledgeable customer care executives (6.04) | Recharging through internet (2.92) |
| Facing no problems in getting calls from any other network. (6.58) | Getting news, jokes & cricket score. (4.61) | Various price Options in Recharge coupons. (5.49) | ||
| Speedy delivery of SMS. (6.50) | Getting booster re- charge (4.07) | |||
| voice clarity on network (6.47) | ||||
Bsnl
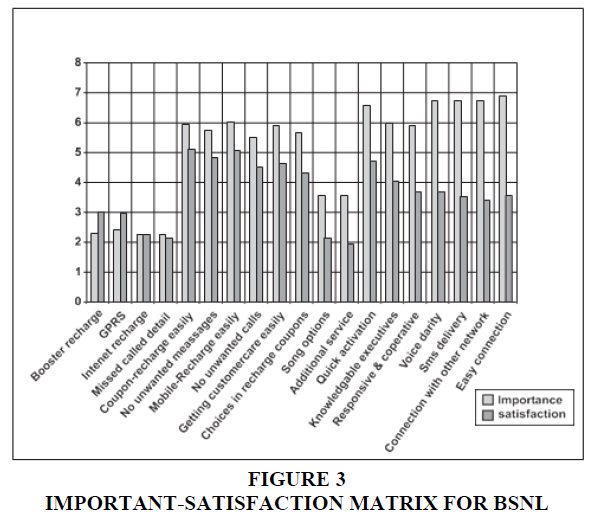
The gaps between the expectations and satisfaction were highest in the High –Low quadrant (expectations of the customers are high (>4) and satisfaction is less (<4)) are found in the factors of voice Clarity, SMS delivery, Connection with other network, Easy connectivity of calls, Responsive and co-operative executives. The lowest satisfaction levels for the factors in this quadrant were 3.42. These services are the most basic of the services. Also, the gaps between the expectations and satisfaction were very high (>3) on these services.
The services in the Low-Low quadrant (expectations of the customers are less (<4) and satisfaction is less (<4)) are Song options, Booster recharge, GPRS, Internet recharge, Missed call details, Additional services. There were no services which fell in the Low-High quadrant Figure 3.
Jio
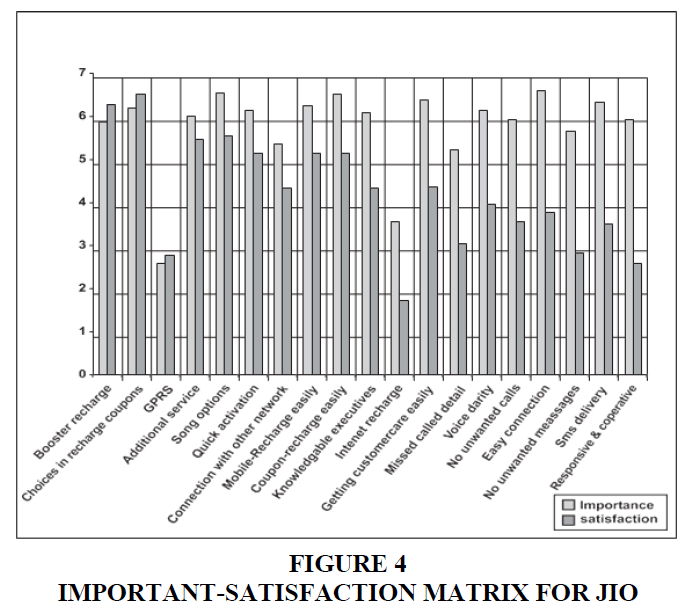
The factors in the High-Low quadrant are Easy connection, Voice Clarity, SMS delivery, Responsive and co-operative executives, Missed call detail, unwanted calls, unwanted messages. The gap between expectation and service was the highest for Responsive and co-operative executives (3.32). The services in the Low-Low quadrant are GPRS, Internet recharge. There were no services which fell in the Low-High quadrant Figure 4.
Airtel
The services in the High-Low quadrant are Responsive and co-operative executives, Missed call details. The gap score of the factor of easy connection was 2.53. Internet recharge is found in the Low-Low quadrant. There were no services which fell in the Low-High quadrant.
Vodafone-Idea (Vi)
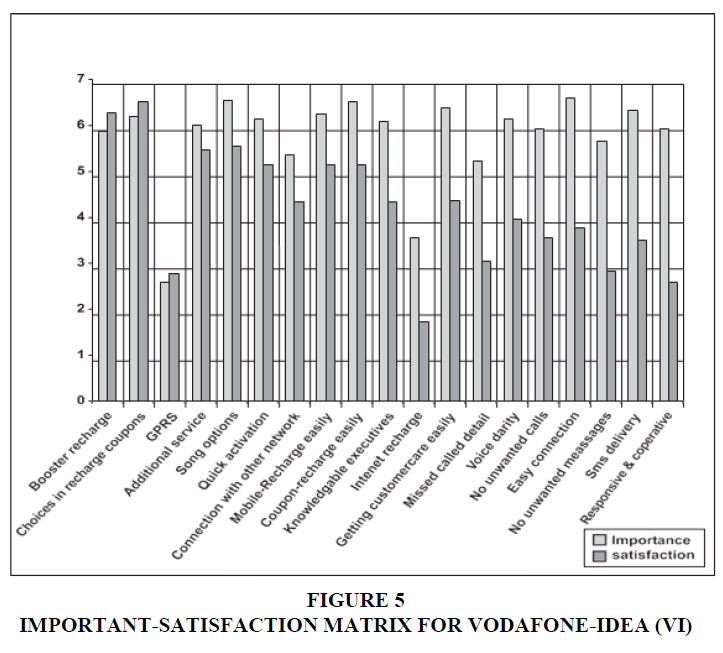
The services in the High-Low quadrant are Responsive and co-operative executives. But the magnitude of satisfaction on these factors was much better than Airtel. GPRS is the only service factor found in the Low-Low quadrant. Availability of Booster recharge options was found in the Low –High quadrant Figure 5.
Managerial Implications
The factor analysis and mean score analysis clearly shows that Basic service/Network performance is the most significant factor to be considered by Indian consumers. This service feature is core product of “Flower of service model”. To retain the existing consumers, firms should satisfy its customers in this domain. Firms should also make the process recharging through all modes without any hassles as customers are ranking this feature next to core service feature. BSNL should improve upon the basic services like Voice Clarity, SMS delivery, Connection with other networks, Easy connectivity of calls, Responsive and co-operative executives. The problem in connectivity with other networks is unique to BSNL. BSNL customers have very low expectations on most of the other services. Jio also lags in the services like, Voice Clarity, SMS delivery. Jio should improve its customer care which is having the highest gap score. Airtel customers were found to be very unsatisfied with the unwanted messages they receive from the service provider. Airtel can easily improve on this by reducing the frequency of such messages. Also, Airtel was the only service provider whose customers had high expectation of GPRS and were also satisfied with it. It should leverage its strength. The service level of hutch is found to meet the customers’ expectation on most of the services followed by Airtel and it is exceeding their expectation on seven services. It fails on Responsive and co-operative customer care and unwanted messages. Although, the gap is less, it should improve upon these services to further improve the satisfaction of the customers.
References
Anderson, E.W., & Fornell, C. (1994). A customer satisfaction research prospectus. Service quality: New directions in theory and practice, 14(1), 239-266.
Indexed at, Google Scholar, Cross Ref
Bai, V.T., Ganesan, A., & Srivastava, S.K. (2007). Analysis of mobile communication spread and its implications in India'. Academic Open Internet Journal, 21.
Bernhardt, K. L., Donthu, N., & Kennett, P. A. (2000). A longitudinal analysis of satisfaction and profitability. Journal of business research, 47(2), 161-171.
Indexed at, Google Scholar, Cross Ref
Bitner, M.J., & Hubbert, A.R. (1994). Encounter satisfaction versus overall satisfaction versus quality. Service quality: New directions in theory and practice, 34(2), 72-94.
Bloemer, J.M., & Kasper, H.D. (1995). The complex relationship between consumer satisfaction and brand loyalty. Journal of economic psychology, 16(2), 311-329.
Indexed at, Google Scholar, Cross Ref
Cooil, B., Keiningham, T.L., Aksoy, L., & Hsu, M. (2007). A longitudinal analysis of customer satisfaction and share of wallet: Investigating the moderating effect of customer characteristics. Journal of marketing, 71(1), 67-83.
Indexed at, Google Scholar, Cross Ref
Dell, D.J. (2002). The CEO Challenge: Top Marketplace and Management Issues 2002. Conference Board.
Dietz, J. (1997). Satisfaction: A behavioral perspective on the consumer. Journal of Consumer Marketing, 14(4-5), 401-404.
Droge, C. (1998). Know your customer: New approaches to understanding customer value and satisfaction. Journal of the Academy of Marketing Science, 26(4), 351.
Fornell, C. (1992). A national customer satisfaction barometer: The Swedish experience. Journal of marketing, 56(1), 6-21.
Indexed at, Google Scholar, Cross Ref
Mittal, V., & Baldasare, P. M. (1996). Impact analysis and the asymmetric influence of attribute performance on patient satisfaction. Journal of Health Care Marketing, 16(3), 24-31.
Mohan Raj, P. (2021). PERSONALITY PROFILING OF POTENTIAL CAR BUYERS–CLUSTER ANALYSIS APPROACH. Empirical Economics Letters, 20.
Musa, R., Pallister, J., & Robson, M. (2004). Assessing customer satisfaction within the direct sales channel using consumption system approach: Empirical evidence from Malaysia. Proceedings of the Australian and New Zealand Marketing Academy, Wellington, New Zealand.
Oliver, R.L. (1999). Whence consumer loyalty?. Journal of marketing, 63(4_suppl1), 33-44.
Indexed at, Google Scholar, Cross Ref
Patterson, P.G., Johnson, L.W., & Spreng, R.A. (1996). Modeling the determinants of customer satisfaction for business-to-business professional services. Journal of the academy of marketing science, 25(1), 4-17.
Indexed at, Google Scholar, Cross Ref
Peterson, R.A., & Wilson, W.R. (1992). Measuring customer satisfaction: fact and artifact. Journal of the academy of marketing science, 20(1), 61-71.
Indexed at, Google Scholar, Cross Ref
Sharma, M., & Choubey, A. (2022). Green banking initiatives: a qualitative study on Indian banking sector. Environment, Development and Sustainability, 24(1), 293-319.
Indexed at, Google Scholar, Cross Ref
Sharma, M., & Choubey, A. (2020). Resistance towards Green Banking Adoption in Delhi NCR: A Grounded Theory Approach. AIMA Journal of Management and Research, 14(2/4), 1-20.
Taylor, S.A., & Baker, T.L. (1994). An assessment of the relationship between service quality and customer satisfaction in the formation of consumers' purchase intentions. Journal of retailing, 70(2), 163-178.
Indexed at, Google Scholar, Cross Ref
Taylor, C.R., Kim, K.H., Kim, D.Y., & Moon, H.I. (2002). Antecedents of brand loyalty in South Korean rice market. Journal of Global Academy of Marketing Science, 9(1), 175-188.
Indexed at, Google Scholar, Cross Ref
Zeithaml, V.A., Bitner, M.J., & Gremler, D.D. (2006). Services marketing: Integrating customer focus across the firm. McGraw-Hill/Irwin.
Received: 29-Mar-2023, Manuscript No. AMSJ-23-13396; Editor assigned: 24-Mar-2023, PreQC No. AMSJ-23-13396(PQ); Reviewed: 08-Apr-2023, QC No. AMSJ-23-13396; Revised: 20-May-2023, Manuscript No. AMSJ-23-13396(R); Published: 04-Jul-2023
