Research Article: 2025 Vol: 29 Issue: 5S
Social Media as a Technology for Crisis Management: Insights from the Yellowstone Park Closure during the 2022 Flooding Emergency
Jamie M. Chen, Midwestern State University
Prasanna Humagain, Senior Research Associate in Metro Analytics
Limin Zhang, North Dakota State University
Xudong Rao, Texas A&M University
Citation Information: Chen, M.J., Humagain, P., Zhang, L., & Rao, X. (2025). Social media as a technology for crisis management: insights from the yellowstone park closure during the 2022 flooding emergency. Academy of Marketing Studies Journal, 29(S5), 1-16.
Abstract
Social media has emerged as a crucial platform for disseminating real-time urgent crisis news. This study addresses a novel issue in marketing communications on social media and applies the agenda-setting theory to evaluate the effectiveness of crisis management. By collecting over 181,000 tweets during the historic flooding-related closure of Yellowstone Park in June 2022, this research aims to investigate public perceptions of the disaster and fill the knowledge gap regarding crisis communication processes on social media through the lens of the agenda-setting theory. The sentiment and emotion analysis provides insights into public perceptions expressed in tweets during the entire crisis. Additionally, social network analysis showed the dissemination patterns of information, identifying influential Twitter handles based on their popularity, connectivity, and authority. These findings contribute to the existing literature on crisis management models in the context of social media and extend the scope of the agenda-setting theory from traditional mass media to social media platforms. This study also offers practical implications for marketing professionals on crisis communications in the digital era, especially through the utilization of social media.
Keywords
Social media, crisis management, agenda-setting theory, Twitter, Yellowstone Park.
Introduction
A crisis is a disruptive incident that poses significant risks or threats to business assets, including infrastructure, personnel, and reputation. Crisis communications typically involve the collection, processing, and dissemination of crisis messages to facilitate business recovery (Coombs 2010). When disseminating crisis messages via various media including media platforms, such as news media, web media, and social media, customers and stakeholders may perceive information differently. On social media, the advancement of information, communication, and technology (ICT) and the wide use of smart devices provide convenient channels to closely monitor customer perceptions of their products, services, and brands. By leveraging social media analytics, marketers can gain insights into customer perceptions before, during, and after the crisis (Ruz et al. 2020). Additionally, organizations can preserve and promote crisis-related information by considering diverse audience opinions on social media. For instance, the U.S. Centers for Disease Control and Prevention (CDC) has used social media platforms to disseminate COVID-19 pandemic-related information to the public (Batova 2022). With approximately 450 million monthly active users since 2017, Twitter has become one of the most active social media platforms to share real-time urgent news and emergency notifications with fragmented audiences (Wang and Zhuang 2017).
As the first national park in the United States, Yellowstone, established in 1872, was managed independently until the creation of the National Park Service (NPS) in 1916. The Park is renowned for its active geysers and diverse natural landscapes, including mountains, rivers, and lakes. Yellowstone National Park attracts approximately 3-4.5 million visitors each year, with around 4.8 million visitors in 2021. However, the visit numbers declined sharply in 2022 due to severe flooding.
In early June 2022, heavy rains and melting mountain snow led to a historic 500-year flooding in Yellowstone National Park, causing severe damage to roads, water and wastewater systems, power lines, and other critical park infrastructure. The flooding, along with rockslides and mudslides, resulted in the park’s closure on June 13, which lasted for nine days until June 22 (see Figure 1). Consequently, more than 10,000 visitors were evacuated from the park, while Yellowstone-related topics surged on Twitter and other social media platforms.

Figure 1 The Map of the 2022 Flooding at the Yellowstone National Park
In the U.S., national parks are a critical component of the outdoor recreation and vacation lifestyle, attracting millions of visitors every year. Trips to national parks are motivated by a desire for novelty, relaxation, experiencing nature, and enjoyable time with family and friends (Pearce 2011). While national parks remain popular, they are also susceptible to natural disasters and severe weather conditions. For instance, the national parks in the U.S. were closed during the COVID-19 pandemic to prevent the spread of the virus. The impact of COVID-19 was significant, with visits plummeting from 327 million in 2019 to 237 million in 2020 (NPS Stats, 2023).
Timely recovery of national parks is critical to ensure the well-being of communities and businesses, such as hotels and restaurants that rely on incoming visitors. One way to initiate the recovery efforts is to understand customers’ perceptions before, during, and after a crisis, and to preserve and promote the brand image through marketing, advertising, and information messaging that effectively respond to diverse opinions (Ho, Shin, and Pang 2017). In the current era, this goal can be achieved by analysing social media discourse throughout the crises. Compared to the immediate engagement of active social media users and their frequent interactions with related organizations during the Yellowstone National Park flooding, contemporary crisis-related models are historically rare. Scholars are encouraged to provide both theoretical and practical insights.
Previous studies on crisis management primarily focused on audience communications during the event (Takahashi, Tandoc Jr, and Carmichael 2015). Little research has been conducted on real-time information distribution and its impacts on the entire crisis management process. Twitter, as a social media platform, provides a unique opportunity to investigate its users’ real-time perceptions of a disaster. This study uses sentiment analysis and social network analysis to address the knowledge gap in understanding on the entire process of business recovery based on customers’ perceptions. Specifically, we aim to answer four research questions: (1) How does Twitter discourse evolve during the Yellowstone National Park flooding? (2) What are the user sentiments in the text data? (3) How do the most popular, connected, and influential Twitter handles respond to the crisis, and do their followers play different roles in crisis communications? (4) How can marketers leverage Twitter data analytics to improve communication during a crisis?
Literature Review
Crisis Communications on Social Media
A crisis, such as severe weather or a natural disaster, often compels individuals to make decisions or face negative consequences. The foundational research on crisis management emerged from studies on large-scale industrial and environmental disasters in the 1980s (Quarantelli 1988). From stakeholders’ perspective, proactive management can mitigate damages to an organization’s image and reputation (George 1997). Crisis management encompasses the strategic skills and techniques required to identify, assess, understand, and address unexpected events during a crisis (Coombs and Holladay 2008). Historically, the crisis management process has been divided into three phases: pre-crisis, crisis, and post-crisis (Coombs 2010). A broader perspective suggests extending this three-phase division to include the periods immediately before and after the crisis, allowing organizations to proactively identify, prepare, react, and learn (Madsen 2009). In line with this, Pedersen et al. (2020) proposed a five-phase model: pre-crisis normality, crisis emergence, crisis occurrence, crisis aftermath, and post-crisis normality. This study adopted the five-phase model to understand the distinctions between different phases and their potential critical factors.
As one of the most popular social media platforms, Twitter offers users with social networking services, such as posting, reading, and interacting with “tweets”, which are messages limited to 280 characters. Founded in 2006, Twitter has grown to 229 million daily active users as of 2022 (Twitter statistics and trends 2022). Users can also categorize tweets by topic using hashtags, which are words or phrases prefixed with a “#” sign. To repost another user’s tweet and share the message, users can click retweet (i.e., “RT”) and may include that user’s name by the “@” sign. RTs can amplify the original tweet message to a broader audience, and valuable tweets are more likely to be re-tweeted. In crisis management, re-tweets can facilitate information dissemination, so both tweets and re-tweets were included in this study. With the aid of computational programs, researchers can search, collect, and analyze large datasets from interactive social media platforms (Wang and Zhuang 2017). To process visual and verbal data, sentiment analysis and social network analysis have been widely used to categorize phenomena for a better and more accurate interpretation (Cheng 2018).
Research indicates that online crisis responses are increasingly occurring simultaneously with on-site activities, with social media platforms integrating the online community into the actual response to information diffusion (Van der Meer and Verhoeven 2013; Xu 2020). Social media platforms, being low-cost or free forums for the expression of ideas, information, and opinions, offer numerous opportunities for crisis communications. Social media analytics have been used to understand information flow throughout the life cycle of critical events, aiding organizations in becoming more prepared and effective in crisis management (Shah and Schweiggart 2023). Scholars emphasize the importance of focusing on the active crisis period, and the real-time Twitter data have been widely used in empirical studies (Kusumasari and Prabowo 2020; Karimiziarani and Moradkhani 2023). Table 1 illustrates the use of Twitter in natural disasters like hurricanes causing water floods (Takahashi et al. 2015; Carley et al. 2016; Kitazawa and Hale 2021), earthquakes (Ahn, Son, and Chung 2021; Aldamen and Hacimic 2023), and wildfires (Zahra et al. 2020; Hocevar 2023) over the past decade.
Agenda-Setting Theory in Social Media
Known as the father of agenda-setting theory, Lippmann (1922) proposed that the experiences of the average person were limited and the media influenced people’s perception of the outside world. Agenda-setting theory suggests that communications media play a pivotal role in shaping problems, attracting attention, and directing public opinion toward specific issues (McCombs and Shaw 1972). Over the past century, the theory has been extensively studied and applied to various forms of media, from mass media to social media (Feezell 2018). From the perspective of social media, there are complicated interactions within social networks regarding reality, agenda, and perception (Carazo-Barrantes 2021).
A social network reveals the relationships among individuals and groups and how information spreads throughout social media (van Noort et al. 2012). In this study, the social network illustrates how information related to the Yellowstone flooding is disseminated on the Twitter platform, allowing the identification of key influential handles along the network. As shown in Figure 2, this study is informed by the agenda-setting theory and proposes a theoretical framework encompassing reality (i.e., the official handle of Yellowstone National Park), agenda (i.e., influential handles), and public perceptions on social media.

Figure 2 The Agenda-Setting Theory of Crisis Communications on Social Media
Research Method
Data Collection
To examine Twitter users’ perceptions of the flooding emergency at Yellowstone National Park, all tweets containing the keyword “Yellowstone” were collected from June 9 to June 26, 2022. The specific date range was chosen to encompass the following phases: pre-crisis normality (June 9-June 12), crisis emergence (June 13-June 15), crisis occurrence (June 16-June 18), crisis aftermath (June 19-June 23), and post-crisis normality (June 24-June 26). Error! Reference source not found. presents the timeline of events surrounding the flooding at Yellowstone National Park, along with news updates provided by the park’s official Twitter handle “@YellowstoneNPS”, which represents reality in the agenda-setting theory Table 2.
Data Description
A total of over 181,000 tweets were collected using the R package academictwitteR in Rstudio during the study period from June 9 to June 26, 2022. During the study period, “YellowstoneNPS” posted 46 tweets. The total number of interactions in the Twitter space was 17,763 tweets, accounting for about 10% of the total tweets mentioning “Yellowstone”. The relatively low number of interactions with the official Twitter handle could be attributed to Twitter users engaging with other handles or using the hashtag such as #Yellowstone or flooding-related terms.
A preliminary screening of tweets revealed a significant number of tweets dedicated to the TV series “Yellowstone”, which had updated to its fourth season by the study period in 2022. A thorough cleaning of the Twitter corpus was performed, filtering out tweets related to the TV series using keywords such as “@Yellowstone” (The official Twitter handle of the Yellowstone series), “#YellowstoneTV”, “@JeffersonWhite”, “@paramountplus”, “@paramountnet”, “@YellowstoneFans”, “series”, and “Kevin Costner”. After filtering out around 20,000 tweets from the raw data, the final corpus used for analysis consisted of 160,945 tweets, representing about 89% of the original sample size. Figure 3 below shows the number of tweets per day related to Yellowstone made by Twitter users during the study period. The figure resembles a bell curve, with most tweets occurring during the crisis emergence and crisis occurrence between June 13 and June 18, and gradually dissipating during the crisis aftermath. It is common in the crisis management literature to observe a high level of public concern during the event, followed by a decrease in involvement after the crisis.

Figure 3 Number of Tweets Per Day During the Yellowstone Flooding Crisis
Empirical Findings: Sentiment Analysis
Sentiment Analysis is a valuable tool for understanding the perceptions and emotions expressed in texts. Text polarity has been used in sentiment analysis to determine whether a given text is positive, negative, or neutral. One approach to polarity analysis is the Lexicon approach, where words are assigned a polarity score if they are present in the Lexicon dictionary. The overall polarity score of a text is then calculated by summing up the polarity scores of all the words contained in the text. This analysis uses the Lexicoder Sentiment Dictionary 2015, which includes a prebuilt collection of words associated with polarity score.
Figure 4 displays the mean sentiment scores of all tweets during different periods of the Yellowstone flood crisis. A polarity score was calculated for each tweet ranging from -1 to +1. According to the Lexicoder Sentiment Dictionary 2015, the value of -1 represents the maximum negative polarity score, +1 refers to the maximum positive neutrality score, and zero signifies neutral polarity. For example, the mean score of -0.4 during the crisis emergence suggests that most of the tweets posted after the flooding contained negative sentiments. The mean scores started increasing after the crisis, eventually reaching a positive score in the post-crisis phase.

Figure 4 Mean Sentiment Scores of Tweets During the Yellowstone Flooding Crisis
Emotion Analysis
We conducted emotion analysis using the NRC emotion lexicon, which associates English words with eight basic emotions: anger, anticipation, disgust, fear, joy, sadness, surprise, trust, and two sentiments (i.e., negative and positive). Figure 5 revealed that negative emotions (such as anger, disgust, fear, and sadness) were more prevalent during the crisis and its aftermath, and even higher during the post-crisis normality. This may be due to people’s plans to visit Yellowstone National Park being canceled or their dissatisfaction with the preventive measures implemented by the national park services. The trust emotion can serve as a suitable indicator to evaluate the crisis communications perceived by people using Twitter, showing a higher value during the post-crisis normality. Higher positive scores during post-crisis normality align with the previous sentiment score, whereas negative sentiment scores were higher during the crisis emergence phase.

Figure 5 Emotion Analysis of Tweets During Different Periods of Yellowstone Flooding
Social Network Analysis
Social network analysis was used to identify influential handles, which correspond to the agenda in the addenda-setting theory. Social networks are visualized using sociogram, where nodes represent individuals, groups, or organizations; and lines depict the relationships or flows between the nodes. Social network analysis encompasses multiple methods rather than a single approach. Centrality methods were initially developed in social network analysis to assess the important vertices within a graph, such as identifying the most influential person or popular content in a social network for marketing communications (Bonacich and Lloyd 2001). As a prominent social media platform, Twitter’s social network has been extensively studied in two major categories: the first category focuses on the node level of the social graph; and the second category studies the social graph as a whole (Riquelme and González-Cantergiani 2016).
At the node level, a user’s presence and social impact on the network are measured based on their activities, popularity, and influence on other users. At the network level, important properties such as the degree of separation and the node degree distribution are studied to provide insights into the characteristics and dynamics of the network (Antonakaki, Fragopoulou, and Ioannidis 2021). For example, an edge is defined when a tweet from account A was re-tweeted or mentioned by account B. Each node in the network represents an account or a handle that mentions the word Yellowstone in their tweets. A directed graph of the network was created using these nodes and edge links. After creating the network graph, three centrality indexes (i.e., degree, betweenness, and eigenvector) were calculated for each entire graph to better understand the influential Twitter handles based on their popularity, connectivity, and authority. A social network graph consists of two variables: is the set of vertices where each vertex represents a node in the social network, and is the set of edges between vertices. This study adopts established centrality techniques in social network analysis, including degree centrality, betweenness centrality, and eigenvector centrality.
Degree Centrality Analysis
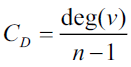
Using the 160,945 observed tweets, an edge list with retweet and mention relations was generated. The network graph represents information flow, consisting of 105,020 edges and 159,910 nodes (Twitter handles). In this sense, the network is very efficient because there are no redundant edges. The degree centrality of a node refers to the number of edges attached to the node. To obtain the standardized score, each score is divided by (where is the number of nodes). Thus, the degree centrality for vertex is:
 (1)
(1)
The influence of a Twitter handle can be determined by the number of connections to other nodes in the network. Degree centrality represents the number of incoming edges joined to the node. The higher the degree centrality, the more popular the node is. Therefore, the most popular Twitter handle should have the highest score of degree centrality. Table 3 displays the top 10 nodes with a high value of degree centrality.
The results of the degree centrality analysis in both Table 4 and Figure 6 reveal that most of the tweets that received re-tweets and mentions were from the popular Twitter handles providing information about the Yellowstone flooding. These handles include relevant agents (e.g., YellowstoneNPS), official news sources (e.g., Nytimes, AP, US_Stormwatch, CNN), climate activists (e.g., edgarrmcgregor, LakotaMan1, MichaelJHilbert), and influencers from various professions such as musicians, writers, and sociologists. Figure 7 further illustrates that the largest cluster of information flow originated from the official agent YellowstoneNPS. The second-largest cluster of information flow was connected to YouTube, followed by several smaller clusters scattered around.

Figure 6 Degree Centrality Analysis of Twitter Handles

Figure 7 Betweenness Centrality Analysis of Twitter Handles
Betweenness Centrality Analysis
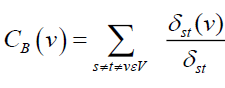
In the graph of a network, a node positioned between other nodes can interrupt or control information flow, acting as a bridge from one part of the network to another. To calculate betweenness centrality, every pair of the network is considered, and the number of times a node can interrupt the shortest paths between the two nodes of the pair is counted. The formula is used to standardize the score where is the number of nodes. In this way, the betweenness centrality for vertex is calculated as:
 (2)
(2)
where is the total number of shortest paths from node to node , and is the number of those paths from to that go by vertex .
As one of the centrality measures, betweenness centrality exemplifies the amount of influence a node has on information flow within a network. It also indicates whether a node is centrally located in the spatial network of information flow (dos Muchangos et al. 2017). The higher the value of betweenness centrality, the more closely connected the node is to other nodes. Table 4 displays the top 10 Twitter handles based on their betweenness centrality scores.
The results of the betweenness centrality analysis in both Table 4 and Figure 7 indicate that certain Twitter handles frequently interrupt information flow in the network. Interestingly, these handles share common features, such as national park or wildlife enthusiasts (e.g., MichaelJHilbert and MontanaVoter). Additionally, most of these handle clusters were centered around @YellowstoneNPS, with the exception of YouTube, which formed a relatively remote cluster (see details in Figure 8).

Figure 8 Eigenvector Centrality Analysis of Twitter Handles (Eigenvector Centrality >0.3)
Eigenvector Centrality Analysis
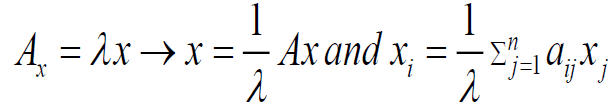
To further analyze influential Twitter handles, eigenvector centrality was adopted to measure the influence of nodes in the network. Nodes are assigned scores based on their connections to other high-scoring nodes. The eigenvector centrality of node can be defined as the -th entry of the normalized eigenvector corresponding to the greatest eigen value of A, which is a adjacency matrix:
 (3)
(3)
where λ is the largest eigen value, and is the corresponding eigenvector.
A node’s eigenvector centrality can also be interpreted as the extent to which that node’s preferences influence an efficient outcome of information flow in the social network. The higher the eigenvector centrality, the more connected the node is to other nodes with high eigenvector scores. Table 5 presents the top 10 Twitter handles based on their eigenvector centrality scores.
The results of the eigenvector centrality analysis in both Table 5 and Figure 8 indicate that handles related to YouTube (e.g., RealDrCollision and sme_rt), movies (e.g., ThomasJHoward), and gaming (e.g., SGH_RTs and thgc_rts) are more influential, followed by some digital marketing handles (e.g., rttanks, ChapmanPoolePR, and the Whisky writer/blog). Figure 8 further confirms that there are approximately four clusters associated with these most influential Twitter handles.
Discussion
This research adopted a five-phase crisis management model (i.e., pre-crisis normality, crisis emergence, crisis occurrence, crisis aftermath, and post-crisis normality) and empirically examined the distinctions between different phases and their potential influencing factors. The findings of sentiment analysis and emotion analysis provide a deeper understanding of the perceptions and emotions expressed in tweets during the Yellowstone flooding in 2022. For example, negative emotions dominated throughout the crisis, and more efficient communications from the official source (i.e., YellowstoneNPS in this research) could help alleviate public anxiety (i.e., public perception on social media). The results of social network analysis track how information related to the Yellowstone flooding was disseminated on Twitter. This analysis identifies popular influencers within the network, connected controllers, and influential Twitter handles based on their popularity, connectivity, and authority. Specifically, degree centrality was used to measure the popularity of a given agent in the social media network. Betweenness centrality and eigenvector centrality were used to examine Twitter handles’ connectivity and authority. The findings illustrate how Twitter handles bridge or interrupt information flow during a crisis, enriching the literature on social media influencers. This study provides new evidence of re-tweet effects, which not only influence information flow but also contribute to the spread of disinformation during a crisis.
Conclusion
Implications
Given that a crisis tends to receive a higher level of user reactions (i.e., the number of re-tweets on Twitter), this paper extends the agenda-setting theory by uncovering the role of reality (i.e., official handle) and agenda (i.e., influential handles) in shaping public perceptions during a crisis. Specifically, the paper makes three contributions. First, this paper explores the evolution of the agenda-setting theory in the digital era, examining the relationships among reality, agenda, and public perception, and revealing the complex system of the social media networks. Second, this study develops a novel measurement of an agent’s popularity in the social media network using the concept of degree centrality. This is one of the first attempts to assess the efficiency of reality in disseminating crisis information and improving crisis communications on social media. Last, this study creatively connects betweenness centrality with eigenvector centrality to examine the Twitter handles’ connectivity and authority in social media networks. It sheds new light on the role of handles in bridging or interrupting information flow in the social media network. Thus, the re-tweets not only influence information flow but also contribute to the creation of disinformation during a crisis. This study provides new evidence of re-tweet effects and contributes to the agenda-setting theory regarding the relationship among reality, agenda, and public perception on social media.
Marketing communications should strategically use social media platforms to enhance engagement with online users and understand the digital impact of social media networks on customers (Taecharungroj 2017). In case of a crisis, the following recommendations for crisis communications are based on our empirical findings: (1) increase interaction with the public by commenting on social media posts and providing information, alternative travel plans, or travel routes; (2) collaborate with influencers and media outlets to prevent misinformation regarding disaster and recovery efforts; (3) create multimedia content such as photos and videos showcasing disaster-related impacts and recovery efforts to gain attraction on social media; (4) focus on promotion and marketing post-disaster, as people may still be cautious about making plans after the disaster has stabilized.
Limitations and Future Research Directions
This study examines crisis communications on social media using the Yellowstone flooding case. A significant number of tweets discussed the flooding disaster during the crisis. However, the Twitter API for academic research used in this paper could only collect tweets that contained the keyword Yellowstone within the specified period. This technical limitation somewhat reduced the dataset size for the current study. Given the fast development of Twitter API, it is possible to collect more comprehensive data to thoroughly examine the social impacts of a crisis in future studies. The selection of text messages and the specific social media platform, Twitter, may introduce bias into the analysis. Future studies could consider using multimedia data types, including audio, images, graphics, and video, from multiple social media platforms such as Instagram, Facebook, and TikTok. This study only collected Yellowstone flooding-related Twitter data and could not reveal the socioeconomic impact of the flooding-related closure on Yellowstone National Park. Due to a lack of reliable data, this paper did not consider the consumer demand for Yellowstone National Park, which should be fully examined in future research and could jointly promote the park through re-tweet effects (e.g., collaborating with influential handles) and social media networks.
References
Aldamen, Y., and E. Hacimic. (2023). “Positive determinism of Twitter usage development in crisis communication: Rescue and relief efforts after the 6 February 2023 earthquake in Türkiye as a case study.” Social Sciences 12(8): 436-472.
Indexed at, Google Scholar, Cross Ref
Ahn, J., H. Son, and A. D. Chung. (2021). “Understanding public engagement on twitter using topic modeling: The 2019 Ridgecrest earthquake case.” International Journal of Information Management Data Insights 1(2):100033.
Antonakaki, D., P. Fragopoulou, and S. Ioannidis. 2021. “A survey of Twitter research: Data model, graph structure, sentiment analysis and attacks.” Expert Systems with Applications 164:1-25.
Batova, T. (2022). “To wear or not to wear: a commentary on mistrust in public comments to CDC tweets about mask-wearing during COVID19.” International Journal of Business Communication 59(2):287-308.
Indexed at, Google Scholar, Cross Ref
Bonacich, P., and P. Lloyd. (2001). “Eigenvector-like measures of centrality for asymmetric relations.” Social Networks 23(3):191-201.
Carazo-Barrantes, C. (2021). “Agenda-setting in a social media age: Exploring new methodological approaches.” The Agenda Setting Journal 5(1):31-55.
Carley, K. M., M. Malik, P. M. Landwehr, J. Pfeffer, and M. Kowalchuck. (2016). “Crowd sourcing disaster management: The complex nature of Twitter usage in Padang Indonesia.” Safety Science 90:48-61.
Cheng, Y. (2018). “How social media is changing crisis communication strategies: Evidence from the updated literature.” Journal of Contingencies and Crisis Management 26(1):58-68.
Coombs, W. T. (2010). “Parameters for crisis communication.” The Handbook of Crisis Communication pp. 17-53.
Coombs, W. T., and S. J. Holladay. (2008). “Comparing apology to equivalent crisis response strategies: Clarifying apology’s role and value in crisis communication.” Public Relations Review 34(3):252-257.
Indexed at, Google Scholar, Cross Ref
dos Muchangos, L. S., A. Tokai, & A. Hanashima. (2017). “Stakeholder analysis and social network analysis to evaluate the stakeholders of a MSWM system–A pilot study of Maputo City.” Environmental Development 24:124-135.
Feezell, J. T. (2018). “Agenda setting through social media: The importance of incidental news exposure and social filtering in the digital era.” Political Research Quarterly 71(2):482-494.
Indexed at, Google Scholar, Cross Ref
George, A. M. (1997). “The phases of crisis communication.” In A. M. George, C. B. Pratt (Ed.). Case studies in crisis communication: International Perspectives on Hits and Misses (pp. 29-50). Oxfordshire, UK: Routledge
Ho, B., W. Shin, and A. Pang. 2017. “Corporate crisis advertising: A framework examining the use and effects of corporate advertising before and after crises.”Journal of Marketing Communications 23(6): 537-551.
Hocevar, K.P. (2023). “Who drives disaster communication? An analysis of Twitter network structure and influence during a wildfire crisis.” Western Journal of Communication, 1-21.
Indexed at, Google Scholar, Cross Ref
Karimiziarani, M., & H. Moradkhani. (2023). “Social response and disaster management: Insights from twitter data assimilation on Hurricane Ian.” International Journal of Disaster Risk Reduction 95:103865.
Kersten, J., and F. Klan. (2020). “What happens where during disasters? A workflow for the multifaceted characterization of crisis events based on Twitter data.” Journal of Contingencies and Crisis Management 28(3):262-280.
Kitazawa, K., and S. A. Hale. (2021). “Social media and early warning systems for natural disasters: A case study of Typhoon Etau in Japan.” International Journal of Disaster Risk Reduction, 52.
Kusumasari, B., and N. P. A. Prabowo. (2020). “Scraping social media data for disaster communication: how the pattern of Twitter users affects disasters in Asia and the Pacific.” Natural Hazards 103(3): 3415-3435.
Indexed at, Google Scholar, Cross Ref
Lippmann, W. (1922). “Public opinion.” New York: Macmillan.McCombs, M. E., and D. L. Shaw. (1972). “The agenda-setting function of mass media.” Public Opinion Quarterly 36(2):176-187.
Pedersen, C.L.T. Ritter, and C.A. Di Benedetto. (2020). “Managing through a crisis: Managerial implications for business-to-business firms.” Industrial Marketing Management 88:314-322.
Quarantelli, E. L. (1988). “Disaster crisis management: A summary of research findings.” Journal of Management Studies, 25(4), 373-385.
Riquelme, F., & P. González-Cantergiani. (2016). “Measuring user influence on Twitter: A survey.” Information Processing & Management 52(5):949-975.
Indexed at, Google Scholar, Cross Ref
Ruz, G. A., P. A. Henríquez, and A. Mascareño. (2020). “Sentiment analysis of Twitter data during critical events through Bayesian networks classifiers.” Future Generation Computer Systems 106:92-104.
Shah, A. M., and N. Schweiggart. 2023. “# BoycottMurree campaign on twitter: Monitoring public response to the negative destination events during a crisis.” International Journal of Disaster Risk Reduction, 92, 103734.
Taecharungroj, V. (2017). “Starbucks’ marketing communications strategy on Twitter.” Journal of Marketing Communications 23(6):552-571.
Takahashi, B., E. C. Tandoc Jr, and C. Carmichael. (2015). “Communicating on Twitter during a disaster: An analysis of tweets during Typhoon Haiyan in the Philippines.” Computers in Human Behavior 50:392-398.
Indexed at, Google Scholar, Cross Ref
Twitter statistics and trends. (2022). https://datareportal.com/essentialtwitterstats#:~: text=How%20many%20Twitter%20users%20arethe%20world%20in%20April%202022
Van Noort, G., M. L. Antheunis, and E. A. Van Reijmersdal. 2012. “Social connections and the persuasiveness of viral campaigns in social network sites: Persuasive intent as the underlying mechanism.” Journal of Marketing Communications 18(1):39-53.
Van der Meer, T. G., and P. Verhoeven. (2013). “Public framing organizational crisis situations: Social media versus news media.” Public Relations Review 39(3): 229-231.
Wang, B., and J. Zhuang. (2017). “Crisis information distribution on Twitter: a content analysis of tweets during Hurricane Sandy.” Natural Hazards 89(1):161-181.
Indexed at, Google Scholar, Cross Ref
Xu, Z. (2020). “How emergency managers engage Twitter users during disasters.” Online Information Review 44(4):933-950.
Indexed at, Google Scholar, Cross Ref
Zahra, K., M. Imran, and F. O. Ostermann. (2020). “Automatic identification of eyewitness messages on twitter during disasters.” Information Processing & Management 57(1):102107.
Indexed at, Google Scholar, Cross Ref
Received: 14-Apr-2025, Manuscript No. AMSJ-25-15853; Editor assigned: 15-Apr-2025, PreQC No. AMSJ-25-15853(PQ); Reviewed: 21-May-2025, QC No. AMSJ-25-15853; Revised: 30-May-2025, Manuscript No. AMSJ-25-15853(R); Published: 19-Jun-2025