Research Article: 2026 Vol: 30 Issue: 4
Strategic Pathways To Energy Transition: A Longitudinal Comparative Analysis Of Energy Portfolio Transformation And Low-Carbon Investment Strategies In Major Oil And Gas Companies
Anu Abraham, Scholar, Department of Sustainable Engineering, TERI School of Advanced Studies, India
Sapan Thapar, Associate Professor, Department of Sustainable Engineering, TERI School of Advanced Studies, India
Citation Information: Abraham, A. & Thapar, S. (2026). Strategic pathways to energy transition: a longitudinal comparative analysis of energy portfolio transformation and low-carbon investment strategies in major oil and gas companies. Academy of Marketing Studies Journal, 30(S4), 1-18.
Abstract
This study adopts a comparative benchmarking perspective to examine how major upstream oil and gas companies are responding to the global energy transition amid intensifying climate commitments, investor expectations, and national net-zero targets. Six companies representing diverse ownership structures and strategic orientations; ONGC, Saudi Aramco, ExxonMobil, BP, Shell, and Equinor—are analysed across three dimensions: perceived urgency of energy transition, fossil-fuel production reduction strategies, and investments in low-carbon technologies including solar, wind, hydrogen, carbon capture, utilisation and storage (CCUS), and battery storage. A mixed-method quantitative approach is employed, integrating descriptive statistics, repeated-measures analysis, panel regression, principal component analysis, and K-means clustering to identify comparative patterns, strategic associations, and transition typologies across firms. The results indicate that reductions in oil and petroleum-product dependence are more pronounced than reductions in natural-gas activities. Furthermore, investments in wind energy and hydrogen technologies exhibit the strongest association with renewable-energy capital expenditure. The analysis also reveals distinct strategic transition pathways: BP, Shell, and Equinor demonstrate broader renewable-energy diversification, while Saudi Aramco and ExxonMobil emphasise hydrogen and CCUS-based decarbonisation strategies. ONGC exhibits a more selective transition approach, characterised by diversification into renewable-energy initiatives alongside emerging low-carbon investments. The findings suggest that energy-transition trajectories are shaped not only by external regulatory and market pressures but also by firm-specific strategic priorities and technological preferences. Within the scope of the selected sample, the study contributes to the literature on corporate decarbonisation by providing a comparative benchmarking framework for evaluating transition pathways among major upstream oil and gas companies and informing future policy and investment decisions.
Keywords
Fossils, Oil, Gas, Transition, Solar, Wind, Low-Carbon, Sustainability, Business, Strategy.
Introduction
Climate change has emerged as one of the most defining global challenges of the 21st century, with the energy sector being one of its principal contributors. The United Nations’ Intergovernmental Panel on Climate Change (IPCC) has repeatedly emphasized the urgency of limiting global warming to 1.5°C to avert catastrophic consequences. Achieving this goal requires profound structural transformation in energy production and consumption, particularly within fossil fuel intensive sectors such as oil and gas. Historically, oil and gas companies have played a central role in driving global industrialization, economic growth, and energy security. However, this role has come at the cost of significant greenhouse gas (GHG) emissions, making them focal points in the global decarbonization dialogue.
The shift toward a low-carbon economy now places oil and gas majors at crossroads. As custodians of vast fossil fuel reserves and infrastructure, they are uniquely positioned to either impede or accelerate the energy transition. The Paris Agreement and subsequent commitments to net-zero emissions have intensified pressure on these companies to reinvent their business models. Governments have outlined national net-zero targets—India aims for 2070, Saudi Arabia for 2060, the European Union and the UK for 2050. These targets are not only aspirational but also foundational for setting climate-compatible trajectories for major corporates.
This study focuses on six of the world’s influential oil and gas companies: ONGC (India), Saudi Aramco (Saudi Arabia), ExxonMobil (United States), BP (United Kingdom), Shell (Netherlands/United Kingdom), and Equinor (Norway). Together, they reflect a mix of state-owned enterprises and multinational corporations, spanning diverse geographic regions and carrying distinct legacy emission profiles. The aim is to assess their responses to the energy transition challenge by tracing fossil fuel reduction efforts and renewable energy investments over the period 2017–2024.
The transition from fossil fuels to low-carbon energy sources is not merely a technological or operational challenge—it reflects a strategic transformation of corporate identity and long-term profitability. Companies are now grappling with the dual mandate of maintaining shareholder returns while contributing to climate goals. In this context, climate strategy is no longer peripheral—it is central to corporate resilience. The investment community, regulators, and civil society are increasingly demanding transparency, accountability, and quantifiable progress toward decarbonization.
A key aspect of this transformation is the nature and extent of fossil fuel reductions. While reducing oil production may align with climate goals, it may not be feasible or economically viable for all companies in the short term. Natural gas, often considered a “bridge fuel,” is expanding in many portfolios under the argument that it emits less CO2 than coal or oil. Meanwhile, value-added products (VAPs) such as petrochemicals, LPG, and ethane—although often overlooked—constitute significant emissions sources. Thus, any comprehensive assessment must consider all three fossil categories: oil, natural gas, and VAPs. The present study focuses on production and investment strategies and does not seek to quantify full lifecycle or Scope 3 emissions associated with these products.
Simultaneously, investments in renewable energy and low-carbon technologies—solar, wind, hydrogen, carbon capture and storage (CCUS), battery storage and CBG—are shaping the contours of future energy markets. Companies differ widely in their adoption strategies. European firms like BP, Shell, and Equinor have set aggressive renewable energy targets and have begun reallocating capital toward green assets. U.S. and Middle Eastern players, notably ExxonMobil and Aramco, tend to emphasize carbon mitigation technologies such as CCUS and blue hydrogen.
Given the complexity and variability of these strategies, this paper employs a mixed-method approach to capture both the direction and magnitude of change. We integrate emissions data, technology investments, policy scores, and financial disclosures into a unified framework. Statistical models—including Repeated Measures ANOVA, panel regression, PCA, and clustering—enable us to move beyond qualitative narratives and provide a structured comparative assessment.This research contributes to the growing literature on energy transition by offering a comparative, longitudinal view of corporate action. While many studies have assessed the alignment of national policies with the Paris Agreement, fewer have traced how individual companies across jurisdictions are adjusting their production as well as investment portfolios.
As stakeholders demand accelerated progress toward net-zero, such analysis becomes valuable for benchmarking performance, informing policy design, and shaping future regulation. In sum, this paper investigates the following overarching question: How are (upstream) oil and gas companies reducing fossil fuel production and repositioning their portfolios toward renewables in response to national and international climate targets? The findings provide insights not only into corporate behaviour but also into the broader interplay between policy frameworks, market incentives, and technological readiness in shaping the global energy transition.
Literature Study
The body of literature surrounding energy transitions has grown exponentially in the past two decades as the urgency of climate change has transformed the global policy and corporate landscape. This section synthesizes current academic understanding, global assessments, and sector-specific studies that form the conceptual and empirical foundation of this research. Recent literature further suggests that the pace and direction of corporate energy transition are shaped not only by technological innovation but also by governance structures, policy stringency, investor expectations, and firm-specific strategic capabilities, highlighting considerable heterogeneity in transition pathways across oil and gas companies.
The role of oil and gas companies in the climate crisis is both pivotal and paradoxical. They are among the largest contributors to global greenhouse gas (GHG) emissions, yet their capital, infrastructure, and technological capabilities make them essential players in enabling a low-carbon future. The International Energy Agency (IEA’s) Net Zero by 2050 roadmap provides a landmark analysis emphasizing the need for fossil fuel investment to decline sharply if the world is to achieve net-zero emissions by mid-century. It sets out a trajectory where, from 2021 onward, there must be no new oil and gas exploration approvals if the 1.5°C goal is to remain achievable. Yet, as several analysts note, global investment trends have remained misaligned with this target (IEA, 2021).
Recent research highlights the role of policy environments, innovation systems, and market incentives in shaping corporate responses to the energy transition. Studies show that national regulatory frameworks strongly influence the pace at which oil and gas companies diversify into low-carbon energy (IEA, 2023; Smit & Powell, 2023). Countries with strong carbon pricing, disclosure mandates, and renewable subsidies create stronger incentives for corporate decarbonization. In countries like Norway and the UK, where carbon pricing, disclosure mandates, and renewable subsidies are well-developed, companies such as Equinor and BP have moved faster in greening their portfolios. In contrast, in fossil-rich, state-controlled economies like Saudi Arabia, companies such as Aramco face both lower policy pressure and conflicting development priorities (Dimitriou et al., 2025).
Recent research highlights the growing role of corporate strategy, governance, and market-based decarbonisation tools such as renewable power purchase agreements and renewable energy certificates in accelerating transition pathways (Chrysikopoulos et al., 2024). Studies further emphasise that oil and gas companies are transitioning unevenly and face significant structural and governance challenges in aligning with global decarbonisation pathways (Sæverud et al., 2024).
Emerging evidence shows that corporate climate disclosure remains inconsistent, with significant variation in transparency and compliance across global oil majors (Sæverud et al., 2024). Research highlights substantial differences in the reporting of Scope 1 and Scope 2 emissions and persistent gaps in Scope 3 transparency, particularly among national oil companies (Smit & Powell, 2023). The study also notes the limitations in Scope 3 (value chain) transparency, particularly among national oil companies (NOCs). For example, while Equinor and Shell have released clear emissions reduction roadmaps with interim targets and external verification, companies such as ExxonMobil and Aramco have lagged in their disclosures and remain resistant to reporting Scope 3 emissions.
The Carbon Disclosure Project and the Transition Pathway Initiative have played a central role in benchmarking corporate climate alignment. Their assessments indicate that most oil majors are not yet aligned with a 1.5°C pathway, despite incremental progress (Transition Pathway Initiative Centre, 2022). Shell has committed to halving net carbon intensity by 2035 and achieving net-zero by 2050, while BP has reorganized its business structure around low-carbon energy divisions. However, concerns persist regarding greenwashing, inconsistent reporting standards, and the absence of legally binding emission commitments (Christensen, Hail & Leuz, 2021). These findings suggest that many firms remain in early stages of strategic transformation rather than full business model transition (Dongo & Relvas, 2025; Shojaeddini, Johnston & Wilson, 2019).
The shift in investment priorities is also reflected in capital allocation patterns, with European oil majors investing a higher share of capital expenditure in renewables compared to American and Middle Eastern companies, whose investments remain concentrated in hydrocarbons and transitional technologies (Wang et al., 2023; Jarboui & Alofaysan, 2024).These trends reflect divergent interpretations of the energy transition: while some firms view it as a full-system transformation, others treat it as a risk management or reputational challenge. The disparity is especially visible in capital expenditure reports, where firms such as Equinor and BP have consistently raised their renewable energy capital expenditure (RE CapEx) percentage, in contrast to Aramco and ExxonMobil, whose investments remain largely tied to hydrocarbons and carbon-mitigation technologies.
Several country-level studies reinforce these observations. Norway’s strong climate policy framework and financial capacity have encouraged Equinor to diversify into offshore wind and renewable energy projects (Herzog-Hawelka & Gupta, 2023). Similarly, the UK’s legally binding climate targets and carbon budgeting framework have accelerated the diversification of BP and Shell toward low-carbon solutions (Herzog-Hawelka & Gupta, 2023). In the Indian context, the government’s pledge to achieve net-zero emissions by 2070 is shaping the strategic direction of state-owned enterprises, including ONGC, which has begun expanding its renewable portfolio through investments in solar, wind, hydrogen and bioenergy (Joshi et al., 2025).
Technological innovation is a recurring theme in the literature. Hydrogen (both blue and green) and carbon capture, utilization and storage (CCUS) are widely recognised as transitional technologies for hard-to-abate sectors and as key decarbonisation pathways for oil and gas firms. Hydrogen is increasingly viewed as a strategic diversification pathway for companies transitioning toward low-carbon fuels (Zhang et al., 2024; Reda, Ahmed & Khan, 2024). However, large-scale deployment of hydrogen faces significant technological, economic and governance barriers (Hassan, Ahmed & Rahman, 2024). Studies also show that a substantial proportion of planned large-scale hydrogen projects involve partnerships with oil and gas companies, although these initiatives often lack transparency, clear timelines and performance metrics (Song et al., 2025). Similarly, CCUS deployment is increasing globally but continues to capture only a small fraction of industrial CO2 emissions, raising concerns about over-reliance on expensive and uncertain mitigation technologies (Ekemezie & Digitemie, 2024). Recent research further highlights both the technological promise and environmental trade-offs associated with CCUS implementation (Hanson, Brown & Lee, 2025; Liu et al., 2025; Wang et al., 2025), while several studies question the scalability of CCUS without strong policy support, regulatory frameworks and carbon pricing mechanisms.
Further, strategic differentiation is influenced by company type. Structural and geopolitical constraints are particularly relevant in developing and emerging economies undergoing low-carbon transitions (Joshi et al., 2025). Private majors (investor-owned companies) such as Shell and BP face shareholder activism and market pressure, whereas state-owned entities such as Aramco and ONGC operate under different governance and incentive structures. These structural impediments are exacerbated by geopolitical interests, fluctuating oil prices, and macroeconomic volatility in fossil fuel–dependent economies (Smit & Powell, 2023).
Other authors have also examined corporate sustainability disclosures and ESG scores (Christensen, Hail & Leuz, 2021), and observe that most oil majors use scenario-based reporting without setting absolute limits on fossil fuel output. The literature also suggests that renewables integration requires not only capital but also changes in organizational structure, workforce reskilling (Smit & Powell, 2023), and new partnerships with utilities and technology providers. Business model innovation-shifting from asset-heavy production models to flexible energy services-has also been emphasized as a prerequisite for a meaningful transition ((Adebayo et al., 2024). Recent global assessments also highlight the emergence of hydrogen–carbon integrated transition metrics to evaluate systemic transformation (Ganter et al., 2024; Song et al., 2025).
Empirical studies using econometric and quantitative modelling approaches remain limited but are rapidly expanding. Recent research has begun applying panel and network-based methods to analyse corporate emissions, regulatory quality, and transition performance across firms and countries (Mejia & Kajikawa, 2024). Sector-wide reviews also emphasize the need for integrated, quantitative assessments linking fossil fuel reduction pathways with renewable investment behaviour and corporate strategy (Dongo & Relvas, 2025).
This study contributes to this gap by integrating panel data with PCA, cluster analysis, and regression to uncover patterns of fossil fuel reduction and renewable energy investment. In summary, the literature confirms the critical role of oil and gas companies in climate mitigation but also reveals a complex and uneven transition landscape (Mazzucato & Semieniuk, 2018). Policy strength, ownership model, technological strategy, and investor expectations collectively shape corporate behavior. However, a detailed, longitudinal, firm-level comparative approach that links fuel output, investment portfolios, and national policy contexts remains rare (Jarboui & Alofaysan, 2024). This study seeks to address this gap by analyzing six major oil and gas firms across three continents from 2017 to 2024 using quantitative models that integrate both fossil fuel reduction and renewable energy adoption trends.
Research Gap
The literature demonstrates broad agreement that oil and gas companies will play a central role in achieving global decarbonization objectives. It also confirms that transition pathways differ significantly according to governance structures, national policy environments, technological capabilities, and strategic priorities. However, several important research gaps remain. First, relatively few longitudinal comparative studies simultaneously evaluate changes in fossil fuel production portfolios and investments in multiple low-carbon technologies across major international oil and gas companies. Second, existing research often aggregates fossil fuel production into single indicators, providing limited insight into differential transition patterns across crude oil, natural gas, and value-added products. Third, empirical evidence integrating national policy environments with firm-level production and investment behaviour remains limited, particularly across companies operating under diverse institutional contexts. Finally, despite increasing availability of sustainability disclosures and annual reports, comparatively few studies adopt transparent comparative benchmarking approaches that combine policy indicators, production trends, and renewable investment strategies within a unified analytical framework.
The present study seeks to address these gaps through an exploratory comparative benchmarking analysis of six major oil and gas companies between 2017 and 2024, integrating national policy context, fossil fuel production trajectories, and investments in solar, wind, hydrogen, CCUS, and battery storage technologies. Given the limited sample size and heterogeneous reporting practices, the findings are interpreted as comparative evidence and strategic associations rather than causal relationships. The transition narratives are often dominated by Western firms, while national oil companies and those in emerging economies remain understudied. By including ONGC (India) and Aramco (Saudi Arabia), the research expands the discourse to incorporate perspectives from the Global South, offering a more inclusive and globally relevant understanding of corporate energy transition strategies.
Methodology
This research adopts a quantitative and exploratory approach to examine the strategic transition underway in global oil and gas companies. The study uses a panel data structure covering six major firms (Shell, BP, Equinor, ExxonMobil, ONGC, and Aramco) over the period 2017–2024.
For research question-1 (Understanding the need for Energy Transition), descriptive analytics are used to assess the need for transition, based on: (i) Country-level CO2 emissions (IEA, World Bank), (ii) firm-level emission intensity (tCO2e/BOE), and (iii) national climate targets (Climate Policy Index). Data visualization (trend graphs, policy comparison charts) was conducted using Excel and Python.
Research question-2 (Which fossil fuel is being reduced more - Oil, Natural Gas, or VAPs), was examined using two statistical models:
• Repeated Measures ANOVA to identify which fuel type shows significant reduction.
• Panel Regression to test fixed vs. random effects across company-year observations, using Hausman Test for model suitability.
Research question-3 (What Renewable Energy alternatives are being adopted by Oil and Gas companies? was studied using:
• Principal Component Analysis (PCA) to identify renewable investment patterns.
• KMeans Clustering to classify companies into strategy groups.
• OLS Regression to examine the impact of solar, wind, hydrogen, CCUS, and battery investments on renewable capital expenditure (RE CapEx %).
Data for questions two and three was collected from annual reports, sustainability disclosures, and press releases. Statistical computation and modelling was conducted using Python (Pandas, Scikit-learn, Statsmodels). Tables was used for strategic visualization.
The methodology allows a comprehensive, data-driven exploration of how different fossil fuels are being phased down and which renewable energy sources are receiving investment priority across geographies and firms.
Analysis
Research Question 1: Understanding the Need for Energy Transition
This section sets the contextual foundation for the broader research inquiry by addressing the critical question: Why is the energy transition necessary? As the first of three interlinked research questions, RQ1 explores the underlying drivers and empirical justification for transitioning from fossil fuel-based energy systems toward low-carbon alternatives. The analysis underscores that without this foundational transformation, subsequent strategies around fossil fuel phase-out and renewable adoption (as explored in RQ2 and RQ3) would lack urgency and coherence.
The necessity for an energy transition has transcended academic discourse and entered the realm of operational urgency. With global temperatures rising and fossil fuel combustion accounting for the majority of greenhouse gas (GHG) emissions, transitioning from traditional hydrocarbon-based energy systems to low-carbon alternatives is central to achieving climate neutrality. This section explores the empirical justification for energy transition using country-level emission trends, corporate carbon intensity benchmarks, and policy commitment indicators such as net-zero targets and climate policy performance.
Country-Level Emissions: Escalating Pressure for Decarbonization; Fossil Fuels Emissions
Between 2017 and 2024, national fossil CO2 emissions demonstrated divergent trends reflective of countries’ developmental stages and policy initiatives. India’s emissions grew from about 2,427 Mt in 2017 to nearly 3182 Mt in 2024, underscoring the intensifying energy demand driven by rapid industrial expansion. In contrast, the United Kingdom showed consistent reductions, falling from about 387 Mt in 2017 to 296 Mt in 2024, a decline attributable to fuel-switching policies, effective climate legislation, and structural shifts toward renewable energy (European Commission, Joint Research Centre, 2025) Figure 1.
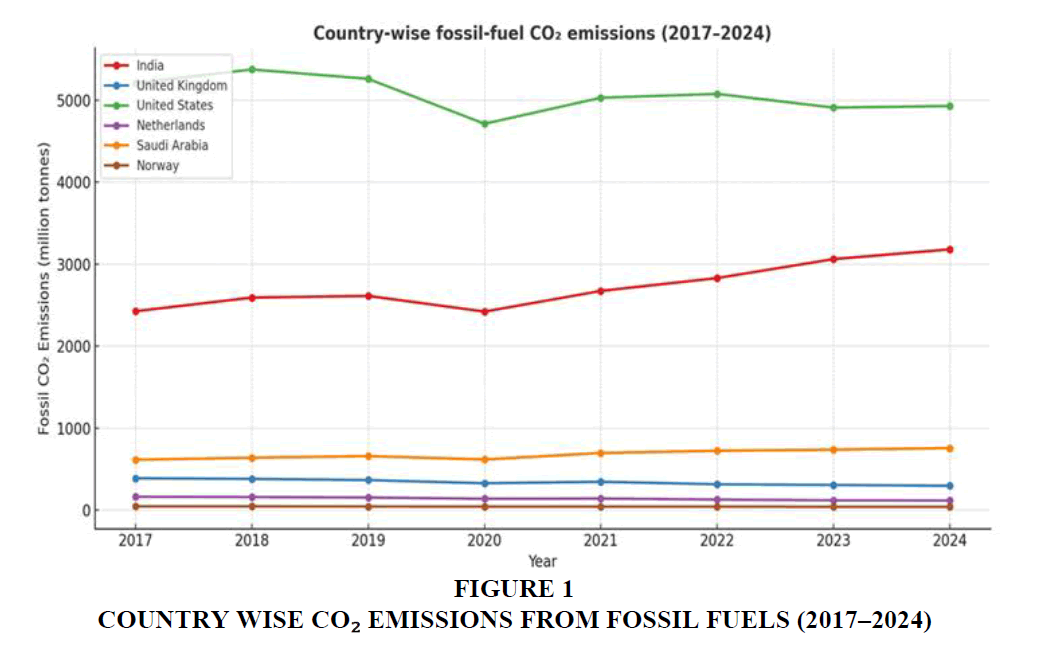
Figure 1 Country Wise Co2 Emissions From Fossil Fuels (2017–2024)
Data source: EDGAR – GHG emissions of all world countries 2025 report-IEA-EDGAR fossil CO2 emissions (EDGAR, 2024).
Company-Level Performance: The Carbon Intensity Imperative
Corporate emission performance offers a micro-level view of the transition landscape. A comparison of average carbon intensity (tCO2e/BOE) across leading oil and gas firms reveals a substantial disparity in operational efficiency. BOE stands for barrel of oil equivalent Table 1.
| Table 1 Emission Intensity by Company (Tco₂E/Boe) | ||
| S no. | Company | Average Emission Intensity |
| 1 | ONGC | 0.394 |
| 2 | Shell | 0.174 |
| 3 | ExxonMobil | 0.077 |
| 4 | BP | 0.041 |
| 5 | Aramco | 0.015 |
| 6 | Equinor | 0.00686 |
Climate Policy and National Commitments
National targets and policy performance play a pivotal role in shaping corporate behaviour. According to the Climate Change Performance Index (CCPI) 2025, countries like the United Kingdom, Norway, and the Netherlands not only have 2050 net-zero targets but also exhibit high ratings in climate policy enforcement, energy use, and renewable adoption Table 2.
| Table 2 Net-Zero Targets and CCPI 2025 Scores | |||||||
| S no. | Country | Net-Zero Target | Score* | GHG Emissions | Renewable Energy | Climate Policy | Energy Use |
| 1 | United Kingdom | 2050 | 69.29 | 29.67 | 6.46 | 17.11 | 16.06 |
| 2 | India | 2070 | 67.99 | 28.78 | 6.49 | 17.2 | 15.53 |
| 3 | Netherlands | 2050 | 69.6 | 27.29 | 12.12 | 17.28 | 12.91 |
| 4 | Norway | 2050 | 68.21 | 26.49 | 19.21 | 11.52 | 10.99 |
| 5 | Saudi Arabia | 2060 | 18.15 | 3.11 | 2.66 | 7.09 | 5.29 |
The evidence across emission trajectories, carbon intensity benchmarking, and policy frameworks converges on a clear imperative: global energy system must transition rapidly and equitably. This foundational insight sets the stage for subsequent research questions, which delve deeper into how oil and gas companies are adapting their fossil fuel portfolios (RQ2) and what renewable alternatives they are investing in (RQ3). The strategic responses to climate policy, stakeholder expectations, and operational risks all hinge on acknowledging the necessity of this transition.
Research Question 2: Which Fossil Fuel is being reduced more — Oil, Natural Gas, or VAPs?
This section builds on the foundation established in RQ1 by addressing the second core inquiry: Which fossil fuel—crude oil, natural gas, or value-added products (VAPs)—has been reduced (does it mean lower production) more substantially across major oil and gas companies? Using data from six global firms between FY2017 and FY2024, we apply Repeated Measures ANOVA and Panel Regression to quantify reduction trends and compare strategies.
Company-Level Trends
A comparative trend analysis across ONGC, Equinor, ExxonMobil, Shell, BP, and Aramco reveals distinct behaviour. Companies like Shell and ONGC have steadily reduced crude oil and VAPs (what about gas production of these companies), whereas Aramco and ExxonMobil, maintained or even increased their gas output. These shifts reflect strategic transitions, with natural gas emerging as a 'bridge fuel' Figure 2.
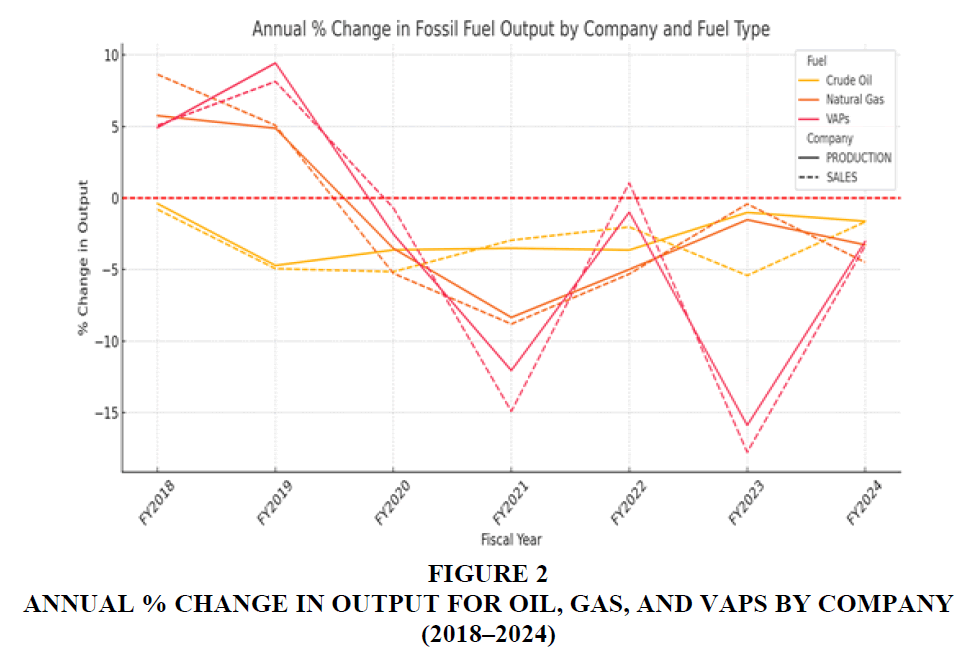
Figure 2 Annual % Change in Output for Oil, Gas, and VAPS by Company (2018–2024)
Data source: Companies Annual reports from 2017 to 2024.
Comparative Reduction by Fuel
Natural gas exhibits the highest median and average output change (often positive), while oil and VAPs show greater reduction volatility and lower averages Figure 3.
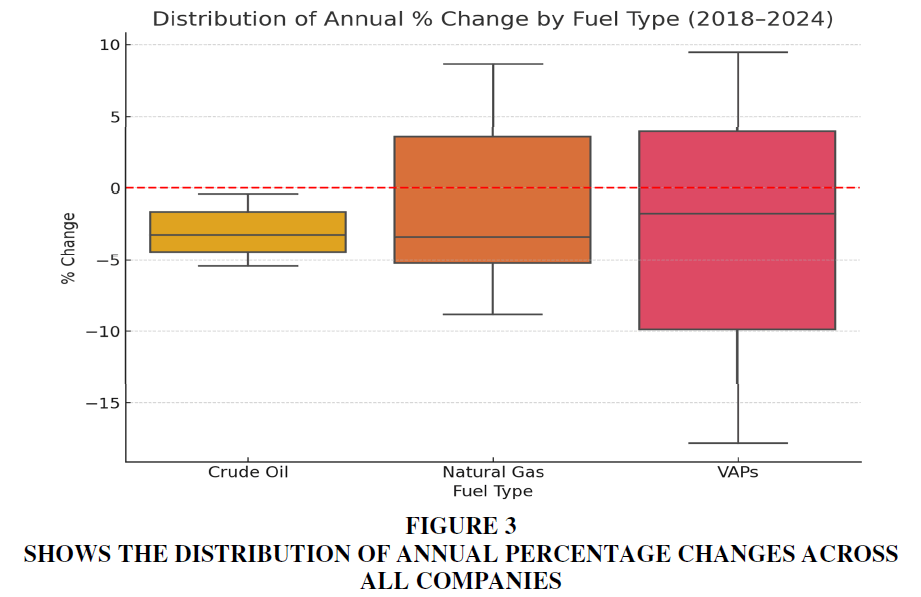
Figure 3 Shows the Distribution of Annual Percentage Changes Across All Companies
Repeated Measures ANOVA
To test whether the reduction rates across fossil fuels differ significantly, we performed a one-way repeated measures ANOVA. Each company’s average annual % change for Crude Oil, Natural Gas, and VAPs was treated as repeated measures.
Variables: In this repeated measures ANOVA, Fuel Type (Oil, Gas, VAPs) was the independent variable, and the Annual Percentage Change in Output served as the dependent variable. Each company was treated as a subject with repeated measurements across all three fuel types Table 3.
| Table 3 Anova Results Comparing Average % Reduction Across Fuel Types | |||
| Source | Sum of Squares | df | F / p-value |
| Fuel Type | 220.72 | 2 | F = 13.11, p = 0.002 |
| Residual | 2430.03 | 123 | — |
Statistical Model:
H0: μ_oil = μ_gas = μ_vap
H1: At least one mean reduction rate differs
ANOVA Results:
F(2,10) = 13.11, p ≈ 0.002
• Natural Gas exhibited relatively stable or growth in output for many companies (especially Aramco and ExxonMobil), indicating its role as a “transition fuel” in corporate strategy.
• Crude Oil and VAPs (like LPG, petrochemicals) showed greater average reductions, especially among companies like Shell, BP, and ONGC.
• The statistical result confirms that fuel type matters-companies are not reducing all fossil fuels uniformly
Panel Regression Analysis
The panel regression analysis was conducted to assess how fossil fuel production—specifically oil, natural gas, and value-added products (VAPs)—has changed over time across six major oil and gas companies from FY2018 to FY2024. The objective was to determine whether the reductions in fossil fuel output were driven primarily by temporal factors (year-wise trends) or by company-specific strategies. The model specification treated the annual percentage change in total fossil fuel output as the dependent variable, with time (Year) as the independent variable and company-level effects included to capture cross-sectional differences. After performing the Hausman Test, a Random Effects Model was selected, indicating that unobserved company-specific characteristics are not correlated with the independent variable (Year), making the random effects estimator appropriate.
Model Equation: Pct_Changeit = α + β1 * Yeart + β2 * Companyi + εit
We estimated a random effects model, justified by a non-significant Hausman test. This means company effects are assumed uncorrelated with the predictors and captured as random intercepts Table 4.
| Table 4 Panel Regression Results for Annual % Change In Total Fossil Fuel Output | |||
| Variable | Coefficient | z-Statistic | p-Value |
| Intercept (α) | -0.49 | -0.4 | 0.688 |
| Year (β₁) | 0.256 | 0.86 | 0.392 |
This analysis reveals that oil and VAPs have been reduced more significantly than natural gas from FY2018 to FY2024. Natural gas was often expanded, particularly by companies like Aramco and ExxonMobil. Statistical evidence from both ANOVA and panel regression models supports the conclusion that fuel type matters and that company-specific strategies, rather than time-driven reductions, determine the pace of fossil fuel decline.
• The coefficient for Year (+0.256) suggests a slight upward trend in fossil fuel output over time, but this effect is not statistically significant (p = 0.392).
• The p-value greater than 0.05 indicates that time alone does not significantly explain changes in fossil fuel production.
• The intercept is also statistically insignificant, indicating no strong baseline trend when controlling for company-level differences.
• These results imply that fossil fuel reduction patterns are not uniformly driven by the passage of time (i.e., external market or policy trends).
• Instead, they are more likely influenced by internal company strategies, such as renewable transition plans, capital allocation priorities, ownership structure, or national policy alignment.
Research Question-3: What Renewable Energy Alternatives Are Being Adopted by Oil and Gas Companies?
This section explores the renewable energy alternatives adopted by six leading oil and gas companies Shell, BP, Equinor, ExxonMobil, ONGC, and Aramco for the period 2017 to 2024. The alternatives investigated include solar power, wind power, hydrogen production, carbon capture utilization and storage (CCUS), and battery energy storage. The objective is to determine not only which technologies are being adopted but also how investment in each correlates with the share of capital expenditure allocated to renewable energy (RE CapEx %).
Descriptive Analysis
Shell, BP, and Equinor demonstrated diversified investment across solar, wind, and hydrogen, reflecting balanced low-carbon strategies. ExxonMobil and Aramco focused more narrowly on hydrogen and CCUS, with limited development in wind or solar. ONGC’s engagement remained modest in absolute terms across all technologies but is now broadening in scope—consistent with the recent step-up via ONGC Green Ltd and M&A-led additions.
Figure 4 shows the total global investments (across these 6 companies) in various renewable energy technologies from 2017 to 2024:
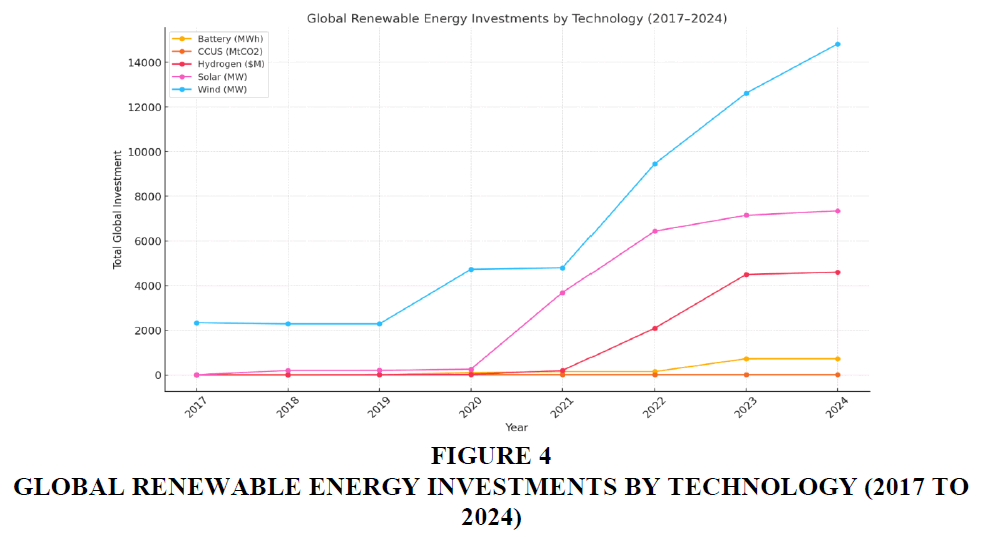
Figure 4 Global Renewable Energy Investments by Technology (2017 TO 2024)
• Solar and Wind dominate in absolute investment capacity (MW).
• Hydrogen and CCUS show sharp growth in later years, especially after 2020.
• Battery storage is still small but emerging from 2023–24.
Average Investment by Company (2017–2024)
Figure 5 compares average annual investment by company across the five renewable technologies:
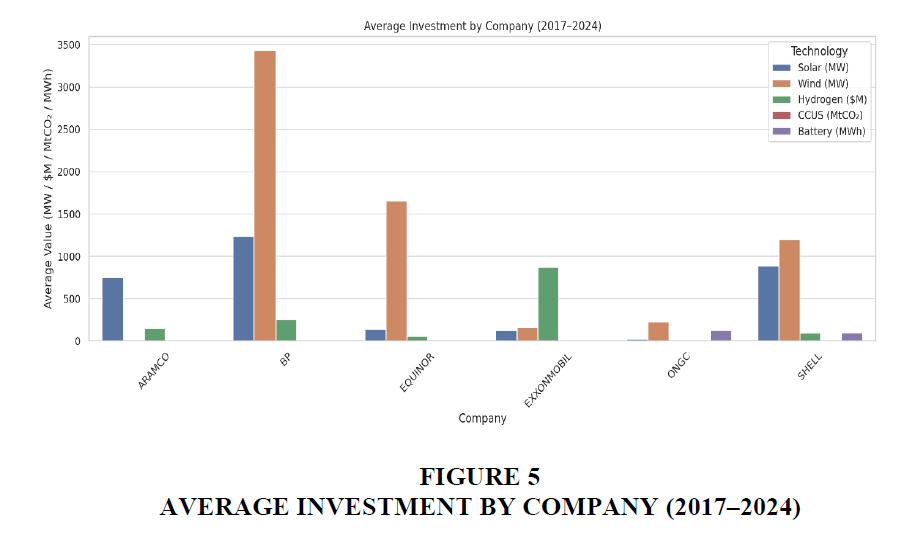
Figure 5 Average Investment by Company (2017–2024)
• Equinor and BP lead in wind investments.
• Shell and BP dominate in solar.
• ExxonMobil and Aramco focus heavily on CCUS and hydrogen but have minimal wind or solar.
• ONGC has kept modest investments across categories but is now scaling up, with ONGC Green Ltd and acquisitions.
PCA (Principal Component Analysis)
To uncover dominant investment patterns and how companies differ in strategy. It is a multivariate statistical method used for dimensionality reduction. It transforms a set of correlated variables into a new set of uncorrelated variables called principal components (PCs), which are linear combinations of the original variables. Mathematically, PCA is performed by computing the eigenvalues and eigenvectors of the covariance matrix of the standardized dataset. Standardization ensures that all input variables (e.g., solar capacity in MW, hydrogen investment in $M) are scaled to have a mean of zero and unit variance. In this study, PCA was applied to the standardized investment data across five renewable technologies—solar, wind, hydrogen, CCUS, and battery storage—for six oil and gas companies during the period 2017 to 2024. The first two principal components, which captured the maximum variance, were selected to visualize inter-company strategic patterns. The analysis was conducted using Python libraries such as scikit-learn and matplotlib for computation and plotting Figure 6.
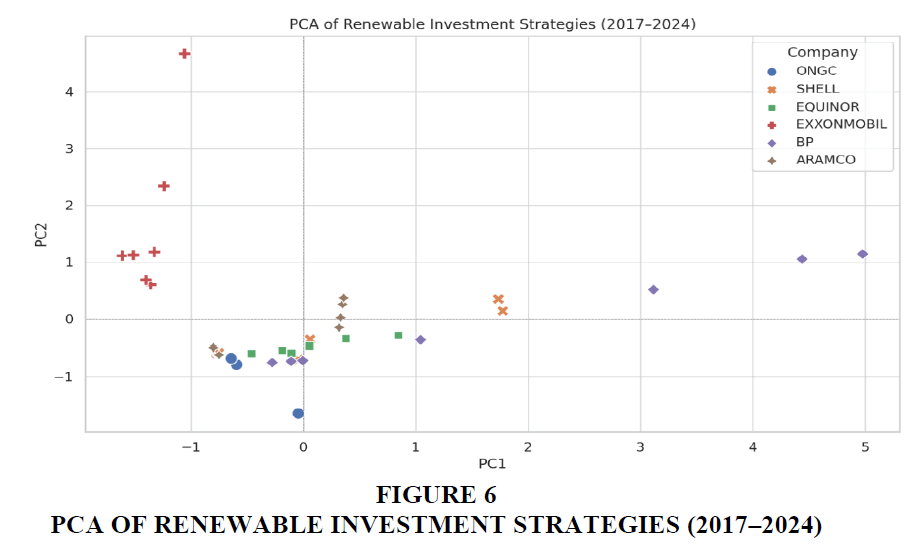
Figure 6 PCA of Renewable Investment Strategies (2017–2024)
This PCA plot shows how companies differ in their renewable energy investment strategies:
• Shell, Equinor, and BP cluster closely, indicating balanced investment across multiple technologies.
• ExxonMobil and Aramco diverge strongly along one axis — reflecting their emphasis on hydrogen and CCUS over solar/wind.
• ONGC remains closer to the origin, suggesting low-to-moderate but diverse investments without dominance in any single tech.
Cluster Analysis
Company Clusters by Renewable Strategy (KMeans on PCA)
Figure 7 analysis groups companies based on their renewable energy strategies:
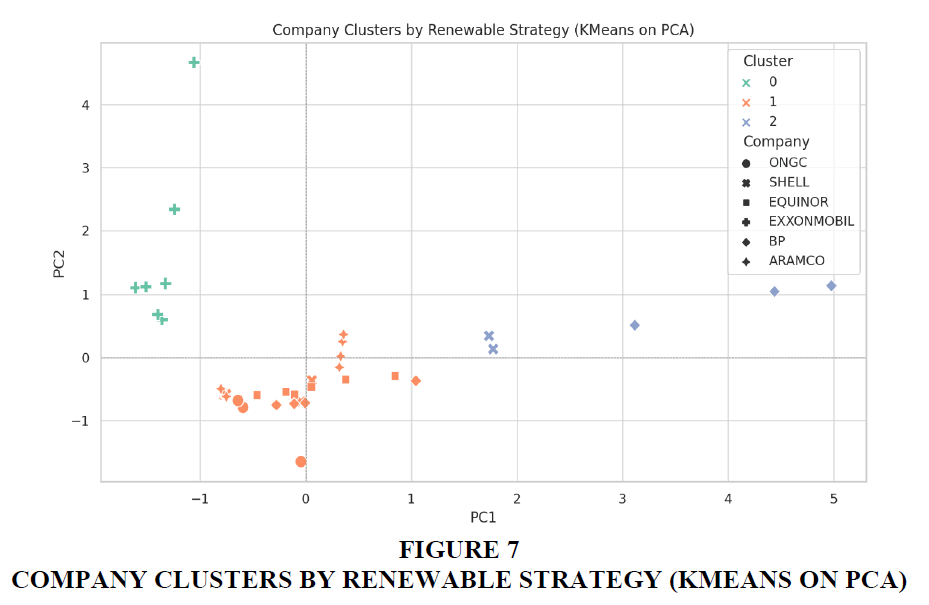
Figure 7 Company Clusters by Renewable Strategy (Kmeans on PCA)
• Cluster 0: Focused, large-scale renewable players (e.g. Shell, BP, Equinor)
• Cluster 1: Low-diversity, high CCUS/hydrogen emphasis (e.g. Aramco, ExxonMobil)
• Cluster 2: Balanced, measured approach (e.g. ONGC)
PCA revealed that Shell, BP, and Equinor cluster together with high renewable diversity, while Aramco and ExxonMobil diverge on hydrogen/CCUS. ONGC appears neutral or moderately invested. KMeans clustering grouped these firms into three strategic typologies: diversified investors, hydrogen/CCUS-focused, and conservative movers.
This regression estimates how each renewable technology contributes to the percentage of capital expenditure a company allocates to renewables.
• OLS Regression Insights: The regression model used RE CapEx % as the dependent variable and the five renewable technologies as predictors. The results are summarized below:
• Wind (MW): Significant positive predictor (p = 0.002). Each additional MW of wind is associated with a +0.0027% increase in RE CapEx %. <<text repeated in the table 5 below>>
| Table 5 Interpretation of Results | |||
| Variable | Coefficient | P-value | Interpretation |
| Wind (MW) | 0.0027 | 0.002 | Statistically significant – Every additional MW of wind capacity is associated with a +0.0027% increase in RE CapEx %. |
| Hydrogen ($M) | 0.0039 | 0.047 | Significant at 5% – Every $1 million in hydrogen investment adds ~+0.004% to RE CapEx. |
| Solar (MW) | –0.0006 | 0.698 | Not significant – Solar capacity doesn’t show clear relation to CapEx % (likely due to PPA or JV structure). |
| CCUS (MtCO₂) | 0.0449 | 0.912 | Not significant – Despite large-scale CCUS projects, they may not reflect annual CapEx. |
| Battery (MWh) | 0.0052 | 0.568 | Not significant – Small-scale deployments so far. |
• Hydrogen ($M): Statistically significant (p = 0.047). Every $1 million in hydrogen investment adds +0.0039% to RE CapEx %.
• Solar (MW), CCUS (MtCO2), and Battery (MWh): Not statistically significant.
The model explains approximately 40.5% of the variance in RE CapEx %. The strongest predictors of renewable investment were wind and hydrogen, highlighting companies' prioritization of scalable clean energy infrastructure and decarbonized fuels.
Results and Interpretation
This section interprets the findings from each research question using descriptive and inferential statistical models to derive actionable insights into how oil and gas companies are responding to the energy transition.
Research Question 1: Understanding the Need for Energy Transition
The analysis of country-level CO2 emissions showed divergent national trends. While emissions in India increased significantly due to industrial growth, countries like the UK and Netherlands achieved steady declines, reflecting the impact of stringent policy frameworks and structural changes in energy use. When assessed at the company level, emission intensity data revealed substantial variation: Equinor and Aramco demonstrated the lowest carbon intensity, while ONGC and Shell had higher levels. ONGC, however, showed tangible improvements with a 12% reduction in emissions intensity between 2020 and 2024. These patterns suggest that national policy direction and company strategy play a crucial role in driving decarbonization. Countries with clear net-zero targets and robust climate policies appear to exert stronger pressure on corporate action, as reflected in higher Climate Policy Index scores.
Research Question 2: Which Fossil Fuel Is Being Reduced More — Oil, Natural Gas, or VAPs?
The descriptive trend analysis indicates that production of crude oil and VAPs have seen consistent reductions across firms, whereas natural gas output has remained stable or grown, particularly for ExxonMobil and Aramco. Repeated Measures ANOVA confirmed this distinction, showing a statistically significant difference in mean reduction rates across the three fossil fuels (F(2,10) = 13.11, p = 0.002). This finding supports the claim that fuel type matters, and that natural gas is being strategically retained as a transition fuel by several companies.
Panel regression results further revealed that company-specific factors have more influence than the passage of time in explaining fossil fuel reduction patterns. The coefficient for “Year” was not statistically significant (p = 0.392), suggesting that the reductions were not uniformly driven by external temporal trends, but rather by internal firm-level decisions. This validates the hypothesis that strategic intent, ownership structure, and regional policy alignment are more decisive than time alone in influencing fossil fuel phase-down.
Research Question 3: What Renewable Energy Alternatives Are Being Adopted?
Descriptive statistics and investment data from 2017 to 2024 show that Shell, BP, and Equinor have adopted diversified renewable portfolios—investing across solar, wind, and hydrogen. In contrast, ExxonMobil and Aramco focus heavily on hydrogen and CCUS, with minimal investment in wind and solar. ONGC’s investments, though moderate in scale, are strategically distributed across all technologies, reflecting a methodical and capacity-building approach consistent with India’s net-zero vision.
PCA results revealed that companies naturally cluster based on their dominant renewable focus. Shell, BP, and Equinor form one cluster characterized by balanced renewable adoption, while Aramco and ExxonMobil cluster separately due to their emphasis on CCUS and hydrogen. ONGC occupies a more neutral space, indicating a balanced transition.
Cluster analysis using KMeans confirmed these strategic groupings:
• Cluster 0: High renewable diversity (Shell, BP, Equinor)
• Cluster 1: Low-diversity, hydrogen/CCUS-focused (Aramco, ExxonMobil)
• Cluster 2: Balanced, measured (ONGC)
OLS regression was used to statistically test which technologies influence RE CapEx %. The results indicate that wind (p = 0.002) and hydrogen (p = 0.047) are the only statistically significant predictors of renewable capital expenditure. Solar, CCUS, and battery storage did not show significant effects, likely due to co-investment models (e.g., PPA structures) or early-stage deployment.
The model had an R-squared value of 0.405, explaining over 40% of the variance in RE CapEx %. This suggests a reasonably strong model fit for a cross-company investment behavior analysis.
Conclusion
This paper provides one of the first comparative panel studies of fossil fuel reduction and renewable integration in oil and gas majors.
This research presents a comprehensive, data-driven evaluation of how six major oil and gas companies ONGC, Aramco, ExxonMobil, Shell, BP, and Equinor are navigating the global energy transition between 2017 and 2024. Drawing from emissions data, investment disclosures, and quantitative models, the findings reveal an uneven and differentiated transition landscape shaped by national policies, ownership structures, and strategic priorities.
We find that transition pathways vary by geography, ownership, and policy environment. Companies in Europe are far ahead in renewables deployment. U.S. and Middle Eastern firms lag but show activity in CCUS and hydrogen. Overall, the energy transition remains uneven.
For net-zero alignment, transparency, scaled investment, and policy-guided planning are critical. Future studies should incorporate Scope 3 emissions and cost-adjusted metrics for more granular analysis.
The first key insight is the urgent need for transition, supported by rising emissions and climate policy trajectories. Countries with aggressive net-zero targets tend to host companies that perform better on carbon intensity and renewables integration.
Second, fossil fuel reduction patterns vary markedly by fuel type. While oil and VAPs have declined across most firms, natural gas continues to grow, especially for Aramco and ExxonMobil, reinforcing its role as a “bridge fuel.” Statistical analysis via Repeated Measures ANOVA and panel regression affirms that reduction trajectories are company-specific, not uniformly time-driven.
Third, the adoption of renewable alternatives shows distinct clusters of corporate strategy. Shell, BP, and Equinor have emerged as leaders in solar, wind, and hydrogen, while Aramco and ExxonMobil favor hydrogen and CCUS, often neglecting solar and wind. ONGC demonstrates a measured but expanding approach, broadening its exposure through ONGC Green Ltd and recent M&A additions (~2.5 GW). Importantly, ONGC’s goal of achieving net zero (operational emissions) by 2038 provides a 32-year lead window relative to India’s 2070 net-zero target- ample space to stage projects without disruptive cliff-edge transitions. PCA and clustering affirm these strategic typologies, while OLS regression highlights wind and hydrogen as the most significant drivers of RE CapEx allocation.
Overall, the study underscores that while momentum is growing, the energy transition remains fragmented. The pathways to net-zero are diverse, and their success depends on greater transparency, standardized reporting, and policy-aligned investment frameworks. Future research should integrate Scope 3 emissions, lifecycle investment returns, and scenario-based forecasting to further enrich our understanding of corporate decarbonizations.
References
Adebayo, Y. A., Augusta, H. I., Jephta, M. K., & Andrew, E. E. (2024). Energy transition in the oil and gas sector: Business models for a sustainable future. Int. J. Manag. Entrep. Res, 6, 3180-3208.
Indexed at, Google Scholar, Cross Ref
Christensen, H. B., Hail, L., & Leuz, C. (2021). Mandatory CSR and sustainability reporting: economic analysis and literature review: HB Christensen et al. Review of accounting studies, 26(3), 1176-1248.
Indexed at, Google Scholar, Cross Ref
Chrysikopoulos, S. K., Chountalas, P. T., Georgakellos, D. A., & Lagodimos, A. G. (2024). Decarbonization in the oil and gas sector: The role of power purchase agreements and renewable energy certificates. Sustainability, 16(15), 6339.
Indexed at, Google Scholar, Cross Ref
Dimitriou, D., Sartzetaki, M., Karagkouni, A., & Efstratiou, V. (2025). Corporate Strategy for Sustainable Development in the Oil and Gas Industry: Drivers, Agility Mechanisms, and SDG Alignment. Journal of Sustainability Research, 7(3).
Indexed at, Google Scholar, Cross Ref
Dongo, D. F., & Relvas, S. (2025). Evaluating the role of the oil and gas industry in energy transition in oil-producing countries: A systematic literature review. Energy Research & Social Science, 120, 103905.
Indexed at, Google Scholar, Cross Ref
EDGAR – Emissions Database for Global Atmospheric Research. (2024). EDGAR Report 2024. European Commission, Joint Research Centre
Ekemezie, I. O., & Digitemie, W. N. (2024). Carbon capture and utilization: Emerging applications and challenges. Engineering Science & Technology Journal.
European Commission, Joint Research Centre (JRC), and PBL Netherlands Environmental Assessment Agency. Emissions Database for Global Atmospheric Research (EDGAR) — 2025 Release.
Ganter, A., Gabrielli, P., Goericke, H., & Sansavini, G. (2024). Minimum-regret hydrogen supply chain strategies to foster the energy transition of European hard-to-abate industries. arXiv preprint arXiv:2407.05988.
Indexed at, Google Scholar, Cross Ref
Hanson, E., Brown, T., & Lee, S. (2025). Carbon capture, utilization and storage technologies. Cleaner Engineering and Technology.
Hassan, S., Ahmed, M., & Rahman, K. (2024). Harnessing hydrogen in the energy market. International Journal of Energy Research.
Herzog-Hawelka, J., & Gupta, J. (2023). The role of (multi) national oil and gas companies in leaving fossil fuels underground: A systematic literature review. Energy Research & Social Science, 103, 103194.
Indexed at, Google Scholar, Cross Ref
International Energy Agency. (2021). Net zero by 2050: A roadmap for the global energy sector.
International Energy Agency. (2023). CO₂ emissions in 2022.
Jarboui, S., & Alofaysan, H. (2024). Global Energy Transition and the Efficiency of the Largest Oil and Gas Companies. Energies, 17(10), 2271.
Indexed at, Google Scholar, Cross Ref
Joshi, S., Sharma, M., Kumar, A., Joshi, T., Johri, A., & Alfehaid, M. (2025). Sustainable energy transition towards decarbonization among developing countries: a systematic literature review. Frontiers in Sustainability, 6, 1641299.
Indexed at, Google Scholar, Cross Ref
Liu, L., Liu, C., Wei, J., & Ge, J. (2025). Prospects of CCUS technology under resource utilization and environmental risks. iScience, 28(10).
Indexed at, Google Scholar, Cross Ref
Mazzucato, M., & Semieniuk, G. (2018). Financing renewable energy: Who is financing what and why it matters. Technological Forecasting and Social Change, 127, 8-22.
Indexed at, Google Scholar, Cross Ref
Mejia, C., & Kajikawa, Y. (2024). Estimating scope 3 greenhouse gas emissions through the shareholder network of publicly traded firms. Sustainability Science, 19(4), 1409-1425.
Indexed at, Google Scholar, Cross Ref
Reda, B., Ahmed, S., & Khan, M. (2024). Green hydrogen as a renewable energy source. Environment, Development and Sustainability.
Sæverud, I., Berrêdo, P. D., Abdo, H., Macedo, M. Á., & Losekann, L. (2024). Energy transition: Assessing oil companies’ compliance with climate commitments. Corporate Social Responsibility and Environmental Management.
Indexed at, Google Scholar, Cross Ref
Shojaeddini, R., Johnston, D., & Wilson, E. (2019). Should BIPV technologies be empowered by innovation policy mix to facilitate energy transitions. Energy Policy, 129, 452–460.
Indexed at, Google Scholar, Cross Ref
Smit, D. J., & Powell, J. B. (2023). Role of international oil companies in the net-zero emission energy transition. Annual Review of Chemical and Biomolecular Engineering, 14, 301-322.
Indexed at, Google Scholar, Cross Ref
Song, G., Zhao, X., Zhang, Y., Lv, L., Guan, D., & Liu, G. (2025). The hydrogen-to-carbon mole perspective reveals cleanness and inequality of global and national fossil fuel transition. Nature Communications.
Indexed at, Google Scholar, Cross Ref
Transition Pathway Initiative Centre. (2022). State of Transition Report 2022.
Wang, Z., Li, S., Jin, Z., Li, Z., Liu, Q., & Zhang, K. (2023). Oil and gas pathway to net-zero: Review and outlook. Energy Strategy Reviews, 45, 101048.
Indexed at, Google Scholar, Cross Ref
Wang, Z., Yuan, P., Yu, H., Ma, Q., Xu, B., & Zhao, D. (2025). Carbon Capture, Utilization and Storage: Technology, Application, and Policy. Processes, 13(11), 3414.
Indexed at, Google Scholar, Cross Ref
Zhang, K., He, L., Jiang, L., Jiang, S., Yu, R., Lau, H. C., ... & Chen, Z. (2024). The role of hydrogen in the energy transition of the oil and gas industry. Energy Reviews, 3(4), 100090.
Indexed at, Google Scholar, Cross Ref
Received: 18-June-2026, Manuscript No. AMSJ-26-17313; Editor assigned: 18-June-2026, PreQC No. AMSJ-26-17313(PQ); Reviewed: 01-July-2026, QC No. AMSJ-26-17313; Revised: 06-July-2026, Manuscript No. AMSJ-26-17313(R); Published: 13-July-2026