Research Article: 2021 Vol: 25 Issue: 3
Structure, Conduct And Performance Of Teff Market: The Case Of Adola Rede Woreda, Guji Zone, Oromia National Regional State, Ethiopia
Mengistu Bululta, Bule Hora University
Tinsae Demise, Dilla University
Abstract
Keywords
Structure, Conduct and Performance.
Introduction
Background of the Study
According to the famous Russian botanist, agronomist, plant geneticist and plant breeder Nikolai IvanovichVavilov’s (1992), conclusion, Ethiopia is the center of origin of Teff (Eragrostis Teff) after an expedition to Egypt and Somalia in 1927. This was later confirmed by the renowned US plant geneticist Jack Harlan who called Teff “the noble cereal of Ethiopia” (Andersen & Winge, 2012). Teff is indigenous to Ethiopia and it is an important crop, for farm income as well as food security to its people which is grown primarily as a cash crop.
On the consumption side, Teff makes up as much as 12 percent of all food expenditures and is therefore for consumers the leading food crop in their consumption basket (FAO 2012). Compared with other cereals, Teff is hardy and able to withstand adverse weather conditions and is therefore considered a lower risk crop (Fufa et al. 2011). Teff is mostly grown at middle elevations between 1,800 and 2,200 meters above sea level and in regions where there is adequate rainfall. These characteristics, together with it being easy to store, seemingly explain the sustained importance of Teff in the country. Its grain is mainly used for making injera, a spongy flat bread, Ethiopia’s (and Eritrea’s) main national dish.
Teff is Ethiopia’s most valuable staple crop which is cultivated over approximately 3.02million hectares, accounts for 24 percent of land area under cereal cultivation, and the largest share of all staple grains in Ethiopia. In 2017, Teff accounts for 3,017,914 (24percent) of the grain area, followed by maize 2,135,371 (17percent), sorghum 1,881,970 (15percent) and 3.675ton/ha and 2.525ton/ha, 1.664 ton/ha yield respectively. And it is the second most important cash crop, generating 464$ million per year for farmers (Hyejin 2018).
One of the fascinating features of agricultural marketing systems in market economies is that, their structure is determined or influenced by a wide range of factors. These include economic, demographic, social, legal and climatic factors as well as the characteristics of the raw materials and consumer products. Effective marketing systems are shaped by these influences and were tending to change as these underlying influences change. Thus they are often well adjusted to the environment in which they operate. Sometimes, however, it is possible to intervene in the marketing process in ways that improve the functioning of the system or accelerate changes that are already underway (Lawrence, 2003).
Amhara and Oromia are the two major regions, and collectively, the two regions account for 85.5percent of the Teff area and 87.8 percent of the Teff production. Due to the high price, the urban affluent consumers consume relatively more Teff than the rural poor. Nevertheless, Teff has shortcomings to become an income-generating global commodity for Ethiopian producers. Some of the shortcomings are low yields compared to other major cereals, high labor-input requirement, lack of infrastructure, and limited or inefficient market (Hyejin 2018).
The study area is found in East Guji Zone, Oromia Regional State (ORS). Teff is the main cash crop and an income source of smallholder farmers in the study area. However, the Woreda’s Teff market chains have not been studied yet. In order to solve basic crops marketing problems and to analyze its role towards improving the livelihood and income level of farmers, the role of marketing investigation is indispensable. Therefore, it is necessary to study the market chain from production to end consumers to identify gaps. Thus, the current study focused on the structure, conduct and performance of Teff market, and factors affecting the supply of Teff to the market in case of this Woreda.
Statement of the Problems
The agricultural sector in Ethiopia still continues to face a set of constraints that restrict further accelerated growth. Some of these constraints can be underdeveloped markets at federal and regional levels, public and private sector partners‟ lack of capacities to implement. The efforts of increasing agricultural production and productivity have to be accompanied by a well-performing marketing system which satisfies consumer demands with the minimum margin between producers and consumers prices. That is, higher prices for producers can encourage farmers to adopt new technologies and increase production (Wolday, 1994).
Improved information and marketing facility enables farmers to plan their production more in line with market demand, to schedule their harvest at the most profitable time, to decide which market to sell their produce to and negotiate on a more even footing with traders and it also enables traders to move their produce profitably from a surplus to deficit market and to make decisions about the economics of storage, where technically possible. Thus the market information is critical to the law of one price and to the price discovery process (Khol & Uhl, 2002).
Provision of improved and high yielding varieties, chemical fertilizer, pesticides and insecticides may favour the farmer in increasing production; however, this is not an end by itself. Therefore, Khuls and Uhl (2002) without modern marketing system, including communications, transportation, storage facilities and financial arrangement this is not possible.
In addition to the above researcher, (Jema 2008) the Ethiopian agricultural output markets are characterized by inadequate transport network, limited number of traders, inadequate capital facilities, high handling costs, inadequate market Information system, weak bargaining power of farmers and underdeveloped industrial sectors. Farmers in Ethiopia are more focused on the production part without having adequate market information about their products.
One of the fascinating features of agricultural marketing systems in market economies is that, their structure is determined or influenced by a wide range of factors. These include economic, demographic, social, legal and climatic factors as well as the characteristics of the raw materials and consumer products. Effective marketing systems are shaped by these influences and were tending to change as these underlying influences change. Thus they are often well adjusted to the environment in which they operate. Sometimes, however, it is possible to intervene in the marketing process in ways that improve the functioning of the system or accelerate changes that are already underway (Lawrence, 2003).
Thus, if market performance is inefficient, the sustainability of the production become questionable and, as a result, a steady supply of a commodity for the market may become difficult. The crucial role of market oriented agriculture and, hence, an efficient agricultural marketing system, is also apparent from the pivotal role that agricultural growth must play in driving overall economic growth of Ethiopia (Jema 2008).
Teff is a major crop produced by the majority of farmers in Adola (2019) Rede Woreda. This Woreda also have 85 percent of land cultivated for Teff production that characterized by high potential in production of this crop. Its income generating capacity is low as compared to its production potential, which discourages farmers to produce more for the market, due to factors such as; long distance to the market, lack of access to market, use of traditional marketing system, lack of properly functioning marketing system which often resulted in lower producers‟ price,” inefficient market chain, lack of market information through mass media (radio, television,), lack of infrastructure (transportation, storage facilities), lack of linkages with traders, broker interference and the others. As a result, these problems needs more work in market chain approach to fully understand and resolve the problem of Teff market in the study area.
Even though some related studies on Teff marketing such as (Tadele, et al., 2016), (Wolday 1994), (Yadeta & Temesgen 2016); (Muhammed 2011); (Azebe & Tadele 2017); (Girma 2015) were carried out elsewhere in Ethiopia, to the best of my knowledge, such study that provides relevant information for improving the marketing of Teff in the study area had not been undertaken. Therefore, the critical clues here would be, how these unorganized traditional marketing system be changed to modernized and organized market and would enable to increase the incentive of the producers to produce efficiently and thereby increase their income by selling their product in appropriate market with better return rather than locally or traditionally. Not only this but also this study have the purpose of identifying market chain actors and their roles, and assessing the marketing performance of Teff markets which will narrow the information gap on the subject, choose the best channel to increase their income and will contribute to better understand on improved strategies for reorienting marketing system for the benefit of smallholder farmers and traders. Thus, this study attempted to fill this gap by conducting market chain analysis which generates appropriate information, which will benefit all the stakeholders (smallholder farmers, traders, and other market participants) involved in production and marketing of the product.
Research Questions
The study is attempted to answer the following basic questions;
1. What are the existing Teff market structure, conduct and performance of the study area look like?
2. What are the major constraints and opportunities in Teff productions and supply to market in the study area?
Objectives of the Study
The General objective of this study is to analyze the structure conduct and performance of Teff market in the study area and specifically to identify the major constraints and opportunities in Teff production and supply to market in the study area
Research Methodology
Description of the Study Area
Adola Rede Woredais located in East Guji Zone of Oromia Regional State, with an estimated area covering 1401 square kilometers. It is located at 475 km away from Addis Ababa, the capital city of Ethiopia and 142 km away South West from Hawasa, the capital city of South Nations, Nationalities, and Peoples Region. It is boardered on the South and East by the Shakiso Woreda, on the west by Wadera Woreda and on the North by Annaa Sorraa Woreda. Topographically, the Woreda is located at an elevation of 1500 to 2500 meters above sea levels and the Woreda also located at latitude and longitude of 6012’38”N and 39012’37”E respectively ARDAO (2019). Geographical location of the study is shown in Figure 1 below. The Woreda consists of 3 Urban and 28 Rural Kebeles with an estimated total population of 149,735 of which 77,862 are male and 71,873female (CSA, 2015). From the entirely population Men are 52% and the remaining 48% are Females.

Figure 1 MAP of the Study Area
According to the classification used in Ethiopia, the climatic condition of the Woredais characterized as Woina Dega climatic Zone. The area receives a bimodal rainfall where the high rains are between August to October and the small rains are from February to April. However, during the main rain, all crops grown in the area are planted including Maize, Teff, Wheat, Sorghum, but Teff crop is intolerant to excessive rainfall. The best time for sowing period is found to be from beginning of September to mid October when cultivated as rain fed crop. Maturity depends on the weather condition and it is usually varies from 90-115days, the harvesting time found to be from the beginning of January to February. The Woreda has 33 percent, 24 percent, 30 percent, 20 percent and 17 percent of arable, under cultivation, pasture, forest and the other considered as swampy, degraded or otherwise unusable, respectively. Temperature of the area ranges between 12oc and 18oc with an average of mean annual Temperature of about 20oc. the mean annual rainfall is 1700mm. Lowland, Midland and Highland agro-ecological zones characterize the Woreda’s climate. The soils of the area are believed to be a relatively fertile and during good rains farmers can harvest good yield even without fertilizer application (ARDAO 2019).
Sources and Methods of Data Collection
In order to collect the reliable data, both primary and secondary sources of data were used. The primary data was collected from farmers (sample households of Teff producers), traders and the others those who have a relationship with this focus area, using unstructured questionnaire, personal observation, oral interview, and key informant Interview. Secondary data was collected by reviewing documents of secondary sources namely: Adola Woreda Office of Agriculture, and Office of Trade. Beside to Woreda offices information, published and unpublished documents, bulletins and websites were visited to generate relevant secondary information focusing on Teff marketing.
Sampling Technique and Sample Size Determination
The smallholder Teff producers and other actors (i.e. Traders) along the Teff market chain were the basic sample unit of this study. Multistage sampling procedure combining both purposive and simple random sampling was used to identity farmers to include in the sample. In the first stage out of fourten rural Woredas of Guji Zone, Adola Rede Woreda is selected purposively as it is one of the highest Teff producing Woredas in this zone.
The Woreda has four Urban and 28 Rural Kebeles. In the second stage, from the total of 28 Rural kebeles of the Woreda, three Teff producing kebeles were selected randomly because of homogeneity of production. Finally, among total 1,943 of Teff producer household heads that exist in three kebeles namely; Gunacho, Bilu and Orone, 121 samples of household heads were selected randomly using probability proportionate to size. And also 13 traders were selected purposively. Sample size was determined following a simplified formula provided by Yamane (1967). Accordingly, the required sample size at 95percent confidence level with degree of variability of 5percent and level of precision equal to 8.9 percent was used to determine a sample size required to represent the population. I .e. 8.9 percent level of precision used here is to manage the sample size that fit the number of explanatory variables, because, with the simple ‘rule of thumb’ the sample size should be 10 for each independent variable, due to this, the researcher need to have at least a minimum of 120 sample in Table 1.
| Table 1 Sample Distribution of Teff Producers in Selected Kebeles. | |||
| No | Kebeles | Total number of Teff producers | Number of sample household selected |
| 1 | Gunacho | 670 | 48 |
| 2 | Orone | 608 | 33 |
| 3 | Bilu | 665 | 40 |
| Total | 1943 | 121 | |
The sample size for the study was determined by Yamane (1967).
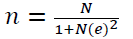 N=1,943, Then the sample size (n) =121
Where, ‘n’ is the designed sample size, ‘N’ is the total number of Teff producer household heads and ‘e’ is the level of precision (margin of errors) at 8.9 percent.
Methods of Data Analysis
Different types analytical methods were used to evaluate the research results and make a sound conclusion for a given survey information. In this study, data was analyzed using Descriptive and Inferential statistical methods.
Descriptive Statistical Analysis
Descriptive analysis such as mean, standard deviation, ratio, frequency and percentiles is used in order to explain and interpret the data obtained from sampled households and trader’s socio-economic characteristics, structure, conduct and performance of Teff markets. The collected raw data were analyzed by using the STATA version 13. The indicators which were used in this part of the analysis are as follows:
Structure – Conduct -performance (S-C-P)
This model is an analytical approach used to study how the structure of the market and the behavior of sellers of different commodities and services affect the performance of market, and consequently the welfare of the country as a whole (Kizito, 2008).
The model examines the causal relationships between market structure, conduct and performance, and is usually referred to as the structure - conduct - performance (S-C-P) model.
It is based on the theory that the structure of a market (S) determines market conduct (C), which then determines market performance (P), and that higher concentration ratios generate welfare losses by competition restricting activities (Abbott & Makeham, 1981). Many researchers that conducted their research on market area used this model. Therefore, this study used this model to evaluate the efficiency of Teff market in the study area.
Market structure: Market structure consists of the relatively stable features of the environment that influence the behaviour and rivalry among the buyers and sellers operating in a market (Branson and Norvell, 1983). For example, if the market structure is characterized by high barriers to entry, it may result in only a few traders profitably maintaining the business activities. These few traders may engage in non-competitive behaviour such as collusion and exclusionary or predatory price setting behaviour. These non-competitive behaviours can result in excessive profits and widened marketing margins for traders. The major structural elements which are most critical to performance analysis are the following:
Market concentration: This refers to the number and size, distribution of sellers and buyers in the market. The greater the degree of concentration the greater will be the possibility of non-competitive behaviour, such as collusion existing in the market (Pomeroy and Trinidad, 1995). This means that when there are few buyers and sellers, they may engage in non-competitive behaviours such as collusion and price discrimination, when there are few buyers of a commodity, traders offer sellers low prices which reduce the income of sellers. If there are few sellers of a commodity in the market, then sellers gain market power and increase prices, which reduce the amount of commodity that buyers can purchase with a given amount of income, therefore, making them relatively poorer than if prices were lower. The most commonly used measure of concentration indices are:
Concentration ratio (CRr): This measure shows the proportion of the industry’s output accounted for by r largest firms:
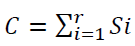 Where;- i=1, 2, 3, 4……………..r,
C- is concentration ratio, Si- is market share firm ith and r- Number of largest firms for which the ratio is going to be calculated.
 Where, Si = market share of firm i; Vi = amount of product handled by firm i; and ΣVi =Total amount of the product supplied to the market.
In this regard, Kohls and Uhl (1985) bring into play as a rule of thumb, four largest enterprises’ concentration ratio of 50percent or more (an indication of a strongly oligopolistic industry), 33-50 percent (a weak oligopoly) and less than that (competitive or non-concentrated industry).
Barriers to entry: Barriers to market entry include a number of different factors that restrict the ability of new competitors to enter and begin operating in a given industry. The major source of barriers to enter in to the market are; Economies of scale, Natural factor endowments, exclusive knowledge on factor of production, Product differentiation, Capital requirements, Switching costs, Access to channels of distribution, Government policy, etc.
Market conduct: It is the patterns of behavior that traders follow and how they adjust to changing market conditions. Meijer (1994) said that, “conduct is pattern of behavior which enterprises follow in adopting or adjusting to the market in which they sell or buy”, in other words the strategies of the actors operating in the market. For example, in an environment where there are many buyers and sellers, the market tends to determine the price. If one trader tries to increase his or her price, he or she sells nothing. This means that households buy food commodities and agricultural inputs at prices that equal to the costs of producing the last unit of the commodities (marginal cost). In contrast, if there are only a few sellers of food commodities in a market, these few traders can collude and charge consumers higher prices, up to the level where consumers can afford to buy from nearby market at a lower cost.
Market performance: Market performance refers to the impact of structure and conduct on prices, costs, and volume of output (Pomeroy and Trinidad, 1995). Marketing efficiency is essentially the degree of market performance. It is defined as having the following two major components: (i) the effectiveness with which a marketing service would be performed and (ii) the effect on the costs and the method of performing the service on production and consumption. These are the most important because the satisfaction of the consumer at the lowest possible cost must go hand in hand with maintenance of a high volume of farm output (Ramakumar, 2001). The two approaches to measure marketing performance are: marketing margin and the analysis of market channel efficiency.
Marketing margin: In a commodity subsystem approach, the institutional analysis is based on the identification of the marketing channels. This approach includes the analysis of marketing costs and margins (Mendoza, 1995). A marketing margin can be defined as a difference between the price paid by consumers and that obtained by producers; or as the price of a collection of marketing services that is the outcome of the demand for and supply of such services (Tomek & Robinson, 1990). It measures the share of the final selling price that is captured by a particular agent in the marketing chain (Mendoza, 1995).
Marketing margin is most commonly used to refer to the difference between producer and consumer prices of an equivalent quantity and quality of a commodity. However, it may also describe price differences between other points in the marketing chain, for example between producer and wholesale, wholesale and retail, prices (Scarborough and kydd, 1992). The size of marketing margins is largely dependent upon a combination of; the quality and quantity of marketing services, and the efficiency with which they are undertaken and priced. The quality and quantity of marketing services depends on supply and demand of marketing services and/or the degree of competition in the market place. The costs of service provision depend on both exogenous and endogenous factors and the efficiency are determined by the extent of competition between marketing enterprises at each stage.
The total marketing margin is the difference between what the consumer pays and what the producer/farmer receives for his product. Computing the total gross marketing margin (TGMM) is always related to the final price or the price paid by the end consumer and is expressed in percentage (Mendoza 1995).
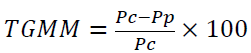
Where, TGMM = Total gross marketing margin, Pc = Consumer price (end buyer price); andPp = Producer price (first seller price)
It is use full to introduce here the idea of “producer participation”, “producer portion” or “producers gross marketing margin” (GMMP) which is the proportion of the price paid by consumer that belongs to the producer. Producer that act as a middle men also receive an additional marketing margin.
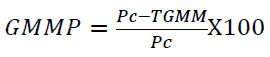
Where; GMMp = the producer's share in consumer price
The net marketing margin (NMM) is the percentage of the final price earned by the intermediaries as their net income after their marketing costs are deducted.
The percentage of net income that can be classified as pure profit(i.e. return on capital), depends on the extension to such factors as the middlemen’s own (working capital) costs.
NMM = (Grossmargin-Marketingcost)/Pricepaidbytheconsumer)*100
Where, NMM = Net marketing margin
Higher NMM or profit of the marketing intermediaries reflects reduced downward and unfair income distribution, which depresses market participation of smallholders.
Results and Discussion
This chapter presents the results and discussions on the core findings of this study. Thus, it is organized in to two sections. The first section provides descriptive analyses on the socio demographic characteristics of sampled households, and the structure, conduct and performance of market. The second section provides descriptive analyses on the constraints and opportunities of Teff production and marketing.
Demographic and Socio-Economic Characteristics of the Sampled Traders
Demographic characteristics of traders are summarized in terms of sex, education level, and average experience in Teff trading Table 2. The survey identified that, all Teff traders are Women. Concerning educational status of Teff traders in the study area, about 76.92 percent of the traders are attended primary education, and 23.08 percent of them attended junior education. Experience plays an important role in improving trading activities and marketing efficiency. The trading experience of sample traders ranges from 2 up to 7 years. The average year of Respondents’ Teff trading experience is 4.92 years.
| Tabe 2 Demographic Characteristics of Sampled Teff Traders | |||||||
| Variables | Frequency N=13 |
Percent N=13 |
|||||
| Sex | Male | -- | -- | ||||
| Female | 13 | 100 | |||||
| Educational level | Primary | 10 | 76.92 | ||||
| Junior | 3 | 23.08 | |||||
| Variable | Obs | Mean | Std. Dev. | Min | Max | ||
| Experience of Traders | 13 | 4.92 | 1.8 | 2 | 7 | ||
Market Structure of Teff
In this sub section, the structure of Teff market is presented and discussed with respect to the types of actors and their functions in the chain, the marketing channel of Teff, the degree of market transparency and the degree of market concentration.
Actors and their Functions in Teff Market Chain Pattern
The analysis of the market chain of Teff in the study area indicated, the involvement of diverse actors who are participated either directly or indirectly in the production to consumption system of the Teff. These include producers, local collectors, retailers, and final consumers of the product. According to (KIT, et al., 2006.) the direct actors are those involved in commercial activities in the chain (input suppliers, producers, traders, consumers). Whereas the indirect actors are those that provide financial or non-financial support services for the actors in the chain such as credit agencies, business service providers, NGOs, cooperatives, researchers and extension agents.
Primary Actors (Direct Actors)
The primary actors in Teff market chain in Adola Rede Woreda identified as Teff producer (farmers), local collectors, retailers, Wholesalers and final consumers of the product.
Producers (farmers): Teff farmers are the primary actors as well as the first stage actors in the chain who perform most of the market chain functions right from farm inputs preparation on their farms or procurement of the inputs from other sources to post harvest handling and marketing. The major market chain functions that Teff farmers perform include ploughing, planting, fertilization, irrigating, weeding, pest/disease controlling, harvesting and post-harvest handling. With respect to marketing, the Teff producers had several options to sell their product, selling directly or selling through broker to collector (rural collector) and Woreda wholesalers. They transport Teff to the nearest markets (village market) by themselves, either carrying by themselves or using donkeys either using pack animals, or animal driven carts, or else Motor bike. Alternatively, they sell to village collector or rural collectors who assemble Teff from large number of farmers. Some of the farmers in the sample also sell their Teff to the consumers in the Woreda market. Village markets are markets which are closest to farmers’ resident, having less marketing facilities such as road, electricity, potable water etc. Farmers sell smaller quantity of Teff on such markets. Whereas Woreda markets are big markets that are found in the Woreda town (Adola and Shakisso) where, most of surplus Teff products are transacted.
Local collectors: Local Collectors/rural assemblers are farmers or part-time traders in the chain who buy small quantity of Teff from farmers in village markets during slack period for the purpose of reselling it to consumers or Woreda wholesalers in either in rural or Woreda market. Generally, they perform physical function (assembling and storing) of Teff for their loyal customers.
Wholesalers: Wholesalers are traders who buy large quantities of goods and resells to retailers than selling directly to the ultimate customers. They are the major actors in the marketing channels. These actors are located in the middle upper part of the market chain and they have somewhat strong financial as well as management-know how in all aspects of the business activity in comparison with other actors. The wholesalers are either licensed or not, and buy Teff from producers and local collectors. In this Woredas markets, the wholesalers sell the Teff either directly or through commission agents to the different buyers in most cases retailers and processors. This means that the wholesalers generally participate in marketing of Teff and perform physical (place utility) and facilitating functions (financing).
Retailers: Retailers as direct market actors of Teff are located at the end of marketing chain, directly servicing the last actors (ultimate consumers) in the production to consumption system.
They perform numerous marketing functions such as buying, storing, selling and other functions related to marketing. Based on their geographic location, retailers are classified as rural and urban retailers.
Rural retailers are market actors in the final link of the market chain and reside on the Woreda town. They buy the Teff from farmers’ directly or through broker in the market. Urban Retailers are retailers that sells commodity to end users (consumers and processors). They reside in the Woreda market and buy the product either from wholesalers or urban assemblers or rural retailers.
Consumers: Consumers are the direct actors in the chain. They are the final stage actors or players in the Teff Market chain in the production to consumption system of Teff that purchases the products from producer, collector, retailers or processors for consumption. This means that they are market actors who purchase either raw Teff or processed Teff for their own consumption directly from the producers and or they have many alternatives as they are the final destination of the products. Therefore, they have many options to purchase Teff from the harvesters, local collectors, wholesalers, retailers and processors.
B. Supporting actors
The supporting actors are those who provide supportive services for the actors in the production to consumption system of Teff. The services provided by them include a financial and licensing service which determines the state of success of market chain actors. Accordingly, in the study area, Adola Rede micro finance was the main supporting actor who plays a central role in the provision of a financial service, again woreda’s Aricultural offices supports the producers especially by providing them input, improved varieties.
Licensing service: Woreda Trade office and Revenue office are the main body responsible for giving license for Teff traders (wholesalers) and collecting revenue through taxation in the Woreda.
Marketing Channels of Teff
A marketing channel is businesses structure of interdependent organizations that originates from the point of product origin to the consumer with the purpose of moving products to their final consumption destination (Kotler and Armstrong, 2003). The analysis of marketing channels is intended to know the alternative routes the product follow from the point of origin to final destination. Seven (7) main alternative channels are identified for Teff marketing. The main marketing channels identified from the point of production to the final consumer through different intermediaries are:
Channel-I: Farmers → Consumers (63Qt kg)
This is a channel in which the farmers sold the Teff they produced directly to consumers. The result in Figure 2 shows that, in this channel about 63 quintals of Teff are transacted/ marketed. This comprises 5.5 percent of the total volume of Teff transacted in the chain. However, this amount is the least one and makes the channel the least in terms of the volume of Teff transacted. As a result the channel stands as the least (7) marketing channels in terms of volume. This could be due to different constraints (e.g. Access to market information, distance from market place, transportation problems, and rural collector’s intervention) that the farmers encounter at the time of marketing their produce.

Figure 2 Market Chain Pattern of Teff Originated from Adola Rede Woreda, Guji Zone
Channel-II: Farmers → Retailers→ Consumers (103Qt)
In this channel, retailers bought Teff directly from farmers and they in turn sell it directly to the consumers. In this case the raw Teff is sold to consumers by the retailers without any processing is carried out. In this channel about 103 Quintals (Figure 2) of Teff are sold. This accounts for 9 percent of the total Teff marketed during the survey period. This channels stands as the 6th important channel in the study area in terms of volume transacted.
Channel-III: Farmers → Retailer → processors →Consumers (141Qt)
In this channel, farmers sell the Teff they produced to the retailer and the retailers sell it without any value addition to the processors; processors resell it by adding some amount of value to consumers. In this channel a total of 141 quintals Teff (Figure 2) are transacted and this account for 12.3 percent of total volume of Teff transacted/marketed in the study area during the survey period. As a result, the channel is the 5th most important channel in terms of volume.
Channel-IV: Farmers → Collectors → Processors →Consumers (173Qt)
This channel is the channel in which farmers sell the Teff they produced to the collectors and they sell without any value addition to the processors; processors resell it by adding some amount of value to consumers. In this channel a total of 173 quintals Teff (Figure 2) are transacted and this account for 15.08 percent of total volume of Teff transacted/marketed in the study area during the survey period. As a result, the channel is the 4th most important channel in terms of volume.
Channel-V: Farmers → Wholesalers → Processors →Consumers (203Qt)
This is the channel in which wholesalers bought Teff directly from farmers and they in turn sell it directly to the processors. In this case, the raw Teff is sold to consumers by the processors after value addition processing is carried out. In this channel about 203 quintals (Figure 1) of Teff are sold. This accounts for 17.7 percent of the total Teff marketed during the survey period. This channels stands as the 3rd important channel in the study area in terms of volume transacted.
Channel-VI: Farmers → Wholesalers → Retailers →Consumers (211Qt)
This is the channel in which wholesalers bought Teff directly from farmers and they in turn sell it directly to the retailers. In this case, the raw Teff is sold to consumers by both the Retailer and Wholesalers without value addition process. In this channel about 211 quintals (Figure 2) of Teff are sold. This accounts for 18.8 percent of the total Teff marketed during the survey period. This channels stands as the 2nd important channel in the study area in terms of volume transacted.
Channel-VII: Farmers → Collectors → Wholesalers →Processors→ Consumers (253Qt)
This channel is the channel in which farmers sell the Teff they produced to the collectors and the collectors sell it without any value addition to the wholesalers and wholesalers again resell it to the processors without value addition process. In turn, the processors sell it by adding some amount of value to consumers. In this channel a total of 253 quintals Teff (Figure 2) are transacted and this account for 22.06 percent of total volume of Teff transacted/marketed in the study area during the survey period. As a result, the channel is the 1st most important channel in terms of volume.
The comparison made among the channels with respect to the volume of Teff that is transacted through each channel shows that, the Farmers-Collectors - Wholesalers-Processors-Consumers channel is the channel in which the largest volume (i.e. 253qt) of Teff is transacted. This comprises about 22.06 percent of the total volume of Teff transacted.
This is followed by Farmers-Wholesalers-Retailers-Consumers channel in which a total volume of 211quintals of Teff are transacted. This amounts to about 18.8 percent of the total amount marketed (Figure 2). In contrast, the farmer/producer - consumer channel is the one that accounts for only 5.5 percent of the total volume of Teff transacted in the chain. As a result the channel stands as the least (7th) marketing channels in terms of volume.
Structure-Conduct and Performance (S-C-P) of Teff Market
In this section, the findings from the analysis of Teff market structure, market conduct and market performance is presented and discussed. The section is comprised of three subsections. In the first sub section the nature of Teff marketing structure is presented. The second sub section is about the market conduct of Teff. The last sub section deals with the performance of Teff markets.
Structure of the Teff market
The structure of the Teff marketing system is evaluated in terms of the degree of market concentration, barrier to entry (licensing procedure, lack of capital and know how, and policy barriers), and the degree of transparency (Pender., et al 2004). In this study, the structure of Teff marketing is characterized, using the following indicators: market concentration and entry conditions (licensing procedure, administrative problem and lack of capital).
Measure of Market Concentration Ratio
Market Concentration Ratio(C), as noted by Shughart (1990) is the numerical index most widely used by industrial organizations for measuring the size distribution of firms in a market.
Due to the limited number of traders in their respective locality, Woreda level market concentration ratio is used to analyze the type of markets prevailed in the Woreda. Concentration ratio is calculated by taking partial annual volume of Teff purchased by 13 local traders in 2017/18. The CR4 measures of market concentration ratio showed that, the top four or 20 percent of the traders are controlled 33.33 percent of the Teff market in 2017/18. Such kind of market structure showed that, weak oligopoly market structures this is almost nearest to the competitive market structure in Table 3.
| Table 3 Teff Trader’s Concentration Ratio in Adola Rede Woreda | ||||||
| Frequency(A) | Cumulative freq.(B) |
percent of traders (C) D=A/13 | Cumulative percent traders (D) |
Total Quantity purchased (E) | percent share of purchase (Si=E/33525) | percent cumulative purchase  |
| 1 | 1 | 7.69 | 7.69 | 4009 | 11.96 | 11.96 23.16 34.14 |
| 1 | 2 | 7.69 | 15.38 | 3755 | 11.20 | |
| 1 | 3 | 7.69 | 23.07 | 3683 | 10.98 | |
| 1 | 4 | 7.69 | 30.76 | 3323 | 9.91 | 44.05 52.01 |
| 1 | 5 | 7.69 | 38.45 | 2669 | 7.96 | |
| 1 | 6 | 7.69 | 46.14 | 2399 | 7.7 | 59.11 65.95 72.35 |
| 1 | 7 | 7.69 | 53.83 | 2292 | 6.84 | |
| 1 | 8 | 7.69 | 61.52 | 2146 | 6.40 | |
| 1 | 9 | 7.69 | 69.21 | 2128 | 6.35 | 78.7 |
| 1 | 10 | 7.69 | 76.9 | 2122 | 6.33 | 85.03 |
| 1 | 11 | 7.69 | 84.59 | 1712 | 5.11 | 90.14 |
| 1 | 12 | 7.69 | 92.28 | 1681 | 5.01 | 95.15 |
| 1 | 13 | 7.69 | 100 | 1606 | 4.79 | 100 |
| 13 | 100 | 33525 | 100 | |||
Barriers to entry into the Teff market: The barriers to entry into the market reflect the competitive relationships between existing traders and potential entrants
If the barriers to entry are low, new traders can easily enter into Teff markets and compete with established traders. However, with the presence of very high barriers to entry, established firms are difficult to stay longer in business in Table 4.
| Table 4 Entry Barrier in Teff Marketing | ||
| Source of barriers to entry | Frequency | Percent |
| Lack of capital | 8 | 61.53 |
| Information collusion | 5 | 38.46 |
| Total | 13 | 100 |
Among the total trader respondents, 87.6 percent of them respond that, there is no entry barrier to the market where as 12.4 percent of them explained that there is entry barrier in Teff marketing especially in wholesaling, local Trading business due to shortage of capital (61.53), and information asymmetry(38.46).
Shortage of capital: The survey result indicated that among various barriers to entry into the Teff business, shortage of capital being the first. Since capital is the main source of any business, to enter in the market, more capital is needed. But in the study area shortage of capital is the important barriers to entry into the marketing of Teff.
Conduct of Teff market
Market conduct refers to the patterns of behaviour that firms follow in adopting or adjusting to the markets in which they sell or buy. In other words, market conduct focuses on traders’ behaviour with respect to various aspects of trading strategies such as buying, selling, transport, storage, information and financial strategy (Bain, 1968).
Purchasing and Pricing Strategy
The survey result indicated that, about 69.2 percent of traders attract their suppliers by showing their loyalty in providing fair and proper weighing and the rest 30.8 percent of trader attract their suppliers by giving better or reasonable price, but they attracted their buyers by giving quality product, fair scaling weighing and better price. Traders are taxed mainly based on the volume of the product they handled during the year and most of traders developed the experience to record the volume of the product transacted (bought, sold and price) in Table 5.
| Tabe 5 Trader’s Attraction Method of Suppliers and Buyers | ||
| Attracting method | Frequency | Percent |
| giving better price | 4 | 30.8 |
| by visiting | -- | -- |
| fair scaling weighing | 9 | 69.2 |
| Total | 13 | 100 |
The survey result revealed that, about 76.3 percent of purchasing price set by the market or demand and supply, and the rest 23.7 percent purchasing price is decided by the negotiation between traders and sellers of Teff. These figures indicated that, sampled traders considered supply and demand and nearby market prices information to determine the purchase and selling price of the market but sampled farmers being price takers. And also, all the surveyed traders sold their product on cash. None of them sold their product through combination of cash, advanced payment and credit.
The source of the working capital for majority of sampled traders is loan they offered from micro finance institution, but source of working capital for minority of them is their own. this shows that, in the study area, micro finance institution played a great role in equipping traders with finance that initiate them to create job not only for themselves but to the others also.
Performance of Teff market
Teff market performance is analyzed based on the level of marketing margins by taking into consideration associated marketing costs for key market participants. Hence, on the consideration of 2017/18 production year, costs and purchase prices of the main channel actors, margin at farmers, village assemblers, urban assemblers, road side traders and retailers level were conducted.
Cost and Profitability analysis of Teff producer
This section of the study focused on activities related to producing Teff at farm level. Average costs and sales prices of the producers are used. This provides an insight about the performance of Teff market in Table 6.
| Table 6 Analysis of Costs and Profitability of Teff Production in 2017/18 | ||||
| Cost items Variable cost (VC) | Unit | Quantity | Unit price | % from total cost |
| Price of Teff seed | Birr/Qt | 0.5qt | 1050 | 10.85 |
| Land clearing and preparation | Man-day/ha | 6 | 600 | 6.20 |
| Drafting power(Oxen) | Timad/day | 4 | 1000 | 10.34 |
| Ploughing & sowing | Man-day/ha | 9 | 900 | 9.31 |
| Chemicals, fertilizer | Birr/qt | 0.5qt | 650 | 6.72 |
| Weeding | Man-day/ha | 2 | 350 | 3.62 |
| Harvesting | Man-day/ha | 23 | 2300 | 23.78 |
| Threshing | Man-day/ha | 17 | 1700 | 17.58 |
| Transport from farm to home | Birr/qt | 9qt | 500 | 5.17 |
| Marketing cost | ||||
| Broker’s fee | Qt | --- | -- | -- |
| Loading and unloading | Man-day/Qt | 2 | 220 | 2.27 |
| Transportation to market | Birr/Qt | 9 | 330 | 3.41 |
| Total VC | Birr/ha | 9600 | 99.28 | |
| Fixed Cost (FC) | ||||
| Land tax | Birr/ha | 1ha | 70 | 0.72 |
| TFC | Birr/ha | 70 | 0.72 | |
| Total cost/ha(TVC+TFC) | Birr/ha | 9670 | 100 | |
| Total Revenue/ha(PQ) | Birr | 24300 | -- | |
| Gross profit/ha(TR-TC) | Birr | 14630 | -- | |
Average productivity of Teff and farm gate price for sampled farmer in the study area are 9 quintals per hectare and 2700 Birr per quintal. As Table 7 shows, in production year of 2017/18, production of 9 quintals of Teff per hectare of land costs Birr 24,300, and a farmer earns a revenue of Birr 14,630. Variable costs that used to produce nine (9) quintals volume of Teff take about 9600Birr/ha which covers 99.28 percent of the total cost. Particularly, the ploughing & sowing, threshing, and land clearing and preparation process are very tedious work for most sampled farmers because it is labour- intensive.
| Table 7 Analysis of Costs and Profitability of Teff for Traders, In 2018/19 | ||||
| Items | Village assembler |
Urban assembler | Wholesaler | Retailer |
| Purchasing price | 2550Br/qt | 2700 | 2850 | 2700 |
| Cost of loading-unloading | 30 | 20 | 20 | 15 |
| Commission to Brokers | --- | 4 | 5 | -- |
| Cost of transportation | 30 | 50 | 40 | -- |
| Income Tax | -- | 15 | 15 | -- |
| Other costs | -- | 50 | 50 | 30 |
| Total cost/quintal | 2610 | 2839 | 2980 | 2745 |
| Selling price | 2700 | 2850 | 3000 | 3000 |
| Gross profit | 90 | 11 | 20 | 255 |
Cost and Profitability Analysis of Teff traders
Analysis of cost and profitability of the different traders of Teff namely rural assemblers, urban assembler, wholesaler, retailers are analyzed across the markets. During analysis of cost and profitability, the average purchased price of a quintal of the Teff and the different average transaction costs associated with the marketing process of a single quintal until it reached the next actor are assessed.
Based on the result, average transaction costs incurred across different Teff actors varies. Accordingly, the total costs incurred by village assemblers, urban assemblers, wholesalers, and retailers of Teff are Birr 60, 139, 130, and 45 respectively. For village collectors/ assemblers, even though buying and selling of the Teff had taken place on their village market, they are exposed to different costs associated with marketing process, because, to sell the purchased Teff to another actors, they incurred many costs for example, for transportation, loading and unloading.
On the other hand, the data indicated that, the amounts of transaction costs per quintal of Teff incurred by retailers are Birr 45 which is the lowest cost of all traders. This was due to lower costs related to transportation, loading and unloading. Retailers usually purchased Teff from different actors in the middle of the market, road side and other places which are nearby to the market. Due to this, they are not exposed to different costs like transportation, and other costs. As a result, retailers exercised lowest average transaction costs per quintal than any other traders.
Additionally, the data indicated that, the amount of transaction costs per quintal of Teff incurred by Urban assemblers are Birr 139, which is the highest cost of all traders. This was to higher costs related to transportation, loading and unloading, and other costs. Urban assemblers usually purchase a volume of Teff, which they are not finishing selling in few days.
With respect to the profitability of Teff, the overall average profitability in different traders indicates that at every stage of transaction, Teff trading business is profitable. Table 7 revealed that, retailers are traders who obtained the highest net profit per quintal that is due to the fact that, they were not exposed to different costs. Urban assemblers obtained least net profit per quintal due to high costs incurred in the marketing process in Table 7.
Marketing Margins
Marketing margin is a measure of the percentage of price paid by the consumer that is maintained by each agent in the marketing chain. These include the total gross marketing margin, producer’s gross marketing margin, and net marketing margin. However, it may also describe price differences between other points in the marketing chain, for example, between producer and wholesale, or wholesale and retail prices. Therefore, for this section of the study, marketing margin is analyzed by considering the average sales prices of different participants in the Teff market channel and considering Margin and cost calculation for top four key Teff marketing channels in Table 8.
| Table 8 Marketing Margin for Different Marketing Agents | |||||||
| Marketing channel Participants |
Purchase Price (Birr/qt) | Total Marketing cost | Sale Price | Gross marketing margin | % share of Margin |
Gross profit margin (Birr/qt) | % share of profit |
| Farmers | 0.0 | 40 | 2100 | 450 | 40 | 153.5 | 40 |
| Vill.assembler | 2550 | 65 | 2400 | 23 | 2.04 | 23.08 | 2.04 |
| Ur. assembler | 2700 | 45 | 2550 | 135 | 12 | 79.92 | 12 |
| Wholesaler | 2850 | 25 | 2700 | 101 | 8.96 | 34.28 | 8.96 |
| Retailer | 2700 | 10 | 2700 | 417 | 37 | 101.76 | 37 |
| Vertical Sum. | 11,100 | 185 | 12,300 | 1112.71 | 100 | 392.54 | 100 |
Major Constraints and Opportunities in Teff production and Marketing
In order to increase production and productivity, the constraints and opportunities of the study area has to be studied, identified, prioritized, recorded and appropriate solution should be searched. For sake of clear understanding, problems/constraints are divided into production and marketing problems.
Production Constraints
Technical problems: the agronomic practices to cultivate Teff have little changed by farmers in the study area. Accordingly, overall Teff production in the study area largely relies on the traditional methods. For example, broadcasting which is a traditional method that slows improvement in Teff productivity commonly used for Teff sowing in the study area. It is observed that, the production and productivity of Teff is low, this is mainly because of lack of modern technology practices among farmers in the study area. Modern technology of Teff production namely: technique of seedlings, harvesting, spacing, post-harvest handling and storage, row planting, standard fertilizer application and other important technologies that increases production and productivity of Teff are not practiced, due to this they are unable to supply more volume of Teff yield to the market (Table 8).
Social preference for Teff color: White(Magna), and kuncho Teff are the preferred type which is the most expensive form of Teff, but less these types Teff cultivated by farmers in the study area. As a result, most of farmers in the Woreda produced other Teff colors rather than the preferred or improved Teff varities like that of Magna and Kuncho. So this lack of preferences for those improved Teff varities by the farmers is another production constraint that prevails in the study area (Table 8).
Poor knowledge of good agricultural practices: Lack of awareness on enhanced Teff farming practices, Lack of skills on range of planting methods (land preparation, row planting); preventing the emergence of increased pest and disease risks and post-harvest handling to reduce losses are the the major production challenges prevails in the study area.
Erratic rainfall patterns: The erratic rainfall distributions affected the production of Teff and other crops tremendously, because sometimes rain in the study area rains not at regular time. That means all or 100 percent the respondents revealed that, sometimes there is an unexpected rainfall prevailed in the study area. Rainfall starts late and ends early, other time’s rain stops at the booting stage, where water is important decrease production and productivity of Teff. Heavy rain is also affect Teff production, because Teff is intolerant to excessive rainfall.
Road and transport: Table 9 below depicted that, 85.12 percent of farmers or sampled respondents faces the problem of poor road and there is a traditional transporting means such as donkeys in the study area. Even though there is an improvement on road access in the country, still there is a problem of road and transportation in the Woreda. Due to this, transporting inputs from sources to farm gate and outputs from farm to selling sites are very difficult. There is an also motor bike in the Woredas which charges high transportation cost that hurts farmers’ income of selling of outputs and buying of inputs while transporting agricultural inputs and outputs.
| Table 9 Production and Marketing Problems of Farmers | |||
| Problems | N(freq,) 121 | Percent | Rank |
| market information | 83 | 68.6 | 8th |
| High marketing costs | 100 | 82.6 | 6th |
| market orientation | 112 | 92.6 | 4th |
| Market research and information | 118 | 97.5 | 3rd |
| Labour-intensive nature of Teff production | 121 | 100 | 1st |
| Extension support | 92 | 76.03 | 7th |
| Road and transport | 103 | 85.12 | 5th |
| Erratic rainfall patterns | 121 | 100 | 2nd |
| Poor knowledge of good agricultural practices | 63 | 52.07 | 9th |
| Social preference for Teff color | 57 | 47.1 | 11th |
| Technical problems | 59 | 48.8 | 10th |
Extension support problems: as indicated below in the table 9, 76.03 percent of farmers in the study area are not get extension training on agricultural crop production because, there is no sufficient numbers and well trained Development Agents deployed in each Kebeles to give effective extension service to the farmers. New agricultural technologies is influenced by the efficiency of communication between the Development (change) Agents(DAs) and the farmers at grass roots level. For this fact, farmers of the study area lacked the important means of transferring new agricultural technologies and improving their capacity for innovations.
Labour-intensive nature of Teff production: as indicated in table below, 100 percent sampled respondents faces the difficulty in Teff production like land preparation, cultivating, row planting, and harvesting because of labour- intensive nature of the Teff production.
Marketing constraints: In addition to production constraints, Teff marketing is constrained by different factors. The most prominent ones are the following:
Market research and information: With respect to access to market/price information there is no system in place for systematically collecting, analyzing and disseminating information relevant to the needs of different actors. As a result, there are no organized market information system to support farmers in the study area. However, 97.5 percent of farmers obtained information on the local market from their neighbors and other farmers. And also, there are inadequate availability of market research resulted in uninformed planting and marketing decisions. Hence policy makers should target to solve these problems in developing policies and programs.
Poor market orientation of farmers: Table 9 depicted that, 92.6 percent of Farmers used to sell their crop immediately after harvest without seeking to make the best possible profit (at the best time or the best price) this is due to liquidity constraints.
High marketing costs: as indicated in the table below, 82.6 percent of the sampled resondents revealed that, poor conditions of roads and the lack of access to means of transportation, is costly and time-consuming for them to market their produce in the study area.
Dynamic Marketing Price and Lack of Up-to-Date Market Information for Producers
This is an important marketing constraint. It is observed that, 68.6 percent farmers or sampled respondents in the study area lack a reasonable price and up to date market information for their produces which particularly affects supply products Table 9.
Opportunities for Teff production and marketing
The opportunities of the study area are; availability of good weather condition, fertile land, motivated and hardworking farmers, the presence of suitable soil and agro-ecology for Teff production and location of the Woreda for agricultural marketing’s (very near to two Woredas’ markets). Moreover, it is observed that, there is fast-growing demand for Teff by low and middle income consumers.
Availability of good weather condition; the climatic condition of the woreda is characterized as Woina Dega climatic Zone which very important for growing of Teff. The area receives a bimodal rainfall where the high rains are between August to October and the small rains are from February to April. However, during the main rains, all crops grown in the area are planted including maize, Teff, wheat, sorghum.
The other opportunity the area possess is the presence of suitable soil and agro-ecology for Teff production; The soils of the area are believed to be a relatively fertile and during good rains farmers can harvest good yield even without fertilizer application.
Government suitable agricultural policies designed to support farmers at the grass -root level is the other opportunity dimension. Administrative decentralization and the deployment of development agents at each PAs based on their academic background are also important policy dimensions. Furthermore, provision of infrastructure facilities like roads, telecommunication is very important.
Conclusions and Recommendations
The study is conducted in Adola Rede Woreda located about 485 km in South of Addis Ababa. The area is known for its surplus production of agricultural commodities. However, analysis of market chain of agricultural crops in general and Teff in particular are not well understood. The study attempted to investigate marketing chain of Teff in the area. Selection of this crop is mainly based on its relative importance and marketability.
The study is conducted in order to identify major problems and opportunity of Teff production and marketing, and analyze structure-conduct-performance of the market in the area. The production and marketing constraints that encounter farmers are poor knowledge of good agricultural practices, erratic rainfall patterns, poor road and transport, extension support problems, labor-intensive nature of Teff production, high marketing costs, marketing price and lack of up to date market information for producers, and lack of market research and information.
Traders of Teff in the Woreda have the problem of capital shortage, information flow, and absence of storage. Accordingly, the opportunities of the study area are availability of good weather condition, availability of fertile land, availability of motivated and hardworking farmers, and the presence of suitable soil and agro-ecology for Teff production.
Following Teff, the production of Maize, wheat and Barley are the main source of cash for farmers in the study area with the average land allocated; 0.78, 1.07, 0.67, and 0.34 hectares respectively. The minimum and maximum land allocated by sampled respondents to the production of Teff was 0.5 and 1.5 hectares respectively.
There were no organized market information systems to support farmers in the study area. About 43.9 percent of the sampled farmers had access to market information from different sources whereas 56.1 percent are not access to market information.
About 20.14 percent producers obtained market information from the nearby market, none of the Teff producers obtained price information from the central market before selling the produce. The sampled respondents revealed that, the major source of market information in the study area are Other Teff farmers.
The comparison made among the channels with respect to the volume of Teff that is transacted through each channel shows that the farmers-collectors-wholesalers-processors-consumers channel is the channel in which the largest volume (i.e. 253qt) of Teff was transacted. This comprises about 22.06 percent of the total volume of Teff transacted. This is followed by farmers-wholesalers-retailers-consumers channel in which a total volume of 211quintals of Teff is transacted. This amounts to about 18.8 percent of the total amount marketed. In contrast, the farmer/producer-consumer channel is the one that accounts for only 5.5 percent of the total volume of Teff transacted in the chain.
Recommendation and Policy Implication
In accordance with the analysis made, problems faced in production and marketing of Teff, generally, the following points are recommended to develop sustainable marketing system of teff that is locally adaptable and acceptable to increase the competitiveness of smallholder farmers:
1. Most small farmers sell their product as soon as they produce in low price which make them to loss their profit. Farmer should be trained on how to assemble their product in order to help them to sell their products when market price gets high.
2. Building strong chain relationship is part of the strategy of high value markets.
3. The government should prepare appropriate strategy that reduce the activity of middle men and increase the traceability system between the producers and other market actors.
4. Farmers who live far from the market without their own means of transportation are unlikely to sell to private traders and cooperative, suggesting the importance of adequate road facilities and transportation services in providing options for marketing agricultural produce. Since most private traders have transport constraint, they are likely to operate in areas in which the road facilities is good and in the area where transport services are available. Hence, households tend to minimize transaction costs by selling to rural collector and other informal traders who typically offer door-to-door services at unfair prices. Therefore, this study recommends that an improvement of existing road facilities would reduce the time spent to reach the market and lower transportation costs would enhance farmers to sell their produce that results higher returns.
5. There are inadequate availability of market research resulted in uninformed planting and marketing decisions. Hence policy makers should target to solve these problems in developing policies and programs.
References
- Adola Rede Agricultural office (2019). Annual Report 23p
- Andersen, A. & Winge, T., (2012). The Access and Benefit-Sharing Agreement on Tef Genetic Resources. Fridt of Nansen Institute.
- FAO. (2011). http://faostat.fao.org/site/567/default.aspx, August2010. Rome:
- Fufa, et al., (2011). Strengthening the Tef Value Chain in Ethiopia, Ethiopian Agricultural Transformation Agency, November.
- Jema Haji (2008). Economic Efficiency and Marketing Performance of Vegetable Production in the Eastern and Central Parts of Ethiopia. Doctoral dissertation, Sweden University of Agricultural Science, Sweden.
- Hyejin Lee (2018). Teff, A Rising Global Crop: Current Status of Teff Production and Value Chain. Institute for International Development Cooperation, Konkuk University, Seoul, South Korea. P 187
- Ivanovich Vavilov & Nikolai, (1992). Origin and Geography of Cultivated Plants. Articles and Lectures of Vavilov 1924–1940, first collected and published in book form in Russian in 1987 (Cambridge: Cambridge University Press).
- Kizito A. (2008). Famine early warning systems Network Market Guidance No.2. Structure, Conduct and Performance and Food Security.
- Kohl R. & Uhl, J. (1985). Marketing of Agricultural Product, 5th Edition, Collier Macmillan, USA. 624p. 2002, Marketing of Agricultural Product, 9th Edition, Prentice-Hall of India PLC, New Delh.
- Lawrence, D.S. (2003). Towards a Strategy for Support to Make Agricultural Markets Work Better for the Poor: The Grain Marketing System in Ethiopia. Oxford Policy Management, 6 St Aldates Courtyard, 38 St Aldates,Oxford OX1 1 BN,UK
- Meijer, P.W.M. (1994). The function of maize market in Benin. Bert Broundjin, Benin. pp.1132.
- Mendoza, G. (1995). A primer on marketing channels and margins. P257-275.In G.J. Scott (ends). Prices, Products, and people; Analyzing Agricultural markets in Developing Countries. Lynne Rienner Publishers, Boulder, London.
- Mohammed Urgessa (2011). Market Chain Analysis of Teff and Wheat Production in Halaba Special Woreda, Southern Ethiopia
- Pomeroy, R.S. & Trinidad A.C. (1995). Industrial Organization and market analysis: P217238. In: G.J. Scott (eds). Prices, products, and people: Analyzing Agricultural Markets in Developing Countries. Lynner Reinner publishers, Boulder, London.
- Ramakumar, R. (2001). Costs and Margins in coconut marketing: Some evidence from Kerala, Indian J. Agric Economics 56 (4) 668-680.
- Tadele, et al., (2016). Factors Affecting Teff And Wheat Market Supply In Dendi Woreda, West Shoa Zone, Ethiopia, International Journal of Current Advanced Research pp 811-816, (Available Online) at http://journalijcar.org
- Tomek, W.G., & Robinson, K.L. (1990). Agricultural Product Prices, 2nd-ed. Ithaca, N.Y. USA: Cornell University Press.
- Wolday Amha (1990). Food grain marketing development in Ethiopia after reform. A case study of Alaba Siraro. The PhD Dissertation Presented to VerlagKoster University. Berlin 1994, 293p.
- Yadeta Bekele & Temesgen Hirko (2018). Determinants of Teff Market Channel Choice in Abay Chomen Woreda, Western Ethiopia: Journal of Agricultural Economics and Rural Development Vol. 4(1), pp. 381-388, March, 2018.
- Yamane Taro (1967). Statistics, an Introductory Analysis: 2nd ed. New York: Harper and Row.N/1, 1967.