Research Article: 2024 Vol: 28 Issue: 3
Sustainable Development Goals and Indicators: A Comparative Analysis between India and SAARC Countries
Ashish Kumar Biswas, Narsee Monjee Institute of Management Studies, Hyderabad
Citation Information: Kumar Biswas, A. (2024). Sustainable development goals and indicators: a comparative analysis between india and saarc countries. Academy of Marketing Studies Journal, 28(3), 1-10.
Abstract
Attainment of Sustainable Development Goals (SDGs), as proposed by United Nations, is major concern in almost all the countries worldwide. There are certain indicators of SDGs. The paper tries to examine the status of attainment of SDG indicators across eight South Asian nations including India. Using World Bank data, the present study has conducted a comparative analysis between India and SAARC countries based on six dimensions, focusing on different sector of SDGs. The study has used both the static and dynamic analysis as tool to analyse the data. To conduct the static analysis, the 2020 was considered for the reference year. On the other hand, a trend analysis was performed to conduct the dynamic analysis based on data of years 2011-2020 for all the six indicators. The findings indicate that in terms of all the indicators Maldives has attained the best outcome compared to all other South Asian nations. India has also performed well in terms of all the indicators, especially environmental and health-related indicators. However, there is more scope for improvement for which awareness generation may play a key role. Both Bangladesh and Nepal require focused attention for attainment of SDGs.
Keywords
Sustainable Development Goals, Indicators, India, SAARC, Trend.
Introduction
The most debated issue of twenty-first century is attainment of Sustainable Development Goals (SDGs) as proposed by (Leboeuf, 2018). There are 16 SDGs, mentioned by UN, in various aspects such as health, poverty, income, economic policy, governance, environment etc (UN, 2018). All SDGs are interrelated which implies it is a a collaborative strategy that improves regional economic integration in one of the world's least linked economic areas can pay tremendous returns in terms of improving people's quality of life (Cheema, 2022). Most of the South Asian Countries face major challenges in achieving SDGS, especially for hunger, good health, clean energy, sanitation, infrastructure, finance etc. This is because SAARC nations do not have the budgetary headroom to support emergency response and investment-led recovery programmes that are in line with the SDGs. (Cheema, 2022). South Asia includes Afghanistan, Bangladesh, Bhutan, India, Maldives, Nepal, Pakistan, and Sri Lanka. It should be noted that South Asia is endowed with demographic resources, and around one-fourth of the world's population are in South Asia. The region is considered the most densely populated region in the world, with 1,830 million people living in an area of 5,220,587 square kilometres (Sarkar e al., 2013). South Asia is characterised by a low level of development and a considerable population living in poverty, hence the SDGs have already garnered special attention from the governments and the area (Rasu et al., 2021). In the framework of the SDGs, low governmental capability, as well as limited budgetary commitment, may prove to be barriers, jointly compromising much-needed resources for South Asia to meet the SDGs objectives.
With the region's macroeconomic development slowing, future success will increasingly rely on increased social investment and improved public goods delivery systems (Asadullah and Sen, 2020). SDGs are critical to execute in all South Asian nations since they share more or less comparable socioeconomic features and face substantially more or less similar development difficulties (Sarkar et al., 2022). Thus, in order to address South Asia's socioeconomic and environmental concerns, SDG implementation is critical in order to solve problems and ensure the well-being of people and nations alike. However, it is found that to foster human and economic development, India has shown a strong commitment to the Sustainable Development Goals (SDG) Agenda. The government has aligned its development priorities with the SDG framework. India recently underwent two Voluntary National Reviews (Government of India, NITI Aayog, 2017 and 2020), and carried out a third round of stocktaking of progress in meeting the SDGs (Aayog, 2021) providing SDG metrics, including at the state level. Hence the present study attempts to make a comparative analysis between India and South-Asian countries in attainment of SDGs. It is required to mention that selected indicators were only used for comparison due to data insufficiency.
Objective of the Study
The study has the following objectives:
1. To examine the performance of selected indicators of SDGs in India over a period of ten years.
2. To compare the performance of selected indicators of SDGs between India and South-Asian countries.
3. To analyse the trend of selected indicators of SDGs in South-Asian countries along with India over a period of 10 years.
Data and Methodology
The data was collected from the World Bank website. In the backdrop of the objectives formed, the data on eight SAARC countries were collected and tabulated for analysis. SAARC stands for South- Asian Association for Regional Cooperation-Afghanistan, Bangladesh, Bhutan, India, Maldives, Nepal, Pakistan, and Sri Lanka are the countries which are part of SAARC. World Bank provides data on wide range of variables for all the countries of world related to SDG indicators. But, in order to extract symmetric data on all the SAARC countries, selected variables were chosen for this study as data regarding some indicators of SDGs were not available for a few SAARC countries. The paper has a two-part methodology to analyse date- graphical analysis for the year 2020 (static analysis) and trend line analysis over the years 2011-2020 (dynamic analysis). The description of indicators and their sector-wise classification is shown in Table 1.
| Table 1 Indicators of SDGS Considered | ||
| Indicators | Description | Sector |
| Access to clean fuel and technologies for cooking | % of population having access to clean fuel and technologies for cooking (kerosene excluded) | Environment |
| Access to electricity (urban) | % of population having access to electricity in urban areas | Environment |
| Access to electricity (rural) | % of population having access to electricity in urban areas in rural areas | Environment |
| Adolescent fertility rate | Rate of birth per 1000 adolescent girls (age : 15-19) | Health and Fertility |
| Agricultural, forestry, fishing value added per worker | Value added (labour productivity) in each of these sectors measured at a constant price of US$2015. | Economic policy and condition |
| Adjusted net savings | Net national savings plus education expenditure and minus energy depletion, mineral depletion, net forest depletion, and carbon dioxide- measured as % of Gross National Income | Financial |
Results
Performance of SDG Indicators in 2020: India and SAARC
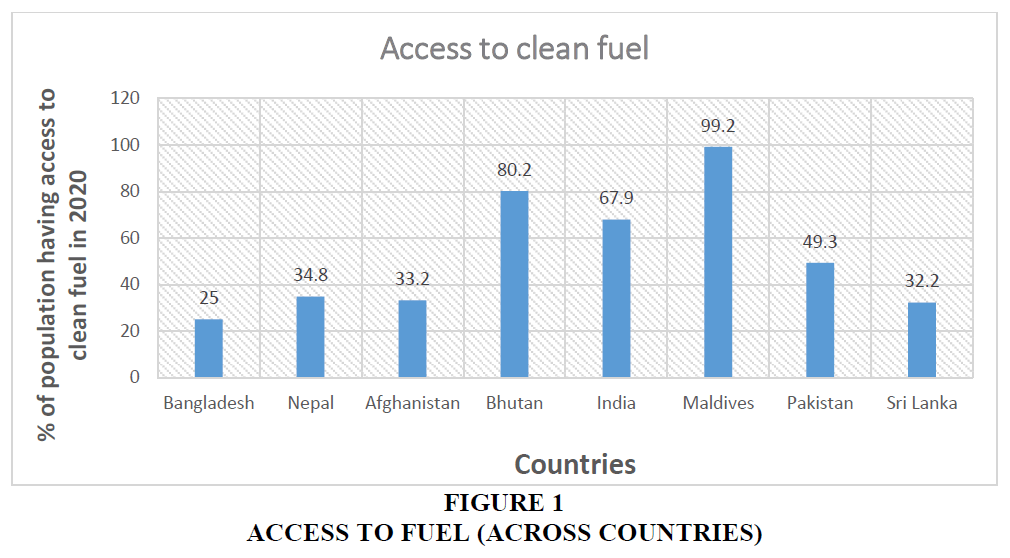
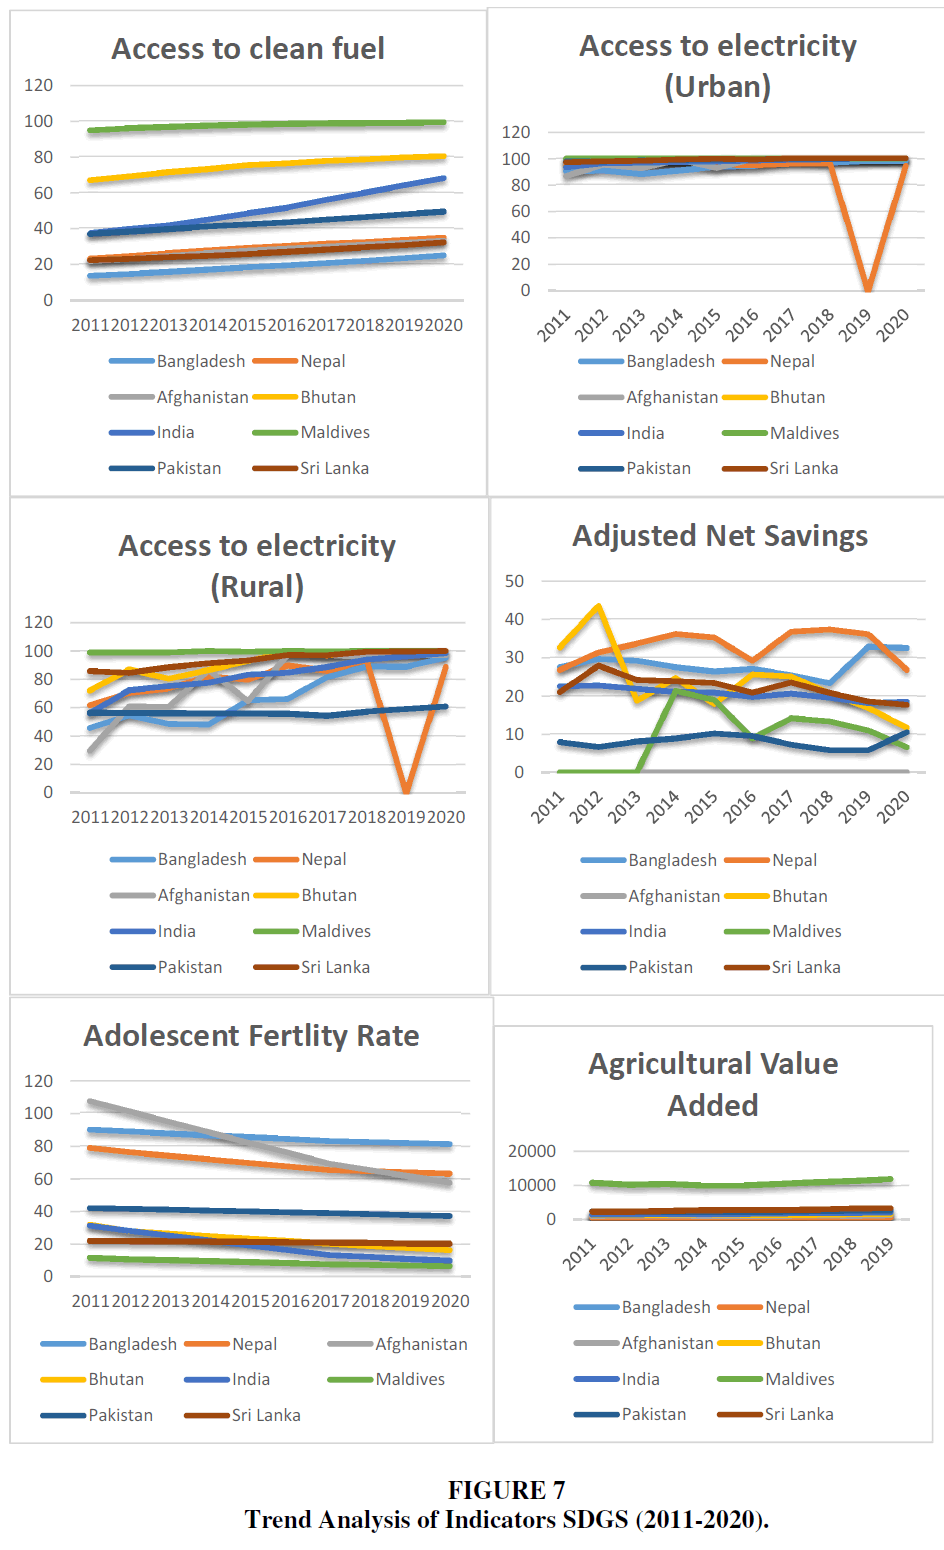
Access to clean fuel and energy: Figures 1-4 shows that almost more than three-fourth of Indians has access to clean fuel and technology. Among all the SAARC countries, Maldives have almost 100% attainment of clean fuel and energy. Bhutan has also a quite satisfactory level of access to fuel and technology (80%) followed by India, Pakistan (50%), Nepal (35%), Afghanistan (33%) and Srilanka (32%). Bangladesh has still a long way to achieve the bare minimum level of access to fuel and technology as attainment of access to fuel is only 25% in case of Bangladesh.
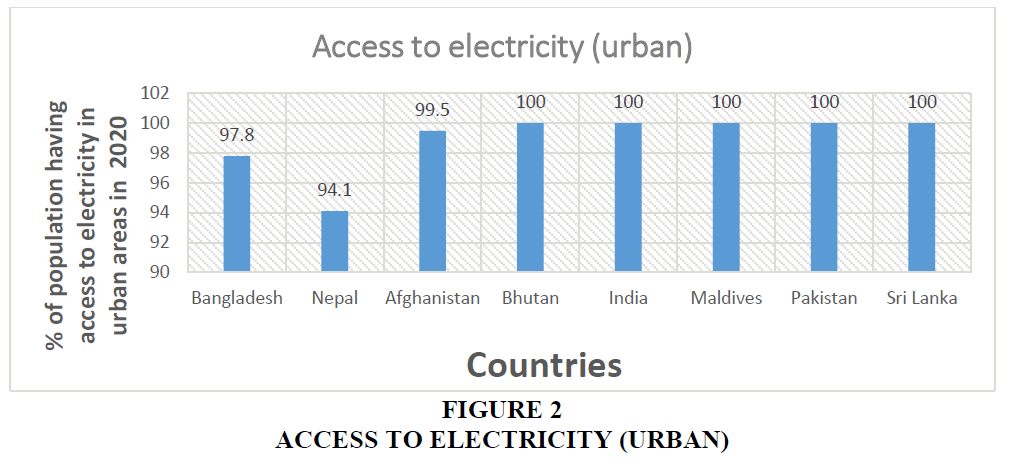
Access to Electricity (Urban)
The success of modern economy is based on the access and consumption of electricity by its population. The population of five out of eight SAARC countries have 100% access to electricity in urban areas. There is no doubt that SDG goals in terms of attainment of energy consumption have been well meet, especially in urban areas of SAARC countries. It is quite satisfactory that 100% of urban population have access to electricity in India. However, both Nepal (94%) and Bangladesh (98%) have yet to achieve 100% access to electricity in urban areas.
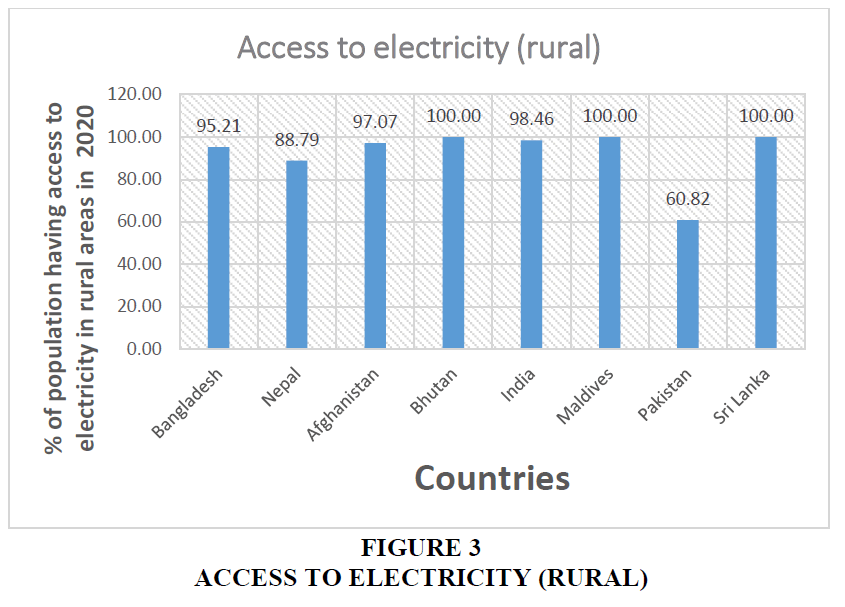
Access to Electricity (Rural)
Comparing to urban areas, access to electricity in rural areas is low in most of the countries, except Srilanka, Bhutan and Maldives where the access to electricity is 100%, even in the urban areas. India has an attainment of 98% of this SDG indicator in rural areas, placing it at the fourth position among all the SAARCC nations. Pakistan has the lowest attainment (60.82%) among all the nations concerned, implying that the rural economy in Pakistan requires attention while achieving SDG goals. The percentage of population having access to electricity in rural areas is 95% and 89% in Bangladesh and Nepal, respectively.
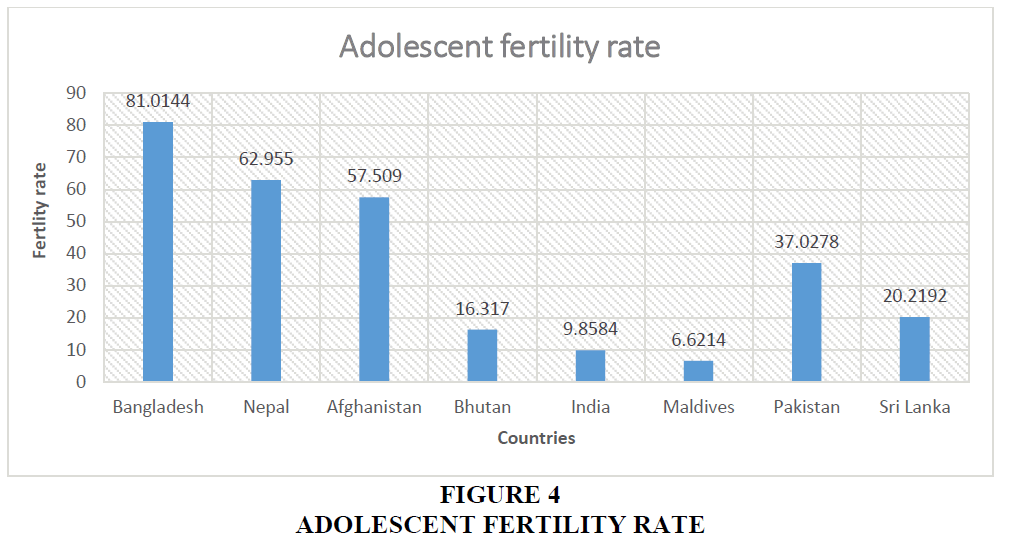
Adolescent Fertility Rate
Figure 4 depicts the adolescent fertility rate across SAARC countries. The more the fertility rate, the less attainment of SDG Goals in terms of achieving better health outcomes. Because higher adolescent fertility actually put the health of young girls at risk. Bangladesh (81%) has highest adolescent fertility rate followed by Nepal (63%) and Afghanistan (58%). It is quite clear that Bangladesh has alarming situation in terms of adolescent fertility rate. India has a quite low level of adolescent fertility rate (10%), but still a way more to go to attain the SDG. Maldives has the lowest level of adolescent fertility among all the SAARC nations (7%). Although Bhutan has a quite higher access to fuel and energy consumption, the adolescent fertility rate is quite higher in Bhutan (16%).
Agricultural Value Added
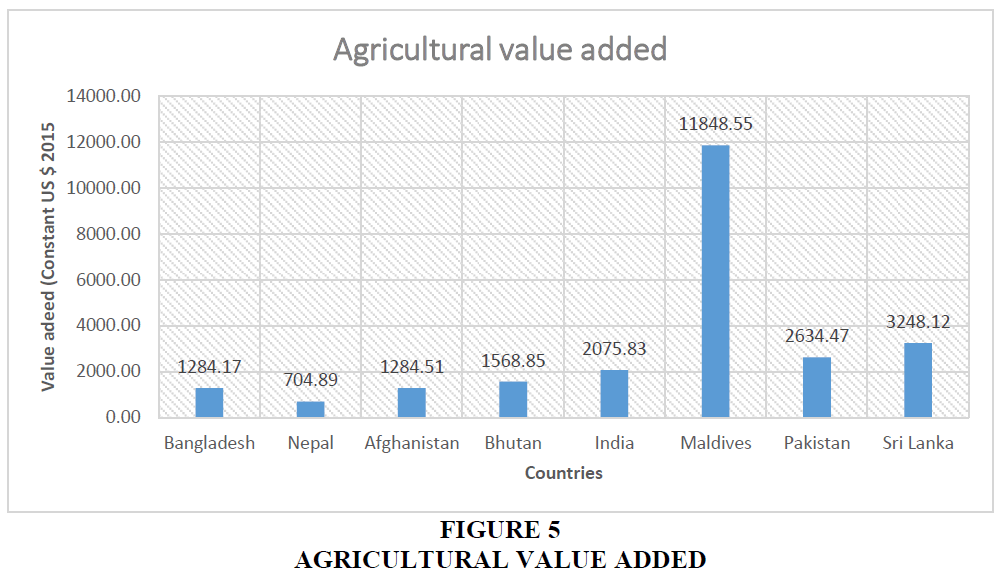
Agricultural value added denotes the value added per workers which measures labour productivity. It is measured at a constant price level (US$ 2015) to compare across the countries. Figure 5 shows the agricultural value added per worker in agriculture, forestry and fishing. Maldives has the highest agricultural value added followed by Srilanka, Pakistan and India. India ranked fourth (US $ 2075) in terms of primary sector value added, quite below Sri lanka and Pakistan. So labour productivity, as measured by value generated by a worker is US$ 2075 in India. On the other hand, Nepal has the lowest value added followed by Afghanistan, Bangladesh and Bhutan.
Adjusted Net Savings
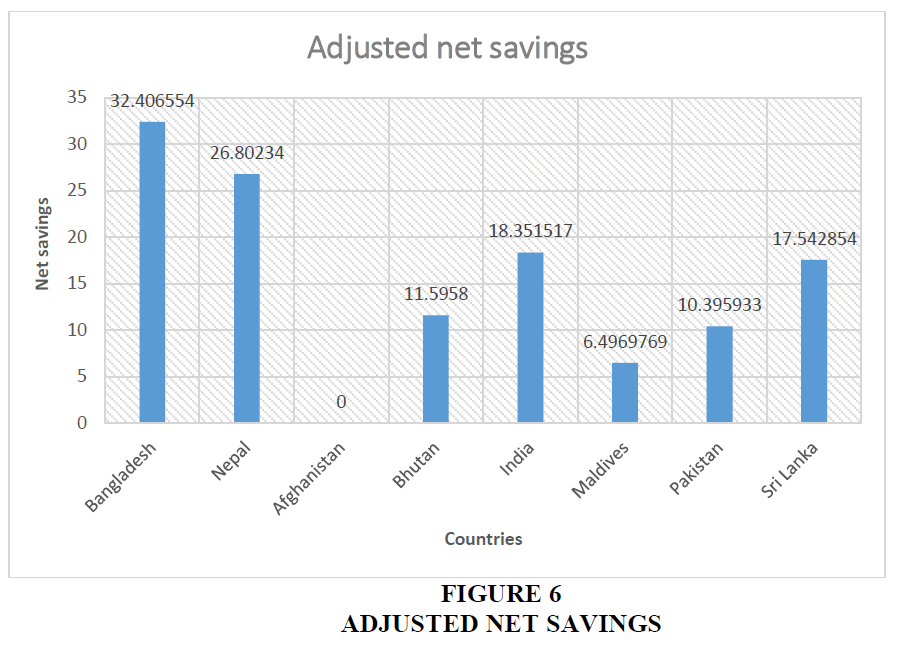
Adjusted Net Savings is defined as the net national savings of the nation including education expenditure. It is represented as percentage of Gross National Income. It should be noted that the data for Afghanistan of adjusted net savings were not available. Comparing all the nations except Afghanistan, it is found that Bangladesh has the highest Net Savings (32.40%) followed by Nepal (26.80%). Higher net national savings indicates inefficient utilization of national resources. There is more scope for both Bangladesh and Nepal to efficiently use their resources. India has a moderate level of adjusted net savings (18.35). Maldives has a net national savings of 6.4% which indicates a better level of resources utilized. Srilanka, Pakistan and Bhutan have a moderate level of adjusted national savings.
SDG Indicators and their Trends (2011-2020): India and SAARC
As a part dynamic analysis, a trend analysis has been carried out for the years 2011-2020 for all the indicators, across all the countries. As depicted by Figures 6 & 7, in case of percentage of population having access to fuel and technology, almost all the nations have shown an upward trend throughout the years including India. India’s growth in this case has taken a sharp upward turn after 2014-15. Maldives has a stagnant trend over the years in this case. In case of percentage of population having access to electricity in urban areas, almost all the countries have a stagnant growth rate over the years as almost all the nations have achieved 100% access to electricity in their urban counterpart in 2011 onwards. In case of Nepal, data were not available for 2019; hence the graph shows a sudden drop during 2019. However, in case of rural areas, the same indicator is showing a complex trend for the countries. In case of India, in 2011 the percentage was 60% whereas it increased to almost 100% in 2020. The same is true for Bangladesh as well. Both these countries have shown a sharp upward trend in case of electricity consumption in rural areas over the years. Both Maldives and Srilanka has depicted a stagnant trend over the years. However, Afghanistan starting from 20% in 2011 has finally achieved almost a 100% access to rural electricity over the years, which is quite praiseworthy. Adolescent fertility rate has shown a declining trend for almost all the countries, implyimg an improvement in attainment of SDGs over the years. The decline is quite sharp for Afghanistan over the years. In case of India also, it has depicted a sharp decline, even if not as much as Afghanistan, over the years from nearly 40% to 10%. However, surprisingly, for Pakistan it is showing a stagnant trend which implies, over the years, adolescent fertility rate is same for the nation. The figure for adjusted net savings again depicts a complex trend across the countries. Surprisingly the trend for India’s net savings is stagnant over the years whereas almost for all the SAARC nations the trend is a mixed one – i.e. depicting a cyclical trend (data were not available for Maldives for initial years – 2011-2023). Finally, in case of growth of the agricultural value added, the trend is stagnant or slight upward for all the countries including India. However, the agricultural value added is quite high for Maldives from the beginning towards the end of the reference period – 2011-2020, compared to the other nations.
Discussion and Conclusion
There is no doubt that among all the SAARC nations, Maldives is found to be the best nation in case of SDG attainment. Low population, adequate resources, geographical location, higher literacy rate and flourishing tourism leading to economic growth may be some reasons of the success of Maldives in case of SDG attainment. India has also performed quite well which is in line with the existing studies of SDGs. Introduction of various schemes in India related to health, income, environment, sanitation (Make in India, Ayushman Bharat, Jan Dhan Yojona, Swachh Bharat Mission) has paved the way for India to attain SDGs. Other low income countries such as Bhutan, Srilanka have also performed well in terms of SDG attainment. However, still a long way to go and hence proper coordination between policy recommendation and implementation is required to achieve SDGs by 2030. Reducing income inequality, ensuring faster economic growth, attaining environmental sustainability, developing human capital, taking holistic measures and actions for programme implementation, setting up of strong regulatory institution and ensuring peace and harmony may ensure attaining SDGs for all the South-Asian Countries. SDGs are regarded as critical for achieving sustainable development, which may be accomplished through improving the performance of many metrics.
South Asia, as a rising region in terms of economic and population, has the potential to become an emergent focal point for Asian and global growth. However, depending on their SDG accomplishments and problems, South Asian nations have certain parallels and variances. Except for Bhutan, Maldives, and Sri Lanka, the key problems of these nations include poverty and low per capita income, significant corruption, and unsustainable cities. Furthermore, all nations suffer increased income disparity, with Bangladesh, India, Sri Lanka, Bhutan, and the Maldives most affected. In terms of environmental sustainability indices, only Bhutan and Maldives rank relatively well, whereas other nations have major issues that keep them from achieving sustainability.
Many indicators of certain SDGs have been found to be static or deteriorating. Hence, it is critical to address the SDGs and to implement target-oriented policies in order to accomplish the SDGs by 2030.
References
Aayog, N.I.T.I. (2021). SDG India Index & Dashboard 2020-21. Summary, New Delhi: Niti Aayog, 1-34.
Asadullah, M. N., Savoia, A., & Sen, K. (2020). Will South Asia achieve the sustainable development goals by 2030? Learning from the MDGs experience. Social Indicators Research, 152, 165-189.
Cheema, A. R. (2022). South Asian countries’ progress on Sustainable Development Goals. South Asia@ LSE.
García-Escribano, M., Mogues, M. T., Moszoro, M., & Soto, M. (2021). The Spending Challenge of Achieving the SDGs in South Asia: Lessons from India. International Monetary Fund.
Government of India, NITI Aayog (2017). “Voluntary National Review Report on the Implementation of Sustainable Development Goals,” New Delhi, India.
Government of India, NITI Aayog. (2020). “India VNR 2020: Decade of Action Taking SDGs from Global to Local,“ New Delhi, India.
Leboeuf, C. (2018). Global indicator framework for the Sustainable Development Goals.
Rasul, G., Nepal, A. K., Hussain, A., Maharjan, A., Joshi, S., Lama, A., Gurung, P., Ahmad, F., Mishra, A., & Sharma, E. (2021). Socio-economic implications of COVID-19 pandemic in South Asia: emerging risks and growing challenges. Frontiers in sociology, 6, 629693.
Indexed at, Google Scholar, Cross Ref
Sarkar, M. S. K., Takemoto, A., Sadeka, S., Islam, M. M., & Al-Amin, A. Q. (2022). Achieving Sustainable Development Goals (SDGs) among the South Asian Countries: Progress and Challenges. International Journal of Regional Development, 9(2), 42-61.
Sarkar, M.S.K., Sadeka, S., Feardous, A.A., & Ahmed, S. (2013). Human Development Performance of Bangladesh: South Asian Perspective. Journal of Applied Sciences Research, 9(4), 2475-2484.
Received: 03-Oct-2023, Manuscript No. AMSJ-23-14061; Editor assigned: 04-Oct-2023, PreQC No. AMSJ-23-14061(PQ); Reviewed: 29-Jan-2023, QC No. AMSJ-23-14061; Revised: 29-Feb-2024, Manuscript No. AMSJ-23-14061(R); Published: 22-Mar-2024
