Research Article: 2022 Vol: 23 Issue: 6S
The Determinants of Lifelong Learning in Europe
Alberto Costantiello, LUM University Giuseppe Degennaro
Lucio Laureti, LUM University Giuseppe Degennaro
Angelo Leogrande, LUM University Giuseppe Degennaro
Citation Information: Costantiello, A., Laureti, L., & Leogrande, A. (2022). The determinants of lifelong learning in europe. Journal of Economics and Economic Education Research, 23(S6), 1-15.
Abstract
The article affords the question of lifelong learning in Europe using data from the European Innovation Scoreboard-EIS in the period 2010-2019 for 36 countries. The econometric analysis is realized using WLS, Dynamic Panel, Pooled OLS, Panel Data with Fixed Effects and Random Effects. The results show that lifelong learning is, among other variables, positively associated to “Human Resources” and “Government procurement of advanced technology products” and is negatively associated, among others, to “Average annual GDP growth” and “Innovation Index”. A clusterization is realized using the k-Means algorithm with a confrontation between the Elbow Method and the Silhouette Coefficient. Subsequently, a Network Analysis was applied with the distance of Manhattan. The results show the presence of 4 complex and 2 simplified network structures. Finally, a comparison was made among eight machine learning algorithms for the prediction of the value of lifelong learning. The results show that the linear regression is the best predictor algorithm and that the level of lifelong learning is expected to growth on average by 1.12%.
Keywords
Innovation, and Invention: Processes and Incentives; Management of Technological Innovation and R&D; Diffusion Processes; Open Innovation.
JEL Classification
O30; O31, O32; O33; O36
Introduction
Marin & Prioteasa (2020) highlights the important role that new technologies play with reference to the formation of human capital in school and extra-school paths with a positive impact on lifelong learning. The authors particularly analyze the case of Romania et al. (2018) analyze the ways in which education systems can actively participate in sustainable economic development determined at the regional level. In this sense the authors recognize a predominant role to lifelong learning (Shokirovich, 2020). Refer to the role of lifelong learning as a factor capable of facilitating the application of new technologies in production systems for the creation of the innovative economy Ruzinska (2018) address the issue of lifelong learning for the elderly especially in the field of economic issues and communication. The authors address the issue of multimedia communication and the use of new technologies as lifelong learning tools for the elderly Farrow (2018) consider the role of MOOC platforms and online training in creating new skills and knowledge in the human capital employed in companies. The authors believe that the use of MOOCs can help support future levels of automation and digitization. The lifelong learning policies of the European Union can find a significant operational ally in MOOCs Kirova et al. (2018) highlight the role of universities in creating a system based on Lifelong Learning. Levchenko et al. (2018) consider the role of lifelong learning as a necessary element for the application of industry 4.0 and for the growth of competitiveness at the country level. The authors believe that the growth of lifelong learning is an essential element to ensure that competitiveness and productivity at the country level grow using new information technologies Caves (2018) refer to the role of lifelong learning within the dynamics of change management achieved through company leadership. The authors believe that change leaders in companies are capable of gender changes in the corporate organizational structure using employee learning models of the lifelong learning type Appendix I.
Maitra & Guo (2019) refer to the use of lifelong learning as a tool for decolonization and the fight against racism. The authors believe that through lifelong learning it is possible to fight cultural Eurocentrism. The institutionalization of Lifelong Learning paths can be useful to reduce racism and marginalization of immigrants especially in universities and workplaces Boeren (2017) address the issue of the application of lifelong learning in an interdisciplinary context. The authors believe that the dialogue between various social sciences and the choices of policy makers may be necessary to implement Lifelong Learning more efficiently with positive results in qualitative and quantitative terms Appendix –II.
Park & Kim (2020) address the issue of the relationship between technological development and lifelong learning. The authors believe that the acquisition of new competences, knowledge, and skills in the field of industry 4.0 can only take place through a worker approach that is oriented towards lifelong learning. Lifelong learning is also necessary to carry out the retraining of workers.
These reasons lead the authors to ask for a radical rethinking of educational and training models Ho (2021) refer to the presence of a relationship between employee engagement and lifelong learning in the workplace. However, the authors wonder if the quality of working life and employee involvement truly generate a positive impact in terms of lifelong learning. The results show that increasing the quality of life and employee involvement have a positive impact in terms of lifelong learning Eynon & Young (2021)propose the use of artificial intelligence as a tool to promote the spread of lifelong learning Dosunmu & Adeyemo (2018) refer to the possibility of lifelong learning to create the conditions for creating a political culture that can avoid discrimination against women in the workplace. The authors made the case of South Africa Appendix –III.
The results show that women can improve their working conditions through lifelong learning only if they also have the support of an organizational culture favorable to gender parity Valiente et al. (2020) refer to the use of lifelong learning as a tool to fight youth unemployment in Europe. In particular, the European Union, to combat youth unemployment produced by the financial crisis of 2007-2008, has focused on lifelong learning programs to ensure that young people are once again employable.
However, the authors are critical that lifelong learning can truly be a tool capable of increasing the employability of young people in Europeans, especially in the absence of a clear modification of the structural arrangements of local labor markets Fajcikova & Urbancova (2017) analyze the role of lifelong learning in the context of policies aimed at strengthening human capital as a tool for increasing competitiveness at the country level, making the case of the Czech Republic. Permanent learning is also very useful for the elderly Formosa (2019). In this sense, the universities of the third age are essential tools to improve the learning of the elderly. The results show that seniors who engage in lifelong learning have above-average levels of socio-economic status.
From our point of view, Lifelong Learning is considered in the light of technological innovation. Company training in new technologies through an orientation towards the digitization of workers in the company (Leogrande et al., 2022a). Furthermore, Lifelong Learning can also have a role in boosting high tech exports of knowledge intensive services (Leogrande et al., 2022b). Countries that develop Lifelong Learning policies can also have positive impacts in terms of producing more intellectual assets as the population is more oriented towards the knowledge economy (Costantiello et al., 2021a).
Furthermore, it is necessary that the investment in promotion policies for Lifelong Learning are also associated with programs for the development of internet networks (Leogrande et al., 2021a). In fact, Lifelong Learning acquires greater value in the presence of an orientation towards digitization. The spread of Lifelong Learning can also provoke a greater investment of companies in research and development activities (Costantiello et al., 2021b). In fact, the development of the knowledge economy, the presence of qualified human capital can also mobilize private investments. The spread of lifelong learning can also increase the innovativeness of small and medium-sized enterprises which can count on a social and cultural environment naturally oriented towards the creation of intangible assets (Costantiello et al., 2021c).
The presence of human capital positively oriented to the creation of intangible assets can also push investors to support more investments in research and development (Costantiello et al., 2021d). Furthermore, it is necessary to consider that the presence of economic policies aimed at promoting Lifelong Learning makes it possible to strengthen that innovation-friendly environment that allows companies to invest in research and development with significant effects in terms of productivity and competitiveness at the country level (Leogrande et al., 2021b).
Companies may be more interested in investing in the creation of new products and services in the presence of a lifelong learning orientation of workers and consumers. In fact, in this case, companies can count on a workforce capable of renewing their skills and on consumers capable of absorbing high degrees of product innovativeness. The presence of lifelong learning-oriented workers can also create the conditions for the foundation of new start-ups that attract the financial investment of venture capitalists and business angels. Furthermore, the contribution of universities and research institutions in creating lifelong learning can also increase the attractiveness of national research systems Appendix –IV.
Methodological Approach
Econometric Model
We have estimated the determinants of Lifelong Learning for 36 European Countries in the period 2010-2019 in the following formula: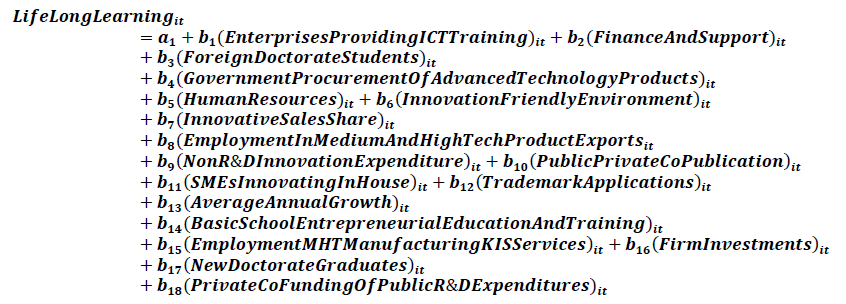
Where i=36 ad t= [2010;2019]
The econometric estimations show that the level of lifelong learning is positively associated with:
Enterprises providing ict training: Is the number of companies that have provided IT training to their employees out of the total number of companies. There is therefore a positive relationship between the value of lifelong learning and the ability of companies to train their employees in the IT sector. This positive relationship can be understood considering that the investment that companies make in corporate human capital can be understood as a form of lifelong learning. In this case it is the company that takes care of the training of people and therefore makes up for the shortcomings of public institutions while pursuing its own profit objectives. The orientation towards lifelong learning is necessary to ensure that a real knowledge economy is determined which constitutes the environment in which the economy of technological innovation takes shape.
Finance and support: It is a variable made up of a set of variables or R&D Expenditure in the public sector and Venture Capital Investment. The variable calculates the financial system's ability to support the system of technological innovation and research and development. There is a positive relationship between the value of lifelong learning and the value of financial support for technological innovation and research and development. this positive relationship can be understood considering that a large part of the investment in research and development and technological innovation is in fact an investment in human capital and in training and therefore in lifelong learning.
Foreign doctorate students: Is the number of PhD students from abroad. This variable refers to student mobility. Student mobility is an effective tool for disseminating knowledge. The presence of foreign PhD students guarantees the research system new human capital that can be used for technological innovation. There is a positive relationship between the value of PhD students from abroad and lifelong learning. In fact, the training activity of doctoral students which is part of tertiary education constitutes an element of lifelong learning.
Government procurement of advanced technology products: It is an indicator that considers the extent to which public procurement decisions positively impact technological innovation. There is a positive relationship between the ability of public bodies to express a demand for technological innovation and lifelong learning. In fact, it is much more likely that a society characterized by a more widespread participation in lifelong learning also has a more positive general orientation towards technological innovation. In this context, public bodies may also be able to express a demand for highly innovative technological services.
Human resources: is an indicator that considers three different sub-variables: "New Doctorate Graduates", "Population Aged 25-34 with Completed Tertiary Education", "Population Aged 25-64 Involved in Education and Training". There is therefore a positive relationship between the value of Lifelong Learning and the value of Human Resources. This positive relationship can be better understood considering that Lifelong Learning is a variable that precisely considers the formation of human capital.
The two variables therefore capture the same socio-economic phenomenon.
Innovation-friendly environment: It is a variable consisting of the sum of two sub-variables namely “Broadband Penetration” and Opportunity Driven Entrepreneurship. There is therefore a positive relationship between the value of Lifelong Learning and the value of the Innovation Friendly Environment. That is, the fact that countries have invested in the internet and have an entrepreneurial system capable of seizing market opportunities tends to be positively associated with the presence of a lifelong learning orientation of the population.
Employment in Medium and high-tech product exports: it is a variable that considers employment in a set of sectors that are export-oriented such as manufacturing, high technology, pharmaceuticals, computers and information technology, aeronautics, electrical equipment. There is a positive relationship between employment in medium and high-tech companies that export and the spread of Lifelong Learning in the country. This positive relationship is essentially since the medium and high technology companies that export generally have a high-level human capital which can therefore be positively connected to the presence of lifelong learning at the country level.
Non-R&D innovation expenditure: It is a variable that considers the value of the sum spent on innovation in companies with the exclusion of expenses not in research and development. This variable therefore considers only and exclusively the value of the innovation achieved using R&D expenses as a percentage of total turnover. For example, the investment in technological innovation achieved using the acquisition of various machinery and equipment. There is therefore a positive relationship between technological innovation and investment in Lifelong Learning. This relationship means that the countries in which there is more lifelong learning are also the countries in which companies invest more, even apart from investments in research and development.
Public-private co-publications: It is an indicator of the number of public-private publications that shows the collaboration between researchers operating in the market and researchers operating for the public. Such cooperation between the public and private sectors in research results in scientific publications. There is a positive relationship between the value of Lifelong Learning and the value of public-private publications. This relationship indicates that in countries where there is greater investment in high-level training and greater capacity for cooperation between private companies and public institutions.
SMEs innovating in-house: It is a variable that refers to the number of internal innovative companies that are defined as companies that have introduced product and process innovations in collaboration with other companies and organizations. This indicator refers to SMEs or those companies that have several employees between 10 and 249. There is therefore a positive relationship between the value of innovative companies and investment in Lifelong Learning. In fact, the countries in which the most investment is made in terms of Lifelong Learning are also the most innovative countries in terms of product and process innovations.
Trademark applications: Is a variable that considers the number of trademark applications filed with the European Union Intellectual Property Office. This variable therefore refers to the ability of countries to innovate through brands. Brands are an important tool of technological innovation, especially in services. This trademark allows companies to use the tools in all Member States of the European Union. The trademark identifies the origin of goods and services, guarantees the quality of the product towards the consumer, constitutes a recognizable element in the forms of communication and advertising. There is therefore a positive relationship between the value of Lifelong Learning and the value of investing in brands at country level. That is, the countries that invest the most in the formation of human capital are also those that have the best results in terms of trademark applications. This relationship allows us to grasp the significance of technological innovation and the economy of knowledge as a widespread dimension that brings benefits to businesses, individuals, and institutions.
The Econometric Estimations Show that the Level of Lifelong Learning is Negatively Associated with
Average annual GDP growth: It is an indicator that considers the growth of gross domestic product on average. There is a negative relationship between the value of the trend in gross domestic product on average and the value of Lifelong Learning. This relationship can be better understood considering that the gross domestic product tends to grow more for the countries that are more backward and therefore also have a lower endowment of Lifelong Learning. For example, that the countries of Eastern Europe have grown very pure without having a high level of Lifelong Learning. It follows that in this case the trend of GDP does not allow us to analyze the dynamics inherent in human capital and in the formation of the knowledge economy.
Basic-school entrepreneurial education and training: Measures the extent to which training in the creation or management of SMEs is incorporated into the education and training system at primary and secondary school level. There is therefore a negative relationship between this value and the value of Lifelong Learning. It is possible to understand this negative relationship considering that while entrepreneurship education in schools obviously concerns students of school age, the approach to Lifelong Learning instead concerns a population having a higher age. It is therefore not certain that a country that invests in student entrepreneurship is also able to guarantee a long-term approach to training in the life of its citizens.
Employment MHT manufacturing KIS services: Employment in technology and knowledge-intensive sectors nationwide. There is a negative relationship between the value of employment in knowledge-intensive technology sectors at national level and the value of Lifelong Learning. This relationship appears to be counterfactual. However, it must be considered that there are countries that produce products of high manufacturing value even without investing in lifelong learning. These are, for example, the countries in which it has relocated to escape international competition.
Firm investments: These are investments that companies make in research and development, in the development of innovations and in strengthening the efforts of companies in terms of Information Communication Technology. There is a negative relationship between these types of investments and the value of Lifelong Learning. This negative relationship can be better understood considering that while the investment of companies in research and technological innovation concerns only their employees, on the contrary the investment in Lifelong Learning concerns society. And in this sense, obviously, the fact that companies invest in the training of their employees may not have the necessary impact to steer the entire society towards the knowledge economy through Lifelong Learning.
Innovation index: Is an indicator of a country's overall ability to innovate. There is a negative relationship between Lifelong Learning and the value of the Innovation Index. This negative relationship means that Lifelong Learning does not have a significant impact in determining the innovation conditions at the country level. It follows that Lifelong Learning is a condition of context which, however, could not generate a direct impact in terms of the technological innovativeness of companies, products and services.
New doctorate graduates: It is an indicator who considers people with a second -level university formation in age between 25 and 34 years. The data show the presence of a negative relationship between the value of new graduates and the value of lifelong learning. That is, not necessarily the countries operating with Lifelong Learning policies are also able to generate a growth in the number of second level graduates of university matrix. Obviously, although lifelong learning is certainly relevant at a social, economic, and political level, it is also necessary to underline that university formal study paths are certainly more relevant.
Private co-funding of public R&D expenditures: It is a variable that considers the research and development costs that companies finance in the public. This indicator therefore measures the amount of public-private cooperation. This report expresses a specific orientation of research and development that having been financed by companies is increasingly close to the needs of industry. There is a negative relationship between the value of lifelong learning and the value of private investment in the research carried out by public bodies. This negative relationship can be better understood considering that the fact that a company finishes research to a public body has nothing to do with the fact that the entire population of that nation is oriented towards the economy of knowledge with continuous training programs aimed at adults Figure 1.

Figure 1: Results Of The Econometric Estimate Made For The Analysis Of The Value Of Lifelong Learning.
Tertiary education: Is the percentage of people with one age between 25 and 34 years having a tertiary education. It is an advanced general skills indicator. Variable does not refer only to the STEM disciplines or technical-scientific fields. There is a negative relationship between the number of people who have a Tertiary Education type qualification and the Edel Lifelong Learning valor in Europe. This negative relationship stands out that the presence of research doctorates and high professionalism is not necessarily accompanied by the presence of programs for lifelong learning at national level.
Clusterization with K-Means: Silhouette VS. Elbow Method
We realize a clusterization with the k-Means algorithm. Using the silhouette coefficient two different Clusters have been identified. The Clusters are indicated below or:
Cluster 1: Poland, Turkey, Lithuania, Serbia, Hungary, Latvia, Cyprus, Greece, Slovakia, Croatia, Montenegro, Northern Macedonia, Italy, Germany, Bulgaria, Belgium, Romania, Czech Republic, Ireland, Portugal, Spain, Malta, Slovenia
Cluster 2: Denmark, Finland, Iceland, Sweden, Switzerland, Norway, France, Netherlands, Luxembourg, United Kingdom, Austria, Estonia figure 2.

Figure 2:Optimization Of The Number Of Clusters With The Elbow Method And Indication Of The Composition Of The Clusters.
By calculating the value of the median of individual Clusters it is possible to verify that the value of the clusterization for the 1-C1 cluster is equal to an amount of 55.56 units while the median value of the 2-C2 cluster is equal to an amount of 210.56. It follows that the 2-C2 Cluster countries have a higher lifelong learning value than the 1-C1 cluster countries of an amount of 378%. However, comparing the clusterization with the silhouette coefficient with the Elbow method, it turns out that while in the case of the silhouette coefficient two Clusters are indicated in the case of the Elbow method are identified four Clusters. Therefore, by applying the Elbow method, the following Clusters are identified or:
Cluster 1: Montenegro, Croatia, Slovakia, Northern Macedonia, Bulgaria, Greece, Romania, Serbia, Poland, Turkey, Lithuania;
Cluster 2: Luxembourg, France, Netherlands, United Kingdom, Norway, Austria, Estonia;
Cluster 3: Sweden, Switzerland, Denmark, Finland, Iceland
Cluster 4: Portugal, Spain, Czech Republic, Belgium, Malta, Ireland, Germany, Italy, Cyprus, Slovenia, Hungary, Latvia.
To identify the system of clusters, the median value of the Clusters for the value of the lifelong learning is used. It appears that the median value of the 3-C3 cluster is equal to an amount of 306.67, the median value of the 2-C2 cluster is equal to an amount of 204.44 units, the median value of the 4-C4 cluster It is equal to an amount of 81.11, while the value of the 1-C1 cluster is equal to 30.00. It therefore follows that the Clusters system consists of C3 = 306.67> C2 = 204.44> C4 = 81.11> C1 = 30.00.
From a strictly geographical point of view, it is possible to verify a dominance of the areas of northern Europe, especially Scandinavian, compared to southern Europe and Eastern Europe. It should be considered that the significant difference in terms of lifelong learning is at the same time causes and consequence of the economic gap in terms of GDP between north and southern Europe. In fact, in the context of the economy of knowledge it is necessary to invest in the lifelong learning to increase the competitive capacity in the production of high-quality intangibles figure 3.

Figure 3:Geographical Representation Of The Cluster Structure Optimized With The Elbow Method.
Network Analysis with the Use of Manhattan Distance Method
A Network Analysis is presented below using Manhattan's distance. Four structures are identified with complex network structures and two structures with simplified networks or consisting of the biunivocal relationship between two nations Figure 4.

Figure 4:Network Structures Detected Through The Use Of Manhattan's Distance.
There is a complex network structure consisting of Bulgaria, Montenegro, Croatia, Northern Macedonia, Slovakia, Greece. In particular, the following connections exist:
Greece has a connection with Slovakia on a link value of 0.15
Slovakia has a connection with Greece equal to an amount of 0.15, with Croatia for a value equal to0.14, with Northern Macedonia with a value of 0.2, with Montenegro for an equal value at 0.11.
Northern Macedonia has a connection with Croatia for a value of 0.12, with Slovakia for a value of 0.2, with Montenegro for a value of 0.2.
Montenegro has a connection with North Macedonia equal to a value of 0.2, with Slovakia for a value of 0.11 and with Croatia equal to 0.1.
Croatia has a connection with North Macedonia equal to an amount of 0.12, with Montenegro equal to an amount of 0.1 and with Slovakia for a value equal to 0.14.
There is a Complex Network Structure Between Germany, Belgium and Italy. Particularly
Germany has a connection with Belgium for a value equal to 0.097 and with Italy for a value equal to0,21
Belgium has a connection with Germany equal to an amount of 0.97
Italy has a connection with Germany equal to an amount of 0.21.
There Is a Complex Network Structure Between Spain, Portugal, and Malta. Particularly
Portugal has a connection with Malta for a value of 0.19 and with Spain for a value of 0.073
Spain has a connection with Portugal for a value of 0.073 units and with Italy for a value of 0.16 units
Italy has a connection with Spain for a value of 0.16 units and with Portugal with a value of 0.19 units.
There is a Complex Network Structure Between Turkey, Poland and Lithuania as Indicated Below
Poland has a connection with Turkey for a value of 0.049 and with Lithuania for a value of 0.11
Lithuania has a connection with Poland equal to an amount of 0.11 units and with Turkey for a value of 0.078
Turkey has a connection with Poland for a value of 0.49 and with Lithuania with a value of 0.078.
There are also Two Structures with Simplified Networks Relationships Between two Nations. These Reports are Indicated Below
Hungary has a connection with Cyprus for a value of 0.12
The Netherlands has a relationship with France for a value of 0.08.
Machine Learning and Prediction
A prediction was later created through a comparison between eight different Machine Learning algorithms. The algorithms were compared in terms of the maximization of the R-Squared and minimization of statistical errors. The learning rate was placed at 70%. The analysis showed the presence of the following system between the algorithms Figure 5.

Figure 5:Statistical Results Of Machine Learning Algorithms .
Linear Regression with a payoff equal to 4
Tree ensemble with a payoff equal to 9
PNN-Probabilistic neural Network with a payoff equal to 12
Polynomial Regression with a payoff value of 15
Simple Regression Tree with a payoff value of 20
Random Forest Regression with a payoff value of 25
Gradient Boosted Trees Learner with a payoff value of 27
ANN-Artificial Neural Network with a payoff value of 32.
Using the Most Performing Algorithm or the Linear Regression it is Possible to Create the Following Predictions
Austria with an increased variation from an amount of 153.333 to a valley of 159.21 units or a variation of 5.88 units equal to a value of 3.83%
Belgium with an increased variation from an amount of 81.111 units up to a value of 85.339 units or equal to a variation of 4.22 units equal to a modernization of 5.21%
Switzerland with an increased variation from an amount of 306,667 units up to a value of 319.06 with a variation of 12.39 units and 4.04%
Finland with a variation from a value of 306.6 units up to a value of 315.74 units or a variation of 9.0 units equal to an amount of 2.95%
France with a diminutive variation from an amount of 206.66 units up to a value of 204.65 units or equal to a variation of -2.011 units equal to an amount of 0.973%
Croatia with an increased variation from an amount of 28.88 units up to a value of 22.27 units equal to an amount of -6.61 units equal to a value of -22.89%
Montenegro with a variation from an amount of 17.77 units up to a value of 26.33 units or equal to a variation of 8.55 units equal to an amount of 48.14%
North Macedonia with a diminutive variation from an amount of 21.11 units up to a value of 17.55 units or equal to a variation of -3.56 units or equal to a variation of -16.86%
Norway with an increased variation from an amount of 204.44 units up to an amount of 217.48 units or equal to a variation of 13.04 units equal to an amount of 6.38%
Slovenia with a variation from an amount of 144.44 units up to a value of 115.340 units or a variation equal to an amount of -29.1 units equal to a variation -20.14%
UK with a variation from an amount of 53.33 units up to a value of 58.64 or equal to a variation of 5.3 units equal to an amount of 9.95%.
Conclusion
A clusterization is realized using the k-Means algorithm with a confrontation between the Elbow Method and the Silhouette Coefficient. Subsequently, a Network Analysis was applied with the distance of Manhattan. The results show the presence of 4 complex and 2 simplified network structures. Finally, a comparison was made among eight machine learning algorithms for the prediction of the value of lifelong learning. The results show that the linear regression is the best predictor algorithm and that the level of lifelong learning is expected to growth on average by 1.12%. Using the best predictor algorithm or the linear regression considering the countries for which prediction is available, it is a growth of the value estimated from an amount of 138.58 up to a value of 140.15 units or a variation of 1.56 Unit equal to an amount of 1.12%.
Declarations
Data Availability Statement: The data presented in this study are available on request from the corresponding author.
Funding: The authors received no financial support for the research, authorship, and/or publication of this article.
Declaration of competing interest: The authors declare that there is no conflict of interests regarding the publication of this manuscript. In addition, the ethical issues, including plagiarism, informed consent, misconduct, data fabrication and/or falsification, double publication and/or submission, and redundancies have been completely observed by the authors.
Appendix
| Appendix I Econometric Estimations Of Lifelong Learning |
|||||||
|---|---|---|---|---|---|---|---|
| WLS | Dynamic Panel | Pooled OLS | Fixed Effects | Random Effects | |||
| A32 | Coefficient and p-Value | Coefficient and p-Value | Coefficient and p-Value | Coefficient and p-Value | Coefficient and p-Value | Average | |
| Constant | -0,301657 | -2,89901*** | -0,884907 | -0,117227 | -0,221777 | -0,8849 | |
| Average Annual GDP growth | A2 | -5,28751 | -2,61121*** | -6,62813*** | -5,22935*** | -5,38303*** | -5,0278 |
| Basic-school entrepreneurial education and training | A4 | -0,456114 *** | -0,614517*** | -0,40619*** | -0,384467*** | -0,388624*** | -0,45 |
| Employment MHT manufacturing KIS services | A11 | -0,365435 *** | -0,196152* | -0,316996*** | -0,301216*** | -0,310829*** | -0,2981 |
| Enterprises providing ICT training | A15 | 0,145641*** | 0,140476* | 0,124765*** | 0,129128*** | 0,128288*** | 0,13366 |
| Finance and support | A17 | 0,309646*** | 0,206638*** | 0,495175*** | 0,239702*** | 0,261254*** | 0,30248 |
| Firm investments | A18 | -0,458598*** | -0,425916** | -0,343673*** | -0,431704*** | -0,422961*** | -0,4166 |
| Foreign doctorate students | A19 | 0,158934*** | 0,102913** | 0,128222*** | 0,134413*** | 0,134298*** | 0,13176 |
| Government procurement of advanced technology products | A22 | 2,64442*** | 2,157*** | 2,96687*** | 2,36671*** | 2,43037*** | 2,51307 |
| Human resources | A23 | 2,4533*** | 2,09951*** | 2,12949*** | 2,1676*** | 2,17311*** | 2,2046 |
| Innovation index | A24 | -1,13503*** | -0,846112*** | -1,45274*** | -0,970757*** | -1,01691*** | -1,0843 |
| Innovation-friendly environment | A25 | 0,0603056** | 0,126286** | 0,109497*** | 0,0605989** | 0,0647107** | 0,08428 |
| Innovative sales share | A26 | 0,137165*** | 0,0865422** | 0,172892*** | 0,123507*** | 0,127072*** | 0,12944 |
| Medium and high-tech product exports | A35 | 0,226112*** | 0,268367*** | 0,310804*** | 0,270102*** | 0,27734*** | 0,27055 |
| New doctorate graduates | A37 | -0,680338*** | -0,568418*** | -0,526936*** | -0,593602*** | -0,589056*** | -0,5917 |
| Non-R&D innovation expenditure | A38 | 0,215035*** | 0,170142** | 0,162683*** | 0,163784*** | 0,163172*** | 0,17496 |
| Private co-funding of public R&D expenditures | A43 | -0,210868*** | -0,195762** | -0,29897*** | -0,19283*** | -0,204905*** | -0,2207 |
| Public-private co-publications | A45 | 0,292351*** | 0,260138*** | 0,306284*** | 0,28975*** | 0,291664*** | 0,28804 |
| SMEs innovating in-house | A52 | 0,284019*** | 0,197863*** | 0,324087*** | 0,274303*** | 0,282972*** | 0,27265 |
| Tertiary education | A53 | -0,709618*** | -0,564285*** | -0,571989*** | -0,586842*** | -0,587529*** | -0,6041 |
| Trademark applications | A56 | 0,210685*** | 0,127375** | 0,224912*** | 0,182454*** | 0,188598*** | 0,1868 |
| Lifelong Learning | A32 | 0,0476886 | |||||
| Appendix -II MODEL 1077: WLS, USING 358 OBSERVATIONS INCLUDING 36 CROSS SECTION UNITS DEPENDENT VARIABLE: A32 WEIGHTS BASED ON ERROR VARIANCES PER UNIT |
|||||
|---|---|---|---|---|---|
| Coefficiente | Errore Std. | rapporto t | p-value | ||
| const | −0,301657 | 1,30109 | −0,2318 | 0,8168 | |
| A2 | −5,28751 | 0,674923 | −7,834 | <0,0001 | *** |
| A4 | −0,456114 | 0,0395485 | −11,53 | <0,0001 | *** |
| A11 | −0,365435 | 0,0370039 | −9,876 | <0,0001 | *** |
| A15 | 0,145641 | 0,0166901 | 8,726 | <0,0001 | *** |
| A17 | 0,309646 | 0,0391203 | 7,915 | <0,0001 | *** |
| A18 | −0,458598 | 0,0412767 | −11,11 | <0,0001 | *** |
| A19 | 0,158934 | 0,0159046 | 9,993 | <0,0001 | *** |
| A22 | 2,64442 | 0,217100 | 12,18 | <0,0001 | *** |
| A23 | 2,45330 | 0,0780205 | 31,44 | <0,0001 | *** |
| A24 | −1,13503 | 0,156933 | −7,233 | <0,0001 | *** |
| A25 | 0,0603056 | 0,0241769 | 2,494 | 0,0131 | ** |
| A26 | 0,137165 | 0,0265510 | 5,166 | <0,0001 | *** |
| A35 | 0,226112 | 0,0320144 | 7,063 | <0,0001 | *** |
| A37 | −0,680338 | 0,0360883 | −18,85 | <0,0001 | *** |
| A38 | 0,215035 | 0,0195994 | 10,97 | <0,0001 | *** |
| A43 | −0,210868 | 0,0322318 | −6,542 | <0,0001 | *** |
| A45 | 0,292351 | 0,0191380 | 15,28 | <0,0001 | *** |
| A52 | 0,284019 | 0,0352619 | 8,055 | <0,0001 | *** |
| A53 | −0,709618 | 0,0305864 | −23,20 | <0,0001 | *** |
| A56 | 0,210685 | 0,0219943 | 9,579 | <0,0001 | *** |
| Appendix -III Statistics Based On Weighted Data |
||||
|---|---|---|---|---|
| The sum of four residual | 293,7075 | E.S. of the regression | 0,933561 | |
| R-quadro | 0,986599 | R-quadro corretto | 0,985804 | |
| F(20, 337) | 1240,534 | P-value(F) | 9,2e-302 | |
| Log-likelihood | −472,5472 | Akaike criterion | 987,0944 | |
| Schwarz criterion | 1068,586 | Hannan-Quinn | 1019,504 | |
| Appendix -IV Statistics Based On Original Data |
||||
|---|---|---|---|---|
| Average var. employee | 90,83264 | SQM var. employee | 93,71702 | |
| The sum of four residual | 133403,3 | E.S. of the regression | 19,89612 | |
References
Boeren, E. (2017). Researching lifelong learning participation through an interdisciplinary lens.International Journal of Research & Method in Education,40(3), 299-310.
Indexed at, Google Scholar, Cross Ref
Caves, L. (2018). Lifelong learners influencing organizational change.Studies in Business & Economics,13(1).
Indexed at, Google Scholar, Cross Ref
Costantiello, A., Laureti, L., & Leogrande, A. (2021a). The intellectual assets in europe.Available at SSRN 3956755.
Indexed at, Google Scholar, Cross Ref
Costantiello, A., Laureti, L., & Leogrande, A. (2021b). The determinants of firm investments in research and development. InInternational Virtual Academic Conference Education and Social Sciences Business and Economics.
Costantiello, A., Laureti, L., & Leogrande, A. (2021c). The smes innovation in europe.Available at SSRN 3964059.
Costantiello, A., Laureti, L., & Leogrande, A. (2021d). The innovation-friendly environment in europe.Available at SSRN 3933553.
Dosunmu, A. G., & Adeyemo, K. S. (2018). Lifelong learning, human capital development and the career advancement of women in the telecommunications industry in South Africa.Industry and Higher Education,32(3), 192-199.
Indexed at, Google Scholar, Cross Ref
Eynon, R., & Young, E. (2021). Methodology, legend, and rhetoric: The constructions of AI by academia, industry, and policy groups for lifelong learning.Science, Technology, & Human Values,46(1), 166-191.
Fajcikova, A., & Urbancova, H. (2017). The Role of organizations in lifelong learning and development. Journal of the Mendelian University of Agriculture and Forestry in Brunnen,65(02), 621-630.
Indexed at, Google Scholar, Cross Ref
Farrow, R. (2018). Mooc and the workplace: key support elements in digital lifelong learning.
Formosa, M. (2019). Active ageing through lifelong learning: the university of the third age. InThe University of the Third Age and active ageing, 3-18.
Indexed at, Google Scholar, Cross Ref
Ho, B. C. (2021). Quality of work life and lifelong learning among working adults in Malaysia: the mediating role of employee engagement.818754346.
Kirova, M.P., Nedyalkov, A.N., & Tsaneva, M. (2018). University as prerequisite for sustaina-ble regional development in international context.Economics,10, 11.
Laureti, L., Costantiello, A., & Leogrande, A. (2020). The finance-innovation nexus in europe.IJISET-International Journal of Innovative Science, Engineering & Technology,7(12).
Leogrande, A., Costantiello, A., & Laureti, L. (2021a). The broadband penetration in europe.Available at SSRN 3953683.
Leogrande, A., Costantiello, A., & Laureti, L. (2021b). The Impact of Venture Capital Expenditures on Innovation in Europe.Available at SSRN 3930697.
Indexed at, Google Scholar, Cross Ref
Leogrande, A., Costantiello, A., & Laureti, L. (2022b). The exports of knowledge intensive services. A complex metric approach.A Complex Metric Approach.
Leogrande, A., Magaletti, N., Cosoli, G., Giardinelli, V., & Massaro, A. (2022a). The determinants of internet user skills in europe.Available at SSRN 4113155.
Levchenko, O., Levchenko, A., Horpynchenko, O., & Tsarenko, I. (2018). The impact of lifelong learning on the country’s development in dimension of innovative oriented economy: comparative analysis.
Maitra, S., & Guo, S. (2019). Theorising decolonisation in the context of lifelong learning and transnational migration: Anti-colonial and anti-racist perspectives.International Journal of Lifelong Education,38(1), 5-19.
Marin, A. A., & Prioteasa, A.L. (2020). The impact of using information technology and communication in schools in romania. Business Excellence and Management,10, 97-108.
Indexed at, Google Scholar, Cross Ref
Park, C. Y., & Kim, J. (2020). Education, skill training, and lifelong learning in the era of technological revolution.Asian Development Bank Economics Working Paper Series, 606.
Ruzinska, E. (2018). Efficient communication with seniors in lifelong learning to enhance their digital skills and economic literacy.Mlada veda,6(2), 174-184.
Shokirovich, E.T. (2020). Managing the concept of knowledgebased economy and lifelong learning in the context of globalization. Journal of Critical Reviews,7(15), 2426-2433.
Tvaronaviciene, M., Tarkhanova, E., & Durglishvili, N. (2018). Sustainable economic growth and innovative development of educational systems.Journal of International Studies,11(1).
Indexed at, Google Scholar, Cross Ref
Valiente, O., Capsada-Munsech, Q., & G de Otero, J. P. (2020). Educationalisation of youth unemployment through lifelong learning policies in Europe.European Educational Research Journal,19(6), 525-543.
Received: 27-Oct-2022, Manuscript No. JEEER-22-12736; Editor assigned: 29-Oct-2022, PreQC No JEEER-22-12736 (PQ); Reviewed: 13-Nov-2022, QC No. JEEER-22-12736; Revised: 26-Nov-2022, Manuscript No. JEEER-22-12736(R); Published: 03-Dec-2022