Research Article: 2021 Vol: 22 Issue: 4S
The Effects of Intellectual Property Rights on Technological Innovation: Empirical Evidence in Emerging Countries
Selma Ezzeddine, University of Sfax
Citation Information: Ezzeddine, S. (2021). The effects of intellectual property rights on technological innovation: Empirical evidence in emerging countries. Journal of Economics and Economic Education Research, 22(S4), 1-10
Abstract
The objective of this paper is to exanimate an econometric model for analyzing the effect of intellectual property rights on technological innovation in emerging countries using panel threshold regression on 10 emerging countries for 1985 to 2017. The results demonstrate the existence of non linear relationships between IPRs and technological innovation which the form is an inverted U shaped curve, It’s shown that innovations in emerging countries increase in it is IPRs by looking for the factor of human capital and economic development who play an indirect role in increasing the impact of IPR on innovation.
Keywords
Protection of Intellectual Property Rights, Technological Innovation, Panel Threshold Model, Emerging Countries.
Introduction
Among the various driver of modern economic growth has been the distinctive role played by technological innovation. Of the different factors stimulant innovation, none has received as much attention as intellectual property protection.
IPR protection could help to stimulate creativity and risk-taking against counterfeiting and imitation. So, constantly innovating will be the condition for sustainable economic growth.
In recent years, technological innovation has progressed, giving a central role to the protection of intellectual property rights, which have an important role in the emergence and resolution of international economic conflicts. This evolution led to the Agreement on the aspects of Trade-Related Intellectual Property Rights (TRIPS) which was concluded during the Uruguay Round of the General Agreement on Tariffs and Trade (GATT) in 1994. In the same goals, the TRIPS Agreement describes an objective of extending the rigor of IPR protection.
The study of the relationship between IPR and innovation has become a major topic in economic research. The impact of intellectual property rights on innovation may have the potential for a positive or negative result; therefore, the rate of innovation may vary positively or negatively. This impact leads to non-linear relationships between IPRs and innovation. In other words, the IPR system may have a different impact on innovation with the existence of certain thresholds.
The motivation for this paper comes from the ambiguity of the results of the precedent studies and from the diversity of approaches building to establish the link between IPRs and innovation. Our main research question is this: What is the effect of intellectual property rights on technological innovation in emerging countries?
The aims of this paper is to examine a possible nonlinear relation between IPR and innovation. To this end, we provide econometric estimations based on panel threshold regression, a method recently developed by Hansen (2000). A threshold model applied to panel data covering 10 emerging countries (India, Brazil, Russia, China, South Africa, Indonesia, Saudi Arabia, Turkey, Mexico, Nigeria) is estimated. The present study is different from the erstwhile studies in three folds: previous empirical research on the relationship between IPR and innovation focus on the developed countries or on a group of developed and developing countries. This analysis offers new evidence in emerging countries. As well, the data covers relatively for a long period of time (for 1985 to 2017). Finally, the outcomes of this study will not only contribute to the literature of innovation but can also prolong globally with nonlinear relationships and the existence of U inverse between the Intellectual Property rights and innovation in emerging countries.
The outline of this paper is organized as follows: Section II briefly reviews the literature; then describe the PTR methodology and present the dataset in section III. In section V and VI focus on the empirical result, then consider those results and finally conclude the paper.
Literature Review
Different recent literature examinates the effect of intellectual property protection on technological innovation. The IPRs system appears in literature as a key factor for innovation and several studies investigate the nature of this relationship if it’s a linear or a nonlinear relationship. Intellectual property right has been recognized as part of the infrastructure to encourage investment in research and development (R&D) leading to innovation (Grossman & Helpman, 1991).
Schneider (2005) shows that IPRs have a positive effect on innovation in developed countries and a negative effect in developing countries. This result has been partially challenged by Allred and Park (2007) who fail to seek out a big effect for developing countries, but a U-shaped curve in developed countries.
Kanwar (2003) argued that strengthening property rights could lead on to greater innovation in developed countries, which successively might be useful in developing countries. For Hudson and Minea (2013) the IPRs effects on innovation are more complex than they initially expected. They used a Panel Smooth Threshold Regressions model created by Gonzalez et al. (2005) to perform the estimation of IPRs level on innovation, employing a dataset of 62 developed and developing countries. They concluded that IPRs exerts a posh effect on innovation and therefore the relationship is actually a U-shaped curve.
Sweet and Maggio (2015) examined the effect of IPRs on innovation utilizing the Ginarte and Park (1997) index on 94 countries within the period between 1965 and 2005. The results of OLS and GMM models found that IPRs protection features a positive impact on innovation in countries with a better level of development.
Kanwar and Evenson (2003); Branstetter et al. (2006) show not only that stronger IPR always improve innovation confirmed by; (
Allred and Park (2007) achieve that the nonlinear relationship between patent strength and R&D applies to developed countries but to not developing, which characterized by stronger IPR, stronger patent protection increases R&D. Many recent of literature observe that the impacts of IPR effects of IPR son innovation.
The more lately, Papageorgiadis and Sharma (2016) studied a panel model which used the Ginarte and Park (1997) index. They sample examined 48 countries between 1998 and 2011. To clarify the stronger linked with the legal system and with the strength of patent regulation
Data and Methodology
Data Source
This study analyzed a data set of 10 emerging countries (India, Brazil, Russia, China, South Africa, Indonesia, Saudi Arabia, Turkey, Mexico, Nigeria) from 1985 to 2015. The variables were divided into primary and control groups. The primary group considered innovation and intellectual property rights. With regard to innovation, there are two main methods of measurement: (i) the R&D expenditure and (ii) the number of patents. As the empirical study requires a large time-series dataset that includes the emerging countries, it uses the number of US patents per capita granted to the residents of a given country each year. To avoid selection bias for US innovations, this study follows previous studies of Porter and Stern(2000); ( Aboites & Cimoli 2002) and excludes the United States from the dataset. Thus, the study attempted to use the same data as those of previous studies (Lach, 1995) in the literature to ensure a degree of comparability with regard to the choice and definition of the control variables. As regards the other primary variables, this study measured the IPR using the index developed by Ginarte and Park (1997)and updated by Park (2008). Note that the IPR index is constructed and not a “measured variable.”As mentioned earlier, it is based on Ginarte and Park’s approach, which is believed to be the best method to understand its subjective nature. The choice of the control variables is based on the existing literature. Using the Barro and Lee (2010) dataset, this study defines human capital as the percentage of the total enrollment among the school-aged population over 15 at the tertiary level (EDUC). In addition, openness is found to be a source of knowledge and technology transfers (Porter & Stern, 2000); openness (OPEN) is defined as the total trade shown in Table 1.
| Table 1 Data Source | ||
| Variables | Definition | Source |
| Dependent variable | ||
| Innovation | The average number of US patents per capita granted to residents of a given country for each year t | United States Patent and Trademark (USPTO) |
| Independent variable | ||
| Ginart and Park index (IPR) | Level of IPR protection every 5 years | Ginarte and Park (1997), Park (2008b) |
| GDP per capita | The average annual GDP per capita | World Bank Development Indicators |
| Education | The percentage of the total school-age population of more than 15 at the tertiary level | Barro and Lee (2010) |
| OPEN | Total exports and imports as% of annual GDP | World Bank Development Indicators |
This study uses the Ginarte and Park (GP) index developed for each country. Using the coding system according to their national patent laws to cover all aspects of intellectual property rights, the GP index adopts five broad categories shown in Table 2.
| Table 2 Construction of the Ginarte–Park Index | |||
| 1 | Extent of Coverage | Yes | No |
| Patentability of Chemicals and Pharmaceuticals | 1 | 0 | |
| Patentability of Textiles, Paper, and Metallurgy | 1 | 0 | |
| Physics and Electricity | 1 | 0 | |
| Mechanical Engineering, Lighting, Heating, Weapons | 1 | 0 | |
| Fixed Constructions | 1 | 0 | |
| Patentability of Food | 1 | 0 | |
| Patentability of Surgical products | 1 | 0 | |
| Patentability of Microorganism | 1 | 0 | |
| 2 | Membership in International Patents Agreements | ||
| TRIPS Agreement | 1 | 0 | |
| Paris Convention | 1 | 0 | |
| Patent Cooperation Treaty | 1 | 0 | |
| 3 | Provisions for the Loss of Protection | ||
| Working Requirements | 1 | 0 | |
| Compulsory Licensing | 1 | 0 | |
| Revocation of Patents | 1 | 0 | |
| 4 | Enforcement Mechanisms | ||
| Preliminary Injunction | 1 | 0 | |
| Contributory Infringement | 1 | 0 | |
| Burden-of-Proof Reversal | 1 | 0 | |
| 5 | Duration of Protection | Value | |
| Application-based Standard | |||
| x ≥ 20 years | 1 | ||
| 0 ≥ x < 20 | x / 20 | ||
| Grant-based Standard | |||
| x′ ≥ 17 years | 1 | ||
| 0 ≥ x′ < 17 | x′ < 17 | ||
(Source) See Ginarte and Park (1997)for explanations of the categories and features.
The Methodology of Panel Threshold Model
This study explains the technological innovation by the level of protection of IPR and other control variables. To account for the nonlinear effect of the IPR innovation system, it uses a Panel Threshold Regression (PTR) model developed by Hansen.
The threshold model consists of estimating the following relation:
 (1)
(1)
The average number of US patents per capita (innovation) was chosen as the dependent variable. The threshold variable (Di, t) is a GP index of IPRs, which is the key variable used to verify whether a threshold effect of IPR on innovation exists.
Γ refers to a threshold parameter, (I) is an indicator function that takes value 1 if the value of the intellectual property rights (Di, t) is below a specified threshold value, and 1 otherwise.
This methodology aids in dividing the study sample into two regimes based on whether the threshold variable is above or below the estimated threshold. The two regimes are distinguished by different regression slopes, β1 and β2. Therefore, the regression equation for a single threshold can be written in two equations:
 (2)
(2)
 (3)
(3)
where the first represents the speed below the threshold and the second the speed above the threshold.
Equation (1) in the first step is estimated using Ordinary Least Square to identify the threshold. The sum of square error S1 is calculated next for all the possible values of the threshold variable.
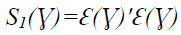
In the second step, the threshold parameter is obtained by minimizing S1, such that
γ =argminS1(γ).
On estimating the endogenous threshold, it is essential to check whether its effect is statistically significant. The null hypothesis of this test is presented as follows:
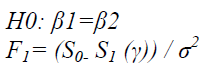
S0 and S1 are the sums of the square errors under the null and alternative hypotheses. Since the threshold value is not identified in H0, the asymptotic distribution of F is not standard. As a solution, proposed a bootstrap method to simulate the p-value for F1 statistics.
Thus, the threshold models in this study of which consists in estimating the following relation:

The dependent variable Yit is the average number of US patents issued to the per capita residents (innovation).
Dit is the threshold variable of country i at date t, which measures the index of the IPR. The GP index is a measure of the protection of the IPR developed by Park and Ginarte (1997). This index is between 0 and 5, where a high index reflects a higher level of protection, as explained earlier, and how to build it.? is the threshold value (DPI value); (I) is an indicator function, which takes value 1 if the condition in parentheses is respected and 0 if not.
X represents a vector of the control variables, such as education, trade openness, FDI / GDP, and GDP / Cap.
For empirical analysis, our study uses a descriptive analysis that clarifies and describes the data characteristics and measurements of the sample.
Empirical Results
Table 3 indicates a summary statistics. It presents information on the average level of the standard deviation, the minimum, and maximum of the variables of research for all the countries of the sample. While the average number of US patents issued is high (550.4317), that of the other countries reached its maximum (18040).
| Table 3 Descriptive Statistics | ||||
| Variables | Mean | Standard Deviation | Minimum | Maximum |
| Innovation | 550.4317 | 1905.245 | 1 | 18040 |
| IPR | 2.837714 | 1.287642 | 0 | 4.76 |
| GDP/Cap | 4590.14 | 3832.471 | 335.3974 | 16972.32 |
| Education | 22.34906 | 18.87479 | 2.47547 | 78.98195 |
| Open | 54.31334 | 25.22903 | 3.964631 | 102.3765 |
GDP: Gross domestic product
The index of the IPR protection is on average equal to 2.83% in the emerging countries. A high margin of dispersion indicates the variations and fluctuations of this index from one country to another. The maximum percentage of the protection of innovations is equal to 4.76% in some emerging countries, while that of the other countries is zero. Finally, one can see that the explanatory variables of this model show many variations shown in Table 4.
| Table 4 Correlations | |||||
| Innovation | DPI | GDP/Cap | Education | Open | |
| Innovation | 1 | ||||
| IPR | 0.3470*(0.003) | 1 | |||
| GDP/Cap | -0.0939(0.104) | 0.1663(0.168) | 1 | ||
| Education | 0.0711(0.219) | 0.3690*(0.001) | 0.3866*(0.000) | 1 | |
| Open | -0.0144(0.804) | 0.3791*(0.001) | 0.3031*(0.000) | 0.3279*(0.000) | 1 |
GDP: Gross domestic product
Multicollinearity can falsely identify the estimation of the regression coefficients and make the estimated values of the coefficients at low fluctuations of the data which make it unstable and difficult to interpret (Bourbonnais, 2009); Deardorff (1992); Bresnahan and Trajtenberg (1995). Therefore, the correlations matrix is further elucidated. Pearson’s correlation matrix shows a strong correlation between the education variable and IPR, which implies the importance of higher education in the valuation of R&D. It helps to transform scientific knowledge into commercial outputs and to protect them through IPR. Similarly, the correlation between the percentage of higher education and the GDP per capita variable is strong and significant at 1%. Thus, it is argued that education is a fundamental vector for the creation and stimulation of economic growth.
Table 5 presents the test statistics F1, F2, and F3, along with their bootstrap p-values. It is found that the tests for a double-threshold F2 and a triple-threshold F3 are insignificant with a bootstrap p-value of 0.178 and 0.74, respectively. Only the test for a single-threshold F1 is significant with a bootstrap p-value of 0.000. Thus, the study concludes that IPR has only one threshold effect on innovation in a country. The point estimate of the threshold (γˆ1) is 1.2200 and the asymptotic confidence interval is [1.1600; 1.2300]. Figure 1 shows more information on the threshold estimate from the plot of the concentrated likelihood ratio function LR1 (γ).
| Table 5 Tests for Threshold Effects | |
| Single threshold effect test | |
| Threshold value | 1.2200 |
| F1 | 114.44 |
| p-value | 0.000 |
| Critical value of F 10%,5%,1% | (11.4233;13.3379;15.7027) |
| Double threshold effect test | |
| Threshold value | 1.2200;1.5600 |
| F2 | −6.86 |
| p-value | 0.1780 |
| Critical value of F 10%,5%,1% | (2.9988;14.6031;34.7669) |
| Triple threshold effect test | |
| Threshold value | 1.0300;1.2200;1.5600 |
| F3 | −66.03 |
| p-value | 0.4760 |
| Critical value of F 10%,5%,1% | (0.000;0.000;5.0935) |

Figure 1 The Plot of the First Threshold in Emerging Countries
Figures 1 indicates the estimates of the thresholds of the likelihood ratio function. Point estimates are the values from which the likelihood ratio reaches the 0 axes, which is seen at the end of the left part. Therefore, the likelihood ratio is below the dotted line.
This study assumes that there is a threshold effect of the IPR index on innovation. It is important to determine if this threshold effect is statistically significant. The null and alternative hypotheses can be represented as follows:
H0 : δ = θ
H1: δ ≠ θ
When the null hypothesis is accepted, the coefficient δ = θ; therefore, the threshold effect does not exist. When the alternative hypothesis is retained, coefficient δ ≠ θ; hence, there is a threshold effect of the IPR index on innovation.
Table 6 shows that the threshold effect is significant at 1% (p-value = 0.0000). The threshold divides the observations into two regimes. The existence of nonlinear effects is confirmed by a positive and highly significant coefficient of the threshold variable.
| Table 6 Estimation of the Panel Threshold Regression Model | ||||
| Dependent variable: The average number of patent | ||||
| Independent variable | Regime1 (DPI≤ 1.2200) | Regime 2 (DPI>1.2200) | ||
| Coefficient | T-Statistics | Coefficient | T-Statistics | |
| Intellectual Property Rights | 1.1930 | 0.000 *** | 1.8103 | 0.000 *** |
| GDP per capita | 0.0300 | 0.000 *** | 0.0007 | 1 |
| Education | 0.0040 | 0.0046 *** | 0.0022 | 0.0277 ** |
| Open | 0.0111 | 0.317 | −0.0060 | 0.774 |
| Confidence Interval of threshold | [1.1600, 1.2300] | |||
| F1statistic bootstrap value | 0.000 | |||
The threshold value of the DPI index (γ) is equal to 1.22% When the IPR index is less than or equal to 1.22%, the IPR coefficient is positive (1.1930) and significant. The same results can be applied to the second regime, so it can be said that IPR positively affects technological innovation in case of both the lower and upper threshold. From the moment that δ and θ are both significant, the influence of IPR protection on innovation is significant regardless of the level of protection below or above the threshold.
The study results corroborate those found by Kanwar (2007), Kanwar and Evenson (2003) and Chen and Puttitanun (2005); Crosby (2000). The GDP per capita is significant in the first regime, but not in the second. Therefore, it is also an important indicator in the process of innovation. The percentage of higher education is significant in the first threshold (0.0046), while it has a positive and significant effect on the second threshold. However, trade openness is negative for the second regime and not significant in both regimes. Higher education is highly significant and positively impacts technological innovation as a second variable influencing the protection of innovation; therefore, the highest levels of education encourage innovation.
The effect of the control variables of our model is similar to that found in the related studies. Jaunotte (2005); Park (1997); Ortega and Derman (2010); Castellacci (2007). showed that the interactions between the stock of the human capital and IPRs determine the overall balance of the R&D effort, and IPR tends to increase the effect of education on innovation.
These results examine that, to stimulate innovation in the emerging countries, a combination of a high level of IPR protection with the human capital factor (% of higher education) is required. This is not effective when the country has a low level of IPR protection. However, the gain in innovation would be considerably higher as the GDP per capita increases. In this case, the high level of GDP per capita is considered as an incentive for the protection of innovation (Lerner, 2009; Qian, 2007; Dcolalikar & Lars-Hendrik, 1989).
However, several studies have found that to explain the effect of IPR on innovation, it is necessary to concentrate exclusively on the level of economic development. Allred and Park (2007); Chen and Puttitanum(2005); Ginarte and Park (1997); Schneider (2005)also emphasized the existence of a second variable, which shows that IPRs have a fundamental impact on innovation. In fact, there is a U inverse «relationship between the optimal strength of the intellectual property regime and innovation.
This relationship might vary because of other important factors such as the level of economic development and the level of education, as stated by Stiglitz (2008): “IPRs should be considered as part of an instrument portfolio. Therefore, we need to strengthen the other elements of this portfolio and know our intellectual property regime to increase its benefits and reduce its costs, which means that the increase the economic efficiency is very likely to increase the pace of innovation.”
Trade openness not only enables a greater potential market but it is also a possible source of knowledge transfer, which implies increased competition (Eaton & Kortum, 1996), which in turn may reduce the incentive to innovate. Protection of innovations helps renew the design and the role of IPRs in innovation for public authorities in emerging countries. While IPR protection does not play a direct role as an incentive for innovation in the emerging countries, this factor should not be ignored, but it must occupy a central place in the policy of promoting innovation due to the importance of the human capital for research and development as well as for economic development.
Conclusion
The goals of this paper are to explore the empirical trend on the influence of IPR on technological innovation, contrary to previous papers that examine the impact of GDP per capita and IPR on innovation. To investigate nonlinear effects between innovation, IPR is by using a panel threshold regression (PTR).
One important conclusion, shown that the stronger IPR has an indirect influence on innovation, the high level of IPR protection and it is an impact to stimulate innovation is highly dependent on levels of per capita GDP and the level of education.
These variables are considering as stimulant factors for the effect of IPR on innovation.
So, the IPR protection may not have a direct impact on innovation, affecting others variant which in turn impact innovation. The same results confirmed with Kanwar and Evenson (2003). The impact of IPR on innovation is positive and significant in emerging countries and represent nonlinear relationships between them, due to that the firms in these countries more convinced for the importance that IPR has on innovative activities. IPR is one of the important elements required to promote innovation. Therefore, to realize it is full potential IPR objectives is depend on the economic conditions characteristic containing regulatory reforms and institutional environment in a particular country.
References
- Aboites, J., & Cimoli, M. (2002). Intellectual property rights and national innovation systems �some lessons from the Mexican experience. Revue d’Economie Industrielle, 99, 215-232.
- Allred, B.B., & Park, WG. ((2007). Droits de brevet et activit� innovante: Elements de preuve provenant de donn�es nationales et de niveau d'entreprise. Journal of International Business Studies, 38(6), 878-900.
- Branstetter, L., Fisman, R., & Foley, F. (2006). Do stronger intellectual property rights increase international technology transfer? Empirical evidence from U.S. firm-level data. Quarterly Journal of Economics, 121(1), 321-349.
- Bresnahan, T., & Trajtenberg, M. (1995). General purpose technologies: Engines of growth. Journal of Econometrics, 65, 83-108.
- Castellacci, F. (2007). Evolutionary, and new growth theories. Are they converging. Jounal of Economic Surveys, 21 (30), 585-627.
- Chen, Y., & Puttitanum, T. (2005). Intellectual property rights and innovation in developing countries: Journal of Development Economics, 78, 474-493.
- Crosby, M. (2000). Patents, innovation, and growth. Economic Record, 76, 255- 262.
- Deolalikar, A., & Lars-Hendrik, R. (1989). Patenting by manufacturing firms in India: its production and impact: Journal of Industrial Economics, 37, 303-314.
- Deardorff, A.V. (1992). Welfare Effects of Global Patent Protection: Economica, 59 (233), 35-51.
- Eaton, J., & Kortum, S. (1996). Measuring technology diffusion and the international sources of growth. Eastern Economic Journal, 22(4), 401-410.
- Ginarte, J.C., & Park, W.G (1997). Determinants of patent rights: A cross-national study. Research Policy, 26(3), 283-301.
- Grossman, G.M., & Helpman, E. (1990). Comparative advantages and long-run growth. American Economic Review, 80, 796-815.
- Hansen, B.E. (2000). Sample splitting and threshold estimation. Econometrica, 68(3), 575-603.
- Kanwar, S., & Evenson, R.E. (2003). Does intellectual property protection spur technological change. Oxford Economic Papers, 55(2), 235-264.
- Kanwar, S. (2007). Business enterprise R&D, technological change, and intellectual property protection. Economics Letters, 96, 120-126.
- Lach, S. (1995). Patents and productivity growth at the industry level: a first look. Economics Letters, 49, 101-108.
- Lerner, J. (2009). L'impact empirique des droits de propri�t� intellectuelle sur l'innovation: Puzzles et indices. The American Economic Review, 99(2), 343-348.
- Park, W.G., & Ginarte, J.C. (1997). Intellectual property rights and economic growth. Contemporary Economic Policy, 15, 51-61.
- Park, W.G. (2008). International patent protection� 1960-2005. Research Policy, 37, 761-766.
- Qian, Y. (2007). Les lois nationales sur les brevets stimulent-elles l'innovation nationale dans un environnement de brevets mondial? Une analyse transnationale de la protection des brevets pharmaceutiques. The Review of Economics and Statistics, 89(3), 436-453.
- Schneider, P.H. (2005). International trade, economic growth, and intellectual property rights: A panel data study of developed and developing countries. Journal of Development Economics, 78(2), 529-547.
- Varsakelis, N. (2001). The impact of patent protection, economy openness and national culture on R&D investment: A cross country empirical investigation. Research Policy, 30, 1059-1068.