Research Article: 2017 Vol: 18 Issue: 3
The Effects of Trade On Poverty: Does Sectoral Composition of Trade Matter? Evidence From Emerging Economies
Zhaohua Li Huazhong, University of Science and Technology
Farha Fatema Huazhong, University of Science and Technology
Keywords
Trade Composition, Poverty, Emerging Economies, Revealed Comparative Advantage.
JEL Code: O50, F63, F14.
Introduction
Over the last few decades, both the value and mass of international trade is growing drastically and the world economy has experienced significant qualitative changes within and between countries. Most of the developing countries are participating in the international market for trade and the world economy is becoming highly integrated. However, the concern is that whether the poor have been circumvented or actually harmed by the economic integration and it has attracted the focus of the academicians and the policy makers as a crucial research issue over the decades.
The leading framework to explain the effect of trade on poverty is Stolper-Samuelson (SS) theorem. Basically, SS theory suggests that the real income of the abundant factor will increase with growing trade openness. If the developing countries are abundant with unskilled labour, then the unskilled labour (the poor) in these countries will enjoy the highest gain from trade. From this viewpoint Krueger (1983), Bhagwati and Srinivasan (2002) assume that in the low-income countries growing trade openness should benefit the poor of the low-income countries because these economies have a comparative advantage in the production of low-skilled or unskilled goods that require unskilled labour. Moreover, Heckscher-Ohlin (HO) theory suggests that in the presence of perfect mobility of labour the winner and losers from trade can be identified based on the level of skills no matter where they work. Many of the authors adopt a specific factor model which suggests that the gains from trade of the workers depend on the sectors (importing/exporting) in which they work.
Easterly (2006) explains trade and poverty linkages from the perspective of neoclassical growth model which suggests that if developing countries have abundant unskilled labor, then free trade or factor mobility will result in capital flow to developing countries and consequently increase per capita income in the developing countries. On the other hand, if per capita income changes stem from productivity differences across countries then globalization will not affect or exacerbate poverty since capital will flow from low productive countries to high productive countries.
Trade affects poverty through a number of channels such as economic growth, changes in factor and good prices, technological change, factor movement and so forth (Nissanke & Thorbecke, 2006). Many of the early studies examine trade’s effect on poverty by focusing on the trade-growth-poverty channel (Dollar & Kraay, 2002, 2004; Frankel & Romer, 1999; Prasad, Rogoff, Wei & Kose, 2005; Sachs, Warner, Åslund & Fischer, 1995). Several studies (Dollar & Kraay, 2002; Prasad et al., 2005; Sala-i-Martin, 2002a, 2002b) emphasize that trade liberalization raises the earnings of the poor by increasing long-run economic growth. They further argued that growing trade or flows of capital increases productivity as well as capital accumulation which successively raises the average returns of the poor and reduce poverty.
According to Lall (2000), low-technology products cause slower economic growth whereas highly technology-intensive products result in rapid growth in the economy. Export growth in high tech sector highly contributes to output growth when countries have a greater share of manufacturing exports than the world average (Aditya & Acharyya, 2013). Moreover, import of new products results in the introduction of new technology that raises productivity and inward FDI causes the likelihood of technology transfer. Growing income from productivity gains from trade should upsurge the gains of the poor in case of fairly uniform income effects (Harrison, 2006).
Trade composition also influences other channels through which trade affect poverty French (2014) found that composition of trade flows significantly affects the welfare gains from trade and low-income developing countries experience larger effects of trade barriers and higher welfare gains from trade.
The important factor that is not addressed by the studies done so far is that whether sectoral composition of trade has differential effects on poverty. Davis and Mishra (2007) argued that gain from trade cannot be properly explained by the narrow interpretation of SS theorem. The simple framework developed by Davis and Mishra (2007) suggests that the poor may gain from trade if tariff is reduced on the goods the people buy and if growing trade openness raises the price of the goods they produce such as agricultural products in this case trade will likely alleviate poverty in the developing countries.
So, based on the discussions so far, it is clear that composition of trade significantly affects economic growth as well as several other channels of trade-poverty linkage, but none of the studies paid attention to examine the effects of trade composition on poverty in the developing countries. This study identifies the differential effects of trade composition on poverty in the emerging countries.
Export and import of a country are classified into four broad categories such as LIM; CIM; agriculture; and service. This study identifies that whether international trade, export and import separately, as well as comparative advantages of these four sectors have differential effects on poverty. As the studies on trade-poverty nexus are sensitive to econometric modeling, we apply system GMM approach to address problems of omitted variable bias and endogeneity to a panel data of 31 emerging countries over 1994-2014. This study considers emerging economies as research focus because they have significant contribution in the global economy and substantial share in aggregate in international trade in the recent era. Moreover, these countries experience soaring economic openness and growth and stand in the transitional stage in the development process.
The residue of the study continues as follows: The next section extensively discusses the related studies in this research field. The following section discusses the variables and the data sample along with their respective sources. Section 4 discusses the econometric techniques applied to this study and section 5 summarizes and analyses empirical results. The final section 6 draws conclusions and suggests policy issues.
Literature Review
Based on different methodological approaches, sources of data and multiple poverty measures several studies identified a significant and steady reduction in poverty rates over the last decades due to economic integration, for example, Atkinson & Brandolini (2010); Bergh & Nilsson (2014); Dhongde & Minoiu (2013); Le Goff & Singh (2014); Sala-i-Martin (2006) whereas other studies show that number of people living under poverty line has increased (Kanbur, 2001, 2005; L'Huillier, 2016). According to Santos-Paulino (2012), a fundamental debate in the trade-poverty linkage is the extent to which economic growth reduces poverty. He also argues that most of the empirical literature recognizes economic growth as the most crucial channel through which trade affects poverty.
A number of studies identified that trade composition has a differential effect on economic growth. Mazumdar (1996) identified that pattern of trade is a key catalyst for economic growth. According to his findings, a country substantially gains from trade if it imports the consumption good and exports the capital good although trade will not lead to higher economic growth. He further explained that because of trade the relative price of the investment good increases that have had a counteracting effect on savings or the rental price of capital. Lewer and Den Berg (2003) supported the hypothesis suggested by Mazumdar (1996) and found that countries importing mostly capital goods and exporting consumer goods grow faster than countries exporting capital goods and importing consumer goods. They provided significant policy implications that developing countries should focus on their comparative advantage in producing labour-intensive consumer goods to boost their economic growth. There is a significant positive association between exports and economic growth when the economic growth is driven by manufactured exports rather than food processing exports and international tourism (Hachicha, 2001). Both export and composition of export have strong positive linkage with economic growth (Greenaway, Morgan & Wright, 2006). According to Ghatak, Milner and Utkulu (1997), the export-growth relationship is pushed by manufactured exports rather than by traditional exports.
Although several studies identified that composition of trade has a differential effect on economic growth of a country, in the research area of trade-poverty nexus, very few studies addressed the issues that whether composition of trade has differential effect on poverty in a very narrow scope. In Sri Lanka, liberalization of the manufacturing industries is more pro-poor than that of the agricultural industries and trade reforms amplify the income inequality between the rich and the poor as different household groups benefit from trade differently (Naranpanawa, Bandara & Selvanathan, 2011). Export orientation reduces both poverty and inequality, but import orientation is related to higher poverty in the Brazilian states (Castilho, Menéndez & Sztulman, 2012). According to Warr (2014), the gain in well-being in agricultural liberalization is much smaller than across the full liberalization when the protection is removed. Moreover, broad liberalization of trade policy is expected among the poor, urban and rural in both countries while only the urban poor are interested in agricultural trade openness. Shuaibu (2016) found that trade liberalization in agriculture and manufacturing sectors moderately reduces poverty and the effect is more evident for urban areas whereas the weak sectoral connection between these two sectors partly decrease poverty.
As per the empirical studies in trade-poverty nexus field, there are several channels of trade and poverty linkage other than economic growth such as changes in the relative product and factor prices (Shuaibu, 2016; Williamson, 2005; Wood, 1997); cross-border factor mobility (Basu, 2003; Kanbur, 1999; Kiskatos & Sparrow, 2015; Rodrik, 1997); technological progress and diffusion process (Culpeper, 2005; Milanovic, 2002); institutional development (L'Huillier, 2016; Rodrik, 1998a, 1998b, 2004; Sindzingre, 2005); and so on. Although the sectoral composition of trade influences different channels of trade-poverty linkage, none of the previous studies focused on identifying how trade in different sectors affects poverty. This study will examine the effects of trade composition on poverty in the emerging economies. Two major research questions addressed in this study are: Whether the composition of trade of different sectors has diverse effects on poverty and how comparative advantage of these sectors affects poverty? In this study, we identify how expanding export and import of various sectors affect poverty. Further, we examine whether the comparative advantage of these sectors has differential effects on poverty. In both cases, we use both relative and absolute measures of poverty such as poverty headcount ratio at $1.90 per day (HCR) and average income of poorest quintile (lowest 20% population) (AILQ) respectively.
Data Description
We use several measures of poverty, trade composition and various conditioning information. This section describes the variables and the sources of data used in the study, as well as, discuss summary statistics of the variables under estimation.
Measures of Poverty
In the research field of trade-poverty linkage, measure of poverty is considered as a vital issue because trade-poverty linkage is extremely swayable to the measures of poverty. According to Ravallion (2003), measure of poverty is the fundamental factor for quite a lot of disputes in the empirical literatures concerning the effects of trade on poverty. To solve the measurement problems we use both absolute and relative measures of poverty.
As a proxy to relative measures of poverty, we use poverty HCR at $1.90 per day which is considered as the extreme poverty line as per World Bank estimate. Ravallion (2003) argued that the more relative poverty measures, the less impact economic growth will have on poverty. So to avoid this issue, we also use absolute measures of poverty. The indicator of absolute poverty is average income of lowest quintile (bottommost 20% population of the country) and it is measured as follows (Seven & Coskun, 2016):
Average Income of Lowest Quintile (AILQ)
This measure of poverty will identify whether trade increases average income of lowest 20% population of a country.
Measures of Trade Composition
To determine the differential effects of trade composition on poverty we segregated international trade into four general categories such as LIM; CIM; agriculture; and service. It is easy to distinguish between agriculture and service sector as per the database of UNComtrade. However, the distinction between LIM and CIM sectors is difficult and sensitive to different factors such as technology; labour requirement; production process; and so on. We divided LIM and CIM products according to the value addition per employee and involvement of fast-changing superior technologies in the production process. LIM products are categorized by high employee value addition and use of stable and well-diffused technology. CIM products require advanced and updated technology with high R&D investment, but labour requirement is very low. Following some previous studies like Busse & Spielmann (2006); Islam, Li & Fatema (2017); Thorbecke & Zhang (2009); Tyers, Phillips & Findlay (1987), we categorized LIM and CIM products based on classified trade data collected from UNComtrade database as per SITC-3.1
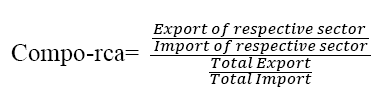
Firstly, we examine how export and import of these four sectors affect poverty. To identify the effects of comparative advantage of each sector on poverty calculated revealed comparative advantage (RCA) of each sector following the methods of Busse and Spielmann (2006) as follows:
Control Variables
In the regression analysis, we used several control variables for robust results in trade composition poverty linkage. We use economic growth as control variable as it is the key channel of trade-poverty linkage (Dollar & Kraay, 2004). According to Nissanke and Thorbecke (2006), technological progress and diffusion process affect both poverty and income distribution. As a proxy to technological progress, we take the value of technology upgrading and deepening index developed by UNIDO. The technology index value ranges from 0 to 1 where the higher the value of index the higher the level of technological progress.
Balat and Porto (2007) argued that trade liberalization affects poverty by swaying the goods’ prices produced and consumed by the poor. So we use inflation-CPI as a control variable rather than inflation-GDP deflator. Several other studies (Dollar & Kraay, 2002; Easterly & Fischer, 2001; Ravallion & Datt, 1999; Seven & Coskun, 2016) also identified inflation rate as significant determinants of poverty. We used unemployment rate as control variable because it usually affects poverty both in short- and medium-run (Goldberg & Pavcnik, 2004). In addition, higher import composition results in higher unemployment that affect both urban and rural poor (Kletzer, 2000 & 2004).
The Sample and Data Sources
We use the sample of 31 out of 45 emerging countries for 1994-2014 as consistent poverty data are not available for long time series for a substantial number of countries2. We create a panel data that are averaged over seven three-year non- coinciding intervals. Totally, we have seven intervals in the panel dataset; the first interval represents the averaged data from 1994 to 1996, the next interval represents averaged data from 1997 to 1999 and thus carries on. Following preceding studies (Islam et al., 2017; Khadraoui & Smida, 2012; Seven & Coskun, 2016), we used average data in this study since as per these studies, averaging data solves the missing data problem and levels short run oscillations and this dataset is also apposite for growth models. Several studies use three-year, four-year or five-year averages in the data; we use three-year average in this study to increase the number of intervals and fill the missing data.
Moreover, we prefer to average data as the system GMM model applied to this study demands for less periods and larger cross sections in the dataset. The data on poverty are collected from World Bank development indicators. We collected trade data classified by product category from uncomtrade as per SITS-3. The data source of technological progress index value is UNIDO INDSTATS database.
Summary Statistics
Table 1 summaries the major statistics of the variables used in the regression analysis such as poverty measures, trade composition variables and other control variables. The results show that there are noteworthy vacillations in poverty level all over the countries. The mean value of poverty HCR is 8.98 and scales from 0 in several countries (for example, Hungary, Lithuania) to 63.5 in Nigeria (in 1994-1996) whereas average income of lowest 20% population ranges from 57.5974 in Nigeria (in 1994-1996) to 7744.319 in the Slovak Republic (in 2006-2008). The summary statistics of trade variables show that agriculture sector constitutes maximum export and import of the emerging economies followed by CIM sector with considerable variances. However, emerging economies enjoy the maximum comparative advantage in LIM sector followed by Agriculture sector with almost equal advantage. Emerging countries has a medium level of technological progress, but it varies significantly across countries with the lowest progress in Nigeria (in 2009-2011) and the highest advancement in China (for the interval 2009-2011). There also exist substantial fluctuations in control variables over the intervals.
| Table 1 Descriptive Statistics |
|||||
| Variable | Observations | Mean | Standard Deviation | Minimum | Maximum |
| Poverty HCR at $1.90 per day | 188 | 8.778 | 12.278 | 0 | 63.5 |
| Average Income of Lowest Quintile (Lowest 20% Population) | 188 | 1607.791 | 1635.287 | 57.597 | 7744.319 |
| Agricultural Import | 188 | 6.82E+09 | 1.12E+10 | 2.35e+08 | 1.10E+11 |
| LIM Import | 188 | 1.02E+10 | 1.37E+10 | 55782424 | 9.34E+10 |
| CIM Import | 188 | 5.86E+10 | 1.18E+11 | 1.17e+09 | 1.18E+12 |
| Service Import | 188 | 2.89E+10 | 4.65E+10 | 8.08e+08 | 3.92E+11 |
| Agricultural Export | 188 | 9.54E+09 | 1.27E+10 | 7907242 | 8.84E+10 |
| Export of LIM | 188 | 1.79E+10 | 5.27E+10 | 1.36e+07 | 5.31E+11 |
| Export of CIM | 188 | 5.45E+10 | 1.10E+11 | 1.81e+08 | 9.76E+11 |
| Export of Service | 188 | 2.44E+10 | 3.85E+10 | 6.05e+08 | 3.11E+11 |
| RCA-Agriculture | 188 | 1.946 | 2.488 | 0.002 | 17.581 |
| RCA-LIM | 188 | 1.891 | 2.523 | 0.006 | 15.416 |
| RCA-CIM | 188 | 0.887 | 0.513 | 0.051 | 3.561 |
| RCA-Service | 188 | 1.005 | 0.505 | 0.125 | 2.559 |
| Technology | 188 | 0.492 | 0.144 | 0.229 | 0.784 |
| GDP Growth | 188 | 4.176 | 3.607 | -15.044 | 15.844 |
| Unemployment | 188 | 8.519 | 4.189 | 0.73 | 18.729 |
| Inflation CPI | 188 | 19.502 | 67.176 | 0.0707 | 697.570 |
Note: All variables averaged over a three-year period. Common samples are used to calculate descriptive statistics
Econometric Methodology
The empirical studies on trade-poverty nexus are extremely perceptive to the selection of econometric techniques and assumptions (Santos-Paulino, 2012). Problems of endogeneity and omitted variable bias are the two key challenges in estimating the effect of trade on poverty (Hertel & Reimer, 2005). In their review paper, Winters and Martuscelli (2014) argued that although instrumental variable (IV) model is a frequently used technique that can address endogeneity issues several studies question the application of IV approach to solve the problem of endogeneity to examine trade-poverty linkage (Bazzi & Clemens, 2013; Deaton, 2009). Considering these issues, we applied dynamic panel data model to address the above-mentioned issues. We run the following basic regression equation:

Where, y indicates log of poverty HCR/AILQ. yi,t-yi,t-1 is the first-differenced value of the dependent variables and it measures the growth of the variables. yi,t-1 is the first lag of the dependent variables that represents persistence of variables. TCi,t indicates the trade composition variables of the ith country at period t and Xi,t represents the control variables used in the regression equation such as inflation-CPI rate; economic growth; technological progress; and unemployment. Finally, μi indicates unobserved country-specific effects d φi,t is the error term.
The study applies system GMM approach which is the augmented version of GMM outlined by Arellano and Bover (1995) fully developed by Blundell and Bond (1998). This method provides a consistent and robust estimate by solving endogeneity and heteroscedasticity problems in the data sets and eliminating omitted variable. We applied Hansen test to inspect instruments’ ve overall validity as the validity of GMM estimator is highly subject to the validity of the instruments. We checked autocorrelation using the Arellano-Bond test that has a null hypothesis that there is no serial correlation in the error term of the differenced equation at order 1 (AR1) and order 2 (AR2). AR (2) carries more importance than AR1 as AR (2) identifies serial correlation in level. Higher p-value is expected for better model as it accepts the null hypothesis of no autocorrelation.
Regression Results and Analysis
Table 2 summarizes the regression results of sectorial trade and poverty HCR at the poverty line at $1.90 per day. The study result indicates that both export and import reduce poverty in emerging economies while total export has a higher impact on reducing poverty compared to total import. In the case of sector-wise analysis, export and import of different sectors are negatively associated with extreme poverty and the association is statistically significant. It implies that export and import of all sectors significantly reduces extreme poverty in the emerging economies. e v ce sect ’s exports have a higher impact on poverty among all four sectors and followed by the agricultural sectors. In the case of import, agricultural plays the highest significant role in poverty reduction followed by labour-intensive manufacturing sector’s import.
| Table 2 Sectoral Trade Composition and Poverty Hcr |
||||||||||
| Dependent Variable: Poverty HCR at $1.90 per day | ||||||||||
| Lag of HCR | -0.048 | -0.048 | -0.028 | -0.047 | -0.057 | -0.039 | -0.039 | -0.053 | -0.041 | -0.035 |
| Total Export | -0.214** | |||||||||
| Agriculture Export | -0.186** | |||||||||
| LIM Export | -0.130* | |||||||||
| CIM Export | -0.118** | |||||||||
| Service Export | -0.192* | |||||||||
| Total Import | -0.124* | |||||||||
| Agriculture Import | -0.231*** | |||||||||
| LIM Import | -0.192** | |||||||||
| CIM Import | -0.127* | |||||||||
| Service Import | -0.152* | |||||||||
| Technology | 0.463* | 0.377 | 0.525 | 0.360 | 0.459* | 0.337 | 0.418* | 0.399* | 0.393* | 0.309 |
| GDP Growth | 0.006 | -0.002 | 0.005 | 0.005 | 0.006 | 0.004 | 0.004 | 0.005 | 0.006 | 0.003 |
| Inflation CPI | -0.001*** | -0.002*** | -0.001*** | -0.001*** | -0.001*** | -0.001*** | -0.001*** | -0.001*** | -.001*** | -.001*** |
| Unemployment | 0.018*** | 0.018*** | 0.023*** | 0.023*** | 0.020*** | 0.021*** | 0.017*** | 0.018*** | 0.021*** | 0.019*** |
| Constant | 1.806 | 1.388* | 0.699 | 0.736 | 1.453 | 0.887 | 1.76*** | 1.429* | 0.839 | 1.140 |
| Observations Groups Instruments Hansen p-value AR (2) |
164 31 24 0.416 0.122 |
164 31 24 0.185 0.150 |
164 31 24 0.460 0.110 |
164 31 24 0.506 0.119 |
164 31 24 0.370 0.113 |
164 31 24 0.621 0.118 |
164 31 24 0.631 0.114 |
164 31 24 0.373 0.129 |
164 31 24 0.806 0.119 |
164 31 24 0.379 0.121 |
Note: The table summarizes the estimated coefficients of system GMM regression results. *, ** and *** denote significance level at the 10%, 5% and 1%, respectively
The study result supports several theoretical justifications. As emerging economies are endowed with abundant labour export in any sector increases employment which in turn reduces poverty. Higher impact of service and agriculture sector on poverty reduction shows that these sectors are more pro-poor compared to other two sectors. The impact of import of all sectors on reducing poverty indicates that import of goods increases e people’s choice t buy and trade openness through tariff reduction upsurges the earnings of the poor and alleviates poverty. The highest impact of the agricultural sector on poverty infers that they are more pro-poor compared to other sectors.
According to the regression results, technological progress has a positive association with extreme poverty which means higher technological development increases abject poverty in the emerging economies. The result is consistent with the theoretical viewpoint that higher technological progress increases the demand for skilled labour and reduces demand for unskilled labour. As a significant share of labour in developing economies is unskilled and low skilled, technological development increases the wage gap between skilled and unskilled labour and consequently increased poverty. Inflation has a significant negative relation with poverty HCR which means higher inflation reduces extreme poverty. This association is also supported by the regression result of Table 3 which suggests that inflation upturns the average income of poorest 20% population in emerging countries. Higher unemployment rate significantly increases the extreme poverty whereas economic growth has little impact on poverty HCR.
| Table 3 Sectoral Trade Composition and Average Income of Lowest Quintile (Ailq) |
||||||||||
| Dependent Variable: Average Income of Lowest Quintile (Lowest 20% Population) | ||||||||||
| Lag AILQ | 0.015 | 0.031 | 0.035 | 0.009 | 0.009 | 0.017 | 0.031 | -0.002 | 0.011 | 0.030 |
| Total Export | 0.08*** | |||||||||
| Agriculture Export | 0.043* | |||||||||
| LIM Export | 0.052 | |||||||||
| CIM Export | 0.064** | |||||||||
| Service Export | 0.088* | |||||||||
| Total Import | 0.100** | |||||||||
| Agriculture Import | 0.084** | |||||||||
| LIM Import | 0.111** | |||||||||
| CIM Import | 0.095** | |||||||||
| Service Import | 0.098** | |||||||||
| Technology | -0.24*** | -0.185*** | -0.281** | -0.234*** | -0.264*** | -0.261*** | -0.212*** | -0.243*** | -0.282*** | -0.225*** |
| GDP Growth | 0.0181*** | 0.020*** | 0.018*** | 0.017*** | 0.018*** | 0.019*** | 0.019*** | 0.018*** | 0.018*** | 0.020*** |
| Inflation CPI | 0.0006 | 0.0005 | 0.0002 | 0.0004 | 0.0004 | 0.0007 | 0.0008 | 0.0009 | 0.0007 | 0.0008 |
| Unemployment | -0.005 | -0.006* | -0.007* | -0.006* | -0.005* | -0.004 | -0.004 | -0.003 | -0.004 | -0.004 |
| Constant | -0.80** | -0.361 | -0.402 | -0.507* | -0.734* | -0.96** | -0.748* | -0.92** | -0.84** | -0.94** |
| Observations Groups Instruments Hansen p-value AR (2) |
164 31 33 0.321 0.155 |
164 31 33 0.348 0.277 |
164 31 33 0.390 0.218 |
164 31 33 0.308 0.155 |
165 31 33 0.352 0.244 |
164 31 33 0.320 0.235 |
164 31 33 0.317 0.199 |
164 31 33 0.337 0.194 |
164 31 33 0.328 0.239 |
164 31 33 0.340 0.238 |
The regression results of table 4 show that export and import in aggregate increase the average income of lowest quintile (AILQ). In the case of sector-wise export, the service sector has a highest positive effect on AILQ. As per study result, LIM export does not increase the AILQ significantly which indicates that growing export in the LIM sector does not upsurge the wage of the workers as this sector employs a significant portion of unskilled workers in developing countries. Import of four sectors increases the AILQ and labour-intensive manufacturing import has the maximum positive effect. This result is supported by the framework of Davis and Mishra (2007) that if the tariff is reduced for the imported goods that people buy, the poor gain from trade.
| Table 4 Revealed Comparative Advantage (Rca), Poverty and Average Income of Lowest Quintile |
||||||||
| Dependent Variable: Poverty HCR at $1.90 per day | Dependent Variable: Average Income of Lowest Quintile | |||||||
| Lag of Dependent Variable | -0.032 | -0.066 | -0.032 | -0.020 | 0.053*** | 0.025 | 0.041* | 0.034 |
| RCA-Agriculture | 0.001 | 0.002 | ||||||
| RCA-LIM | 0.044* | -0.002 | ||||||
| RCA-CIM | 0.066 | -0.004 | ||||||
| RCA-Service | 0.086 | 0.0007 | ||||||
| Technology | 0.163 | 0.077 | 0.218 | 0.102 | -0.13** | -0.14** | -0.14** | -0.14** |
| GDP Growth | 0.003 | 0.003 | 0.004 | 0.005 | 0.02*** | 0.016*** | 0.018*** | 0.016*** |
| Inflation CPI | -0.001*** | -0.001*** | -0.001*** | -0.001*** | 0.001 | -0.0003 | 0.0004 | -0.0002 |
| Unemployment | 0.027*** | 0.029*** | 0.028*** | 0.026*** | -0.008*** | -0.008*** | -0.008*** | -0.008** |
| Constant | -0.424** | -0.460*** | -0.518** | -0.478*** | -0.024 | 0.103 | 0.044 | 0.071 |
| Observations Groups Instruments Hansen test p-value AR (2) |
164 31 24 0.413 0.112 |
164 31 24 0.301 0.140 |
164 31 24 0.093 0.111 |
165 31 24 0.253 0.134 |
164 31 33 0.536 0.163 |
164 31 33 0.392 0.204 |
164 31 33 0.502 0.167 |
164 31 33 0.394 0.194 |
Note: See Table 2. RCA indicates Revealed Comparative advantage
As expected, technological progress has significant negative linkage with an average income of lowest quintile which infers that high technological development reduces AILQ. The theoretical view of this association is that higher technological progress raises the demand as well as the wage of skilled labour but both demand and wage of unskilled labour falls due to technological advances which result in a lower income of the unskilled labour. Both GDP growth and inflation have a positive association with AILQ whereas unemployment significantly reduces AILQ in emerging economies.
The regression results of RCA of each sector and poverty measures suggest that comparative advantage in all sectors has a positive relationship with poverty HCR which specifies that high revealed comparative advantage in each sector increases poverty HCR. The higher comparative advantage in agricultural and service sectors increases AILQ, where RCA in LIM and CIM sector reduce AILQ. However, all of these associations are not statistically significant except for the case of RCA in the labor-intensive manufacturing sector and poverty HCR.
Concluding Remarks
Since the last decade of the twentieth century, the global economy has been integrated and most of the countries have opened the door to the international market. Both volume and value of the international trade in the world economy have been increasing and trade plays a vital role in the development of the developing economies. International trade also brings fundamental qualitative changes between and within countries. However, there is still severe controversy that whether growing economic integration benefits the poor or they are by-passed. This issue has attracted the researchers and academicians as one of the critical research focuses for the last two decades.
A vast study focused on identifying whether growing trade liberalization reduces poverty in the developing countries. Several empirical studies identified different channels through which trade affect poverty such as growth, technological progress, prices of goods and factors of production, institutional development and mobility of factors across borders, changes in global market structures and flow of information. The most crucial and common channel is trade-growth-poverty nexus. However, some studies identified that sectoral composition of trade profoundly affects economic growth as well as several other channels of trade-poverty linkage. This study examines the effects of the sectoral composition of trade on poverty in the emerging countries.
The results of the study suggest that in aggregate the effect of export on reducing poverty is higher than that of import. Export and import of all the four sectors significantly reduce poverty. However, among all four sectors, service sector’s export play the highest impact in reducing poverty, whereas, in the case of import, the agricultural sector has the maximum influence on poverty reduction. All four sectors’ export and import s increase AILQ. Service export has the highest impact on increasing the AILQ whereas labour-intensive manufacturing import has the maximum influence in increasing AILQ. However, the study results also suggest that RCA of each sector positively associated with poverty HCR. RCA in agriculture and service reduces increases AILQ whereas RCA in labour-intensive manufacturing and capital-intensive manufacturing sectors reduces AILQ. However, RCA of each sector is not significantly associated with poverty and AILQ.
The study offers significant policy decisions. According to the study results, agricultural and service sector play significant role in reducing poverty and increasing AILQ although emerging economies enjoy maximum comparative advantage in the LIM sector. Both export and import of all sectors are significantly associated with reduced poverty and higher income of the poorest people while the comparative advantage of these sectors does not have a substantial linkage with poverty and income of the poor. This study has some drawbacks. The data for poverty is not available for several emerging countries and there are also missing data problems. Moreover, it is also tricky to precisely differentiate between LIM and CIM products and we apply the generalized rule to distinguish between these two sectors. The availability of consistent data on poverty as well as trade composition will open the door for more comprehensive research in this field.
Appendices
Appendix A: Classification of products as per SITC rev. 3 (Sectorial composition of trade)
SITC number of Labour-Intensive Manufacturing products as per SITC rev. 3
61, 62, 63, 64, 65, 66, 69, 81, 82, 83, 84, 85, 88, 89
SITC number of Capital-intensive Manufacturing products as per SITC rev. 3
31, 32, 33, 34, 35, 51, 52, 53, 54, 55, 56, 57, 58, 59,71, 72, 73, 74, 75, 76, 77, 78, 79, 67, 68, 87, 891, 27, 28
SITC number of Agriculture products as per SITC rev. 3
0, 1, 2, 4
Appendix B: Country Samples
Argentina, Bahrain, Bangladesh, Brazil, Bulgaria, India, Indonesia, China, Chile, Colombia, Czech Republic, Egypt, Estonia, Hungary, Iran, Iraq, Jordan, Kuwait, Kazakhstan, Latvia, Lithuania, Malaysia, Mauritius, Mexico,Nigeria, Oman, Pakistan, Peru, Philippines, Poland, Qatar, Romania, Russia, Saudi Arabia, Slovakia, South Africa, Sri Lanka, Sudan, Thailand, Tunisia, Turkey, United Arab Emirates, Ukraine, Venezuela, Vietnam.
Note: The underlined countries are left out from analysis due to the lack of poverty data for long time series. The list of emerging economies and their classification was given as per BBVA Research list as of March 2014. Source: Wikipedia access date November 22, 2016.
Note: The underlined countries are left out from analysis due to the lack of poverty data for long time series. The list of emerging economies and their classification was given as per BBVA Research list as of March 2014. Source: Wikipedia access date November 22, 2016.
End Notes
1. The SITC number of agriculture, labour-intensive and capital-intensive products is provided in Appendix A.
2. The country sample is given in Appendix B.
References
- Aditya, A. & Acharyya, R. (2013). Export diversification, composition and economic growth: Evidence from cross-country analysis. Journal of International Trade & Economic Development, 22(7), 959-992.
- Arellano, M. & Bover, O. (1995). Another look at the instrumental variable estimation of error-components models. Journal of econometrics, 68(1), 29-51.
- Atkinson, A.B. & Brandolini, A. (2010). On analyzing the world distribution of income. The World Bank Economic Review, 24(1), 1-37.
- Balat, J.F. & Porto, G.G. (2007). Globalization and complementary policies: Poverty impacts on rural Zambia Globalization and Poverty: University of Chicago Press.
- Basu, K. (2003). Globalization and marginalization: Re-examination of development policy. Bureau for Research in Economic Analysis of Development–BREAD–Working Paper(026).
- Bazzi, S. & Clemens, M.A. (2013). Blunt instruments: Avoiding common pitfalls in identifying the causes of economic growth. American Economic Journal: Macroeconomics, 5(2), 152-186.
- Bergh, A. & Nilsson, T. (2014). Is Globalization Reducing Absolute Poverty. World Development, 62, 42-61.
- Bhagwati, J. & Srinivasan, T. N. (2002). Trade and poverty in the poor countries. The American Economic Review, 92(2), 180-183.
- Blundell, R. & Bond, S. (1998). Initial conditions and moment restrictions in dynamic panel data models. Journal of econometrics, 87(1), 115-143.
- Busse, M. & Spielmann, C. (2006). Gender inequality and trade. Review of International Economics, 14(3), 362-379.
- Castilho, M., Menéndez, M. & Sztulman, A. (2012). Trade liberalization, inequality and poverty in Brazilian states. World Development, 40(4), 821-835.
- Culpeper, R. (2005). Approaches to globalization and inequality within the international system: United Nations Research Institute for Social Development.
- Davis, D.R. & Mishra, P. (2007). Stolper-Samuelson is dead: And other crimes of both theory and data Globalization and poverty: University of Chicago Press.
- Deaton, A.S. (2009). Instruments of development: Randomization in the tropics and the search for the elusive keys to economic development: National Bureau of Economic Research.
- Dhongde, S. & Minoiu, C. (2013). Global poverty estimates: A sensitivity analysis. World Development, 44, 1-13.
- Dollar, D. & Kraay, A. (2002). Growth is Good for the Poor. Journal of Economic Growth, 7(3), 195-225.
- Dollar, D. & Kraay, A. (2004). Trade, growth and poverty. The Economic Journal, 114(493).
- Easterly, W. (2006). Globalization, prosperity and poverty. Ann Harrison, editor, Globalization and Poverty, forthcoming, University of Chicago Press for NBER.
- Easterly, W. & Fischer, S. (2001). Inflation and the Poor. Journal of Money, Credit and Banking, 160-178.
- Frankel, J.A. & Romer, D. (1999). Does trade cause growth? American economic review, 379-399.
- French, S. (2014). The Composition of Trade Flows and the Aggregate Effects of Trade Barriers. Journal of international Economics, 98, 114-137.
- Ghatak, S., Milner, C. & Utkulu, U. (1997). Exports, export composition and growth: Cointegration and causality evidence for Malaysia. Applied Economics, 29(2), 213-223.
- Goldberg, P.K., & Pavcnik, N. (2004). Trade, inequality and poverty: What do we know? Evidence from recent trade liberalization episodes in developing countries: National Bureau of Economic Research.
- Greenaway, D., Morgan, W. & Wright, P.W. (2006). Exports, export composition and growth. Journal of International Trade & Economic Development, 8(1), 41-51.
- Hachicha, N. (2001). Exports, Export Composition And Growth: A Simultaneous Error-Correction Model For Tunisia. International Economic Journal, 17(1), 101-120.
- Harrison, A. (2006). Globalization and poverty: National Bureau of Economic Research.
- Hertel, T.W. & Reimer, J.J. (2005). Predicting the poverty impacts of trade reform. Journal of International Trade & Economic Development, 14(4), 377-405.
- Islam, M.M., Li, Z. & Fatema, F. (2017). The effects of sectoral trade composition on inequality: Evidence from emerging economies. Asian Journal of Empirical Research, 7(8), 202-224.
- Kanbur, R. (1999). Income distribution implications of globalization and liberalization in Africa: Department of Agricultural, Resource and Managerial Economics, Cornell University.
- Kanbur, R. (2001). Economic policy, distribution and poverty: The nature of disagreements. World Development, 29(6), 1083-1094.
- Kanbur, R. (2005). Growth, inequality and poverty: Some hard questions. Journal of International Affairs, 223-232.
- Khadraoui, N. & Smida, M. (2012). Financial development and economic growth: Static and dynamic panel data analysis. International Journal of Economics and Finance, 4(5), 94.
- Kiskatos, K. & Sparrow, R. (2015). Poverty, labour markets and trade liberalization in Indonesia. Journal of development Economics, 117, 94-106.
- Kletzer, L.G. (2000). Trade and job loss in us. Manufacturing, 1979-1994 The impact of international trade on wages: University of Chicago Press.
- Kletzer, L.G. (2004). Trade‐related Job Loss and Wage Insurance: A Synthetic Review. Review of International Economics, 12(5), 724-748.
- Krueger, A.O. (1983). Trade and employment in developing countries: Synthesis and conclusions: University of chicago Press.
- L'Huillier, B.M. (2016). Has Globalization Failed to Alleviate Poverty in Sub-Saharan Africa? Poverty & Public Policy, 8(4), 368–386. doi: 10.1002/pop4.158
- Lall, S. (2000). The Technological structure and performance of developing country manufactured exports, 1985‐98. Oxford development studies, 28(3), 337-369.
- Le Goff, M. & Singh, R.J. (2014). Does trade reduce poverty? A view from Africa. Journal of African Trade, 1(1), 5-14.
- Lewer, J.J. & Den Berg, H.V. (2003). Does trade composition influence economic growth? Time series evidence for 28 OECD and developing countries. Journal of International Trade & Economic Development, 12(1), 39-96.
- Mazumdar, J. (1996). Do Static Gains from Trade Lead to Medium-Run Growth? Journal of Political Economy, 104(6), 1328-1337.
- Milanovic, B. (2002). Can we discern the effect of globalization on income distribution? Evidence from household budget surveys.
- Naranpanawa, A., Bandara, J.S. & Selvanathan, S. (2011). Trade and poverty nexus: A case study of Sri Lanka. Journal of Policy Modeling, 33(2), 328-346.
- Nissanke, M. & Thorbecke, E. (2006). Channels and policy debate in the globalization–inequality–poverty nexus. World Development, 34(8), 1338-1360.
- Prasad, E., Rogoff, K., Wei, S.J. & Kose, M.A. (2005). Effects of financial globalization on developing countries: Some empirical evidence India’s and China’s Recent Experience with Reform and Growth (pp. 201-228): Springer.
- Ravallion, M. (2003). The debate on globalization, poverty and inequality: Why measurement matters. International Affairs, 79(4), 739-753.
- Ravallion, M. & Datt, G. (1999). When Is Growth Pro-Poor? Evidence from the Diverse Experiences of India’s States’, World Bank Policy Research Working Paper No 2263. Paper presented at the India’, Harvard University, Centre for International Development Working Paper No 88.
- Rodrik, D. (1997). Has globalization gone too far? California Management Review, 39(3), 29-53.
- Rodrik, D. (1998a). Globalisation, social conflict and economic growth. The World Economy, 21(2), 143-158.
- Rodrik, D. (1998b). Why do more open economies have bigger governments? Journal of Political Economy, 106(5), 997-1032.
- Rodrik, D. (2004). Getting institutions right. CESifo DICE Report, 2(2004), 10-15.
- Sachs, J.D., Warner, A., Åslund, A. & Fischer, S. (1995). Economic reform and the process of global integration. Brookings papers on economic activity, 1995(1), 1-118.
- Sala-i-Martin, X. (2002a). The disturbing "rise" of global income inequality: National Bureau of Economic Research.
- Sala-i-Martin, X. (2002b). The world distribution of income (estimated from individual country distributions): National Bureau of Economic Research.
- Sala-i-Martin, X. (2006). The world distribution of income: Falling poverty and convergence, period. The Quarterly Journal of Economics, 121(2), 351-397.
- Santos-Paulino, A.U. (2012). Trade, income distribution and poverty in developing countries: A survey: United Nations Conference on Trade and Development.
- Seven, U. & Coskun, Y. (2016). Does financial development reduce income inequality and poverty? Evidence from emerging countries. Emerging Markets Review, 26, 34-63.
- Shuaibu, M. (2016). The Effect of Trade Liberalisation on Poverty in Nigeria: A Micro–Macro Framework. International Economic Journal, 1-26. doi: 10.1080/10168737.2016.1221984
- Sindzingre, A.N. (2005). Explaining threshold effects of globalization on poverty: An institutional perspective.
- Thorbecke, W. & Zhang, H. (2009). THE effect of exchange rate changes on China's labour‐intensive manufacturing exports. Pacific Economic Review, 14(3), 398-409.
- Tyers, R., Phillips, P. & Findlay, C. (1987). ASEAN and China exports of labour-intensive manufactures: Performance and prospects. ASEAN Economic Bulletin, 3(3), 339-367.
- Warr, P. (2014). Agricultural liberalization, poverty and inequality: Indonesia and Thailand. Journal of asian Economics, 35, 92-106.
- Williamson, J.G. (2005). Winners and losers over two centuries of globalization Wider perspectives on global development (pp. 136-174): Springer.
- Winters, L.A. & Martuscelli, A. (2014). Trade Liberalization and Poverty: What have we learned in a decade? Annu. Rev. Resour. Econ., 6(1), 493-512.
- Wood, A. (1997). Openness and wage inequality in developing countries: the Latin American challenge to East Asian conventional wisdom. The World Bank Economic Review, 11(1), 33-57.