Research Article: 2022 Vol: 23 Issue: 6S
The Great Depression: An Useful Case Study to Understand the Concepts of Deflationary Spiral and Unconventional Monetary Policy
Mauro Visaggio, University of Perugia
Citation Information: Visaggio, M. (2022). The great depression: an useful case study to understand the concepts of deflationary spiral and unconventional monetary policy. Journal of Economics and Economic Education Research, 23 (S6), 1-14.
Keywords
Great Depression, Deflationary Spiral, Unconventional Monetary Policy.
Abstract
The US business cycle in period 1929-1936 is characterized by the Great Depression. This paper aims, through the analysis of this case of study, to clarify two relevant macroeconomic concepts: deflationary spiral process and unconventional monetary policy. On the one hand, the bursting of the speculative bubble on the stock market, and then the banking system crisis, produce a collapse in the growth rate of the GDP. In front of a neutral fiscal policy and a monetary policy aimed at defending the fixed exchange rate, the non-functioning of the perfect adjustment mechanism of the money wage implies a deflationary spiral so that the recession phase extends from 1929 to 1932. On the other hand, the economic recovery begins in 1933. While the fiscal policy is substantially neutral vice versa, the expansive monetary policy implemented after the abandonment of the fixed exchange rate regime is the decisive key which allows the economy of the USA to emerge from the great depression: the ultra-expansionary monetary policy, even in the presence of a liquidity trap, manages through the phenomenon of reflation to reduce the real interest rate and encourage an increase in private investment. In certain sense, it can be concluded that the monetary policy implemented starting from 1933 is the forerunner of the unconventional monetary policies (i.e., quantitative easing monetary policy) implemented in the first two decades of the present century in various western countries
JEL Classifications
E32, E62, E51, G15, G51.
Introduction
The Great Depression was the deepest and most lasting recession the US economy has ever experienced during a business cycle in the modern era. Furthermore, the dramatic contraction of economic activity in the USA, which began in 1929, spread immediately and with the same avalanche intensity in almost all Western countries. In fact, in the second half of the 1920s and in the first two years of the 1930s, a complex set of factors determined a perfect economic storm which is the Great Depression. This complexity and interweaving of these factors is reflected in the lack of consensus among economists and historians regarding the ultimate causes of the Great Depression. Nonetheless, it seems possible to conclude that at least four major factors played a crucial role in the origin of the Great Depression.
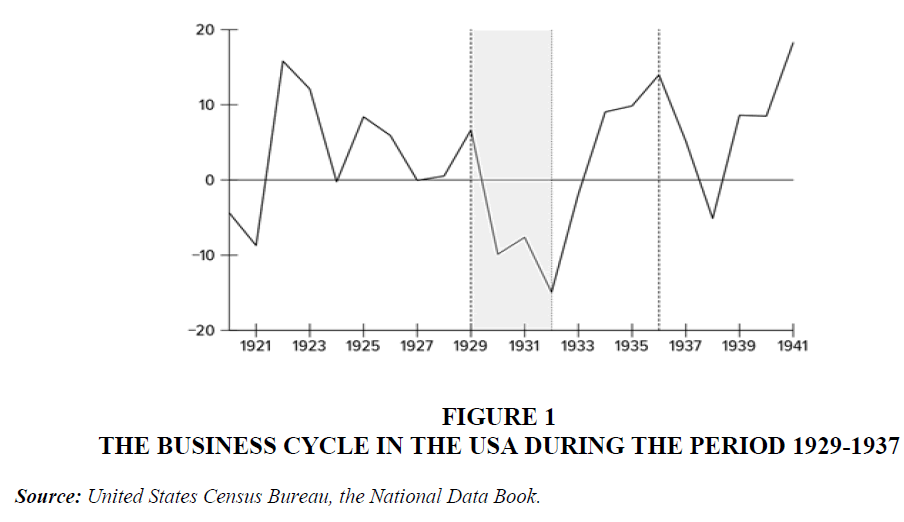
First, some economists have underlined the crucial role of the collapse of the stock market which, by undermining confidence in the American economy, has produced a drastic reduction in consumption and investment (Galbraith, 1954; De Long & Shleifer, 1991; Bernanke, 2000; Romer, 1990; White, 1990). Second, others economists, have stressed the relevant role played by the contagion of fear that results in banking panic in the early 1930s Figure 1.
Figure 1 The Business Cycle in the USA During the Period 1929-1937
Source: United States Census Bureau, the National Data Book.
That has produced many banks to fail and therefore by reducing the loans has produced a decrease in investment (Olney, 1999). Third, others distinguish economists have stressed the role of a “wrong” contractionary monetary policy that has implied an increase in real interest rate and therefore a significant decrease in investment (Friedman & Schwartz, 2008a; Bernanke, 2002; Galbraith, 1954; McCallum, 1990; Hamilton, 1987; Temin, 1976; Wicker, 1965). Fourth, another group of researchers has pointed out the relevance of the constraint of gold standard regime that forcing la FED to increase interest rate in the second five-year period of the 1920s in order to counteract the trade imbalances has depressed consumption and investment (Eichengreen, 1996; Eichengreen & Temin, 1976; Temin & Toniolo, 2008). Fifth and finally another group of economists has stressed the role of the Smoot-Hawley Tariff Act promulgated in 1930 that by introducing tariffs on many industrial and agricultural goods has resulted in a reduction of global trade and ultimately a decrease of output (Krugman, 2009; Whaples, 1995; Eichengreen & Irwin, 2009).
The objective of this paper is twofold. First of all, the paper aims to retrace the different phases and interpretations of the origin of the Great Depression through the presentation of the trend of the main macroeconomic variables. Secondly, the paper aims to clarify two important concepts of macroeconomic theory through the study of the events that occurred during the 1930s: the genesis and development of the inflationary spiral and the implementation of an unconventional monetary policy to support economic growth in the presence of a liquidity trap (Hamilton, 1988).
Us Businnes Cycle During 1929-1937
The economic crisis of 1929—i.e. the start of Great Depression—comes at the end of a decade of euphoria, light-heartedness and strong economic growth: the Roaring Twenties Figure 2.
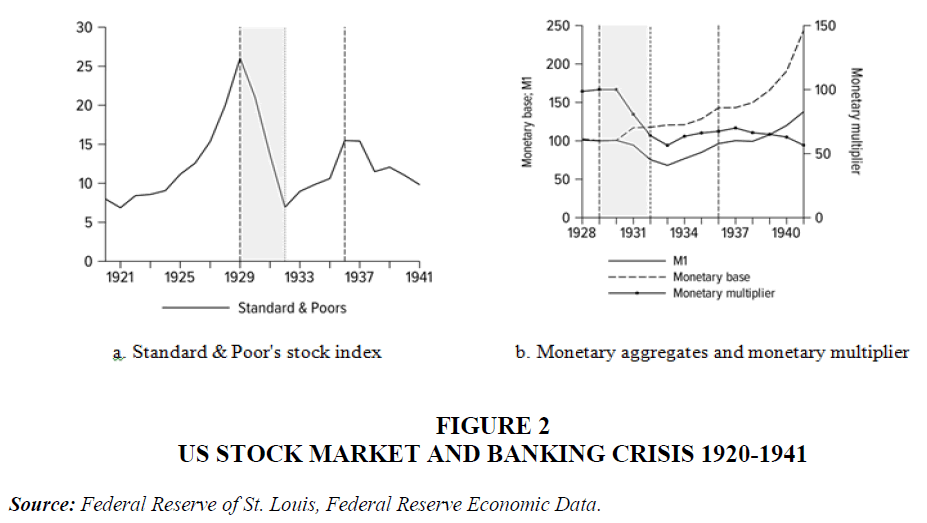
Figure 2 US Stock Market and Banking Crisis 1920-1941
Source: Federal Reserve of St. Louis, Federal Reserve Economic Data.
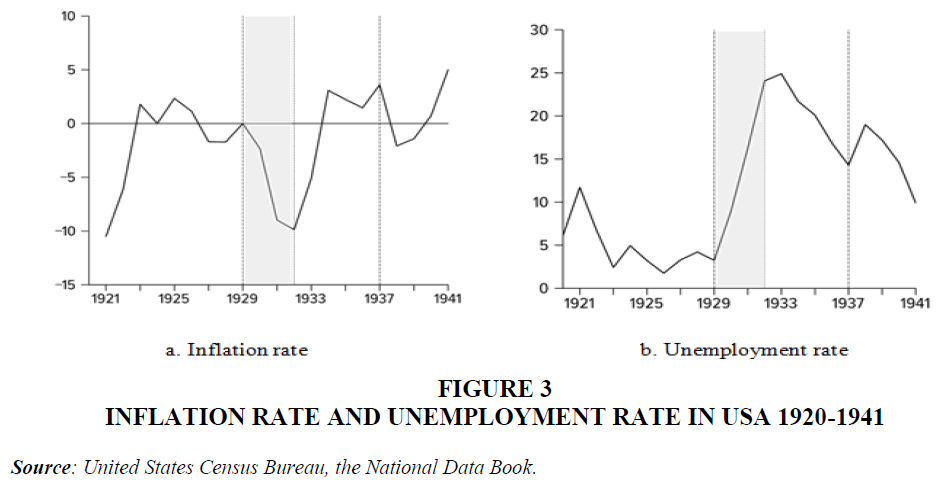
This decade has been a period of economic growth and widespread prosperity, driven by the recovery following the post-war devastation, by the deferral of spending, the boom in the construction sector and the widespread diffusion of innovative consumer goods figure 3.The spirit of the roaring twenties has characterized itself for a general feeling of novelty associated with modernity and from a break with the tradition favored by the pervasive diffusion among the great part of the population of new technologies and inventions such as cars, cinemas and radio. The intense dynamism of the time spread in all sectors of society and, in a particular way, in the field of fashion and music. From an economic point of view, the macroeconomic picture of the twenties of the last century is particularly positive: figure 1 shows that the GDP growth rate in the USA remains, on average, high, reaching a peak of 16% in 1922; graph (b) of figure 4 shows how for the unemployment rate fluctuates at low levels for most of the decade; the graph(a) of the figure 4 shows how the inflation rate stabilizes at low values and, finally, graph (a) of figure 2 shows how the euphoria of the decade spills over into the market where the stock index increases from 7 points in 1921 to 24 points in 1928.
Figure 3 Inflation Rate and Unemployment Rate in USA 1920-1941
Source: United States Census Bureau, the National Data Book.
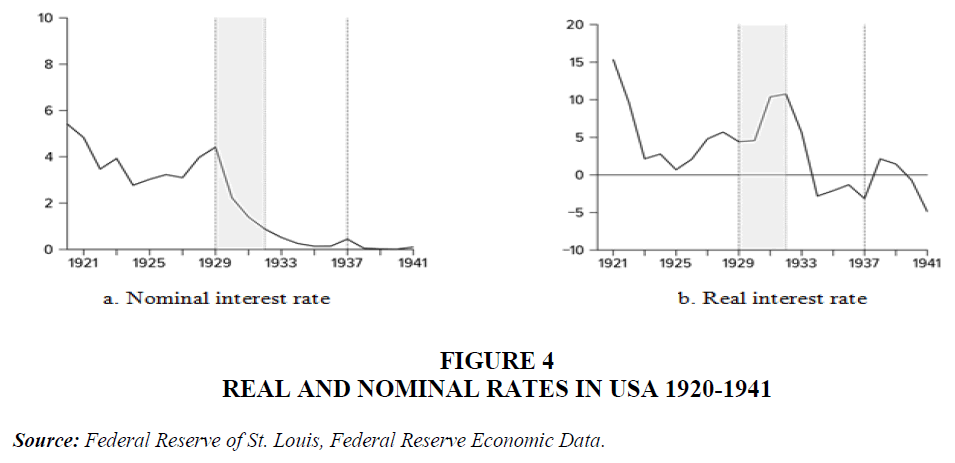
Figure 4 Real and Nominal Rates in USA 1920-1941
Source: Federal Reserve of St. Louis, Federal Reserve Economic Data.
The economic crisis of 1929 marks the start of the US business cycle over the period 1929-1937. This business cycle is often identified with the deepest and most prolonged recession that Western economic systems have ever experienced in the modern age and can be divided (as indeed all business cycles) into two phases: the phase of the Great Depression and the phase of the recovery.
The Great Depression Phases
The “Great Depression” phase extends from August 1929 to March 1932. Figure 1 shows that in 1929 the growth rate of real GDP reaches a maximum point of about 6% so that, soon after, the economy US enters a new business cycle. In the four-year period 1929-1932 a particularly deep recession develops (which, precisely because of its intensity, is defined as the great depression
Great depression the GDP undergoes a sharp contraction, reducing by -9.8% in 1930, by -7.9% in 1931 and, finally, by -16.2% in 1932. Between 1929 (high point in August 1929) and 1932 (low point in March 1932), real GDP fell by about -30%, going, in absolute terms, from 203 to 141 billion dollars (base year = 1958). The dramatic nature of GD is also demonstrated by the volatility of the business cycle: the difference between the maximum point of 1929 and the minimum point of 1932 is about 30 percentage points (Bernanke & James, 1990).
Stock Market Crash of 1929
The occurrence of the first negative disturbance i.e., the US stock market crash is often associated, if not identified entirely, with GD. Graph (a) of Figure 2 shows that between 1921 and 1929 the Standard & Poor's 500 stock index (the composite index of the 500 leading American stocks) recorded an increase of about 250%, going from 7 to 26 points (where the greatest increase is concentrated in the three-year period 1927-29 when the index increases from 12.5 to 26.9 points). The rise in the stock index comes supported, in large part, by the use of credit by speculators. In fact, the latter, believing that share prices were destined to increase in the immediate future, borrowed from banks to support the purchase of shares as they were convinced that they make a profit from speculative activity.
In early 1928, the Federal Reserve (FED), deeming that speculation was pushing share prices to unjustified and harmful levels for the stability and solidity of the economic system due to the consequent reduction of bank lending to businesses, decides to implement a restrictive monetary policy. The nominal interest rates are raised with the aim of restricting credit from banks to speculators and, therefore, to curb the rise in stock indexes. In the 1929 the financial situation plummets. The FED continues and intensifies monetary policy restrictive by further increasing the nominal interest rate thus favoring the belief among speculators that the prices of shares had by now reached levels not justified by the discount of future profits (which are reflected, as is well known, in the stock price.
In addition to the abrupt change in expectations on the future course of shares, another factor which makes the situation on the stock market even more critical consists in the increase in interest paid on the debt contracted for the purchase of shares. The change in expectations and speculators' fear of falling into a state of insolvency generate a first wave of panic which pushes them to sell their shares massively on October 24, 1929 ("Black Thursday"). Within a few days i.e., on the 29th of the same month ("Black Tuesday"), a second wave of sales marks the definitive beginning of the bursting of the speculative bubble which has been feeding for over a decade.
Bank System Crash
The stock market crisis helps to trigger the second negative perturbation that hit the US economic system in the first months of 1931, i.e., the banking system crisis, for two basic reasons. First, the banking system crisis helps to strengthen, among economic agents, a negative state of expectations on the future trend of the economy; secondly, it pushes the speculators who had gotten into debt in order to finance the purchase of the shares into a situation of insolvency and, consequently, it fuels the expectation among savers that the banks were no longer able to honor the commitments undertaken and that is, to promptly transform deposits into currency. Added to this is the fact that the start of the deflationary phase starting from 1930 made the debt position of various companies suffer and, consequently, made the structure of the banking system even more fragile.
Starting from the first months of 1931, and until March 1933, the combination of all these adverse events generates waves of banking panic which induce savers to withdraw their bank deposits massively (the so-called "bank run"). The risk that the insolvency of businesses and speculators would lead the banks themselves into a situation of insolvency pushes savers achievement of the internal objective (i.e., increase in income).
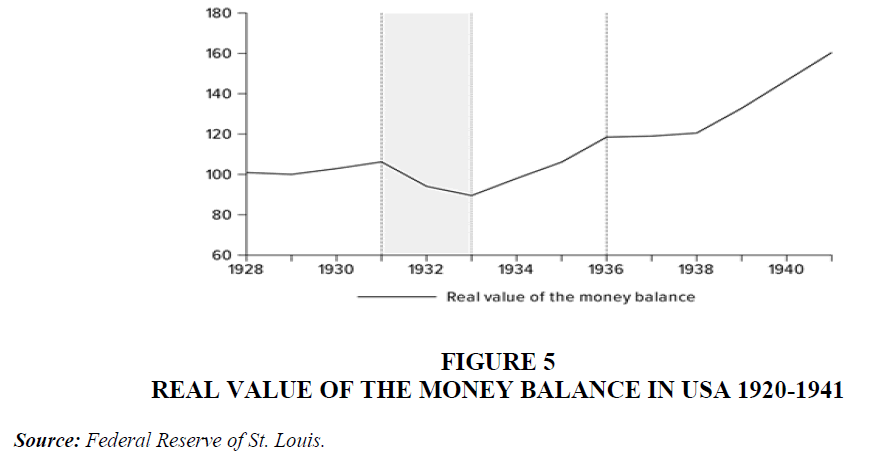
In the opposite case, i.e. if the FED had created an amount of monetary base in excess of that consistent with the external objective, a balance of payments deficit would have been created which, sooner or later, would have led to a devaluation of the dollar. Furthermore, it is very probable that such behavior by the FED would have favored a speculative attack on the dollar by those economic agents who, in anticipation of a forthcoming and imminent devaluation of the dollar, would have anticipated the event by transferring gold from the USA to resulting in an immediate worsening of the balance of capital movements and thus forcing the Fed to devalue the exchange rate Figure 5.
Real Effects of the Stock Market and Banking System Crisis
The two perturbations described above activate a set of effects that generate a highly negative macroeconomic picture. Limiting ourselves to the description of the trend of the main variables that characterize the phase of the US business cycle in the period 1929-1932, we can observe the following stylized facts.
Drastic decrease in aggregate demand and GDP growth rate: Actually, the consequence of the stock market crash in the USA in 1929 consists in the worsening of expectations on the future trend of economic activity which, in turn, produces two effects on effective demand: the reduction of the exogenous component of investments due to the worsening of expected future profits; the contraction of the exogenous component of consumption resulting both from the worsening of expected future incomes and from a negative wealth effect due to the contraction of the stock index.
Deflationary spiral: The reduction in the price level produces two effects on aggregate demand: firstly, the increase in the real interest rate following deflation reduces spending on private investments, while secondly, the Keynes effect attributable to the increase in monetary balances again following the deflation also stimulates aggregate demand. Let's see how the two effects played out during the Great Recession.
In the first place, the price level, after having remained substantially stable in the 1920s, drops violently, starting a particularly intense deflationary spiral: the deflation rate (negative change in the price level) goes from 2.5 in 1930 to -10.3 in 1932 (minimum point) to then go back up to -5.1 in 1933 (see graph (a) of figure 3). The nominal interest rate on three-month government bonds begins to progressively decrease until it is completely zero starting from 1935 (see graph (a) of figure 4). The high deflation rate implies that during the recession the real interest rate (ex-post) reaches significantly high positive levels: 4.57 in 1930; 10.38 in 1931 and 10.75% in 1932 (see graph (b) of figure 4).
Secondly, as is known, deflation increases or should increase, through the Keynes effect, effective demand through the increase in money balances, the reduction of the real interest rate and finally the stimulation of investment. In the recession 1930-32, however, the Keynes effect—measured by the change in monetary balances, i.e. by the change in the ratio between the supply of nominal money and the general level of prices—is extremely weak (in 1931) and even strongly negative in 1932. In fact, when we study the effect of deflation on money balances we assume that the money supply remains constant. In this phase, however, as we have seen, the reduction in the monetary multiplier prevails over the weak increase in the monetary base with the consequent reduction of the money supply. The result of the two effects is that, as can be seen from figure 5, the second effect prevails over the first with the consequence that the monetary balances, after registering an increase in 1931, decrease both in 1932 and in the following year (for simplicity we assume that in the two-year period 1931- 1932 the Keynes effect is negligible).
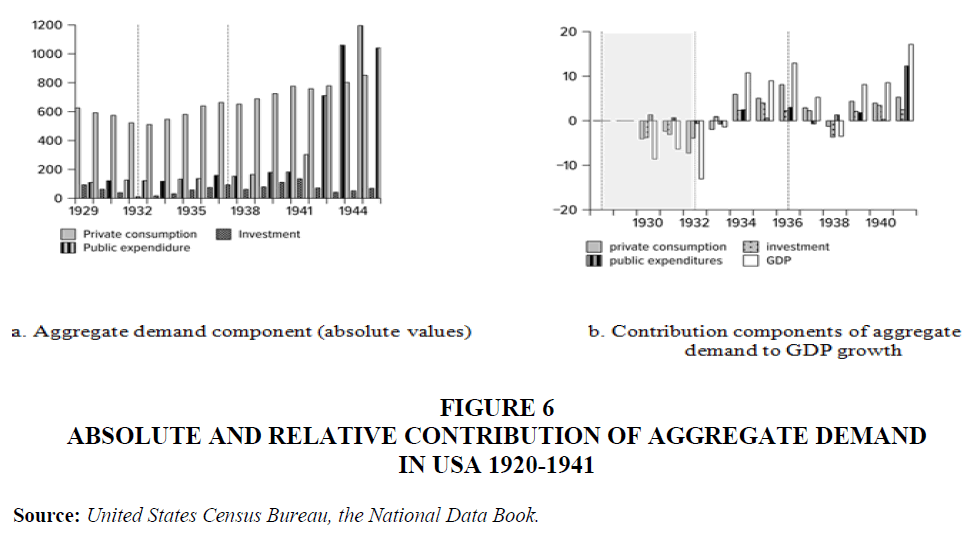
In conclusion, the reduction in consumption and investment produces an intense reduction in aggregate demand which, in turn, produces a violent reduction in the GDP growth rate. Graph (b) of Figure 6—which shows the breakdown of the growth rate of real GDP according to the contribution of each of them—clearly shows that the sharp reduction in the growth rate of GDP is entirely attributable to the contraction of consumption and investment.
Figure 6 Absolute and Relative Contribution of Aggregate Demand In USA 1920-1941
Source: United States Census Bureau, the National Data Book.
In fact, as can be seen from the graph, consumption fell by 4.1%, -2.4%, and -7.3% while investments fell by -3.8%, -3.1%, and - 3.9% respectively in 1930, 1931 and 1932. As a result, as we saw at the beginning, GDP fell by -9.8% in 1930, by -7.9% in 1931 and finally by -16 2% in 1932 so that between 1929 and 1932 the cumulative reduction in the growth rate of GDP is about 30 percentage points.
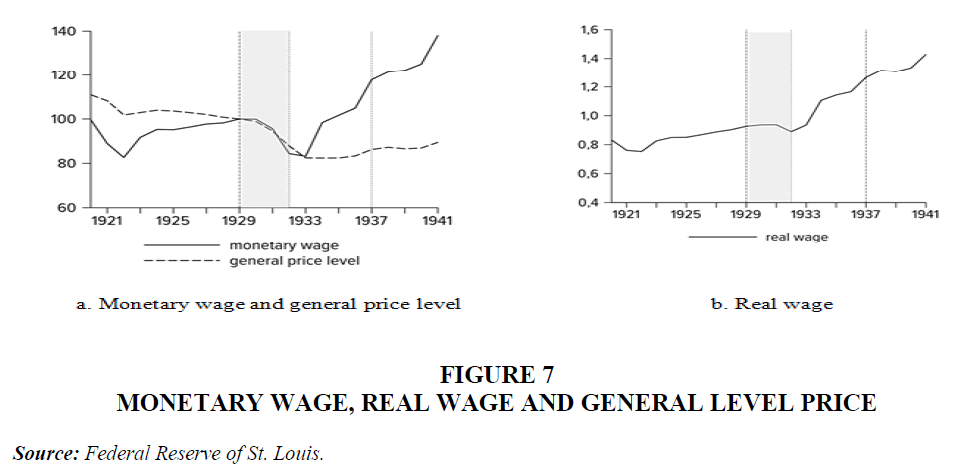
Rigidity of the monetary wage: Finally, although between 1929 and 1932 the trend of the money wage, quite faithfully follows that of prices, it differs in at least two aspects. First of all, in the initial phase of the recession, the salary money adjusts more slowly than prices: while the money wage index between 1929 and 1930 remains substantially stable (it falls from 100 to 99.9), that of prices falls from 100 to 98.8. It is only starting from 1931 that the monetary wage begins to decrease significantly, although its reduction is less than the reduction in prices. The result of the stickiness and the time lag with which the adjustment of money wages takes place means that the real wage increases slightly in the two-year period 1930-1931. Only in the two-year period 1932-33 was the reduction in the money wage greater than that in the prices with the result that the real wage decreased (graphs (a) and (b) of figure 7). The effect of the deflationary spiral on the trend of the unemployment rate proves to be dramatic: graph (b) of figure 4 shows how the unemployment rate which in 1929 was equal to 3% reaches a maximum point of 25% in 1933.
Role of Fiscal and Monetary Policies
In line with the principle of a balanced state budget, supported by the classical theory, the tax authorities assume an extremely passive and neutral attitude during the entire business cycle with increases in public expenditure which, in the face of economic upheavals, turn out to be insignificant and derisory.
Following this extremely passive attitude in dealing with the economic depression in the four-year period 1930-1933, public spending remained substantially stable, increasing slightly in the two-year period 1930-1931 by 1.7 and 0.7 respectively (see the graph (b) of figure 7) and even shrinking by more than half a percentage point in the following two years. As we have seen previously, the monetary authorities do not oppose the drastic and sudden reduction of the banking multiplier, following the panic of savers (due to the defense of the fixed exchange rate of the dollar with gold), and consequently, they do not increase significantly the monetary base is adequate: the money supply, therefore, is drastically reduced. Only starting from 1933, i.e. only following the abandonment of the gold standard, the FED implements a decidedly expansive monetary policy through a strong change in the monetary base and a reduction in the nominal interest rate.
Interpretative Crisis of the Classical Model
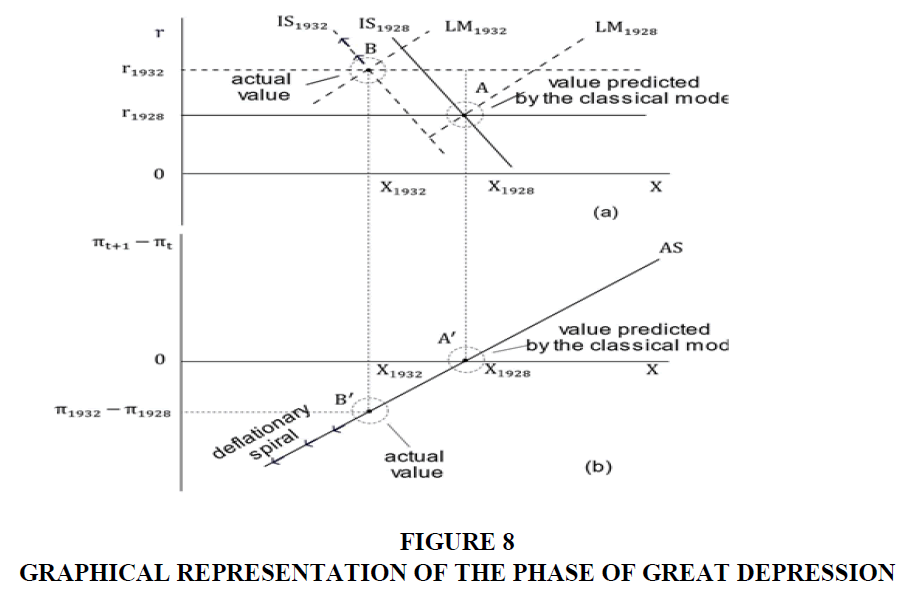
The DG, in addition to representing a shocking and dramatic event for the lives of millions of individuals, constitutes a turning point in the evolution of economic theory, marking, in fact, the birth of modern macroeconomic theory. Faced with the systemic upheavals of the economy, the classic benchmark proves incapable of providing convincing explanations of economic events and, above all, of indicating the economic policy interventions suitable for overcoming the collapse of production and the emergence of endemics. In the classical model, a perturbation on the demand side produces only monetary effects, i.e. an immediate and perfect adjustment of prices and monetary wages which allows the equilibrium level of production to remain unchanged. Let's see in detail, with the help of figure 8, the predictions of the classic benchmark in the presence of nominal disturbances on the demand side as it happened during the GD. Assume that the economic system in graph (a) of CS1.8 is in a full employment equilibrium, i.e. at point A = (X1928, r1928) and at point A′ = (X1928; Δπ1928 = 0) in graph (b), i.e. in a situation, hypothetically, similar to the one preceding the GD. Let us now assume that an adverse perturbation, such as the one that occurred in 1929, affects the exogenous part of the autonomous component of aggregate demand (e.g., reduction of investments and exogenous consumption). In accordance with the predictions of the classical model, graph (a) shows that the overall nominal disturbance on the demand side should generate a reduction in the general price level which, however, should correspond to an immediate and perfect reduction in the money wage so as to leave unchanged the level of real wages and, therefore, should cause the change in the inflation rate (or rather than forecast error made by the workers' union) is null. In other words, the adjustment mechanism envisaged by the classical benchmark should have kept the economic system stably at point A.
As we have seen, the events that occurred during the recession in the USA of 1929- 1932 completely contradict the conclusions and predictions of the classical model. On the one hand, following the stock market and banking system crisis, the economic system suffers a drastic reduction in aggregate demand, while the behavior of the FED implies a rise in the real interest rate; on the other hand, the lag of the adjustment of the money wage (following the rigidity of the contractual money wage and, indirectly, of the expected inflation rate) to the reduction of the general price level produces an increase in the real wage. Following this chain of effects, the economic system spirals into a deflationary spiral that pushes the system further and further away from the initial equilibrium point.
In conclusion, two points deserve to be underlined regarding the case we have just studied. In the first place, in the two-year period 1930-1931, i.e. immediately after the emergence of the stock market crisis, the monetary wage showed a rigidity in 1930 and a stickiness in the following year. The time lag of the real wage adjustment pushes firms to contract the supply of goods (which is not admissible in the classical model due to the presence of a perfect and immediate price adjustment mechanism). Secondly, once the rebalancing mechanism of the price system fails and, therefore, the automatic nature of a full employment equilibrium, the economic system remains trapped in an equilibrium of underemployment which even worsens over time.
Phase of the Economic Recovery: 1933-1936
The turning point of the business cycle occurs in 1933. The GDP growth rate, after having reached the minimum of -14.9% in 1932, started to grow again in March 1933 and closed the year with a reduction of "only" -1.9%, thus starting the phase of expansion of the business cycle. As we have seen above, the intense deflation process of the period 1930-1932 is largely attributable to the conduct of the FED in the management of monetary policy. In fact, the choice to support the fixed exchange rate and therefore to adjust the base coherently with the achievement of the external objective prevents the FED from neutralizing the negative effect produced by the reduction of the monetary multiplier. Let us examine the factors behind the economic recovery in the period 1933-1936 (Friedman & Schwartz, 2008b).
On the one hand, fiscal policy contributed in a limited way to the recovery of the period 1933-1936. As we have seen in figure 6, the increase in public expenditure is limited and the management of budgetary policy is still oriented towards the objective of balancing the budget balance (only starting from 1941, vice versa, the contribution of public expenditure to GDP growth will assume a significant weight). On the other hand, the monetary policy which in the period 1930-1932 had played a crucial role in accentuating the depression of the economy due to the decision to regulate the creation thus in the period 1933-1936 vice versa proves to be decisive in starting the economic recovery. The transmission mechanism through which monetary policy operates deserves particular attention.
1. First, the change in monetary policy strategy pushes the US economy into a liquidity trap. Between 1933 and 1936, the expansion of the monetary base – whose index (base = 1929) went from 68.1% to 96.3% – brought about the zeroing of the nominal interest rate (the latter fluctuates between 0 .05 and 0.014%). As we know, in these circumstances, the Keynes effect is essentially null and therefore fails to stimulate aggregate demand.
2. Secondly, in the economic recovery phase, monetary balances grow substantially: in fact, although the price level increases from 3% to 14.3%, monetary expansion is such as to generate an increase in monetary balances (see figure 6). The increase in monetary balances therefore provided a stimulus to effective demand through the Pigou effect: an increase in the real wealth of households, in fact, stimulating consumption is reflected in an increase in effective demand.
3. Thirdly, the declared objective of the FED to pursue a reflation process in an attempt to bring the price level back to pre-deflationary levels generates a state of expectations such that economic agents believe that the inflation rate must increase in future periods and consequently that the real interest rate must be negative (given the zeroing of the nominal interest rate). In fact, the latter went from +5.6% in 1933 to -2.8% in 1934 and further decreased to -3.2% in 1936. It is therefore probable that the reflation pursued by the FED has been the main stimulus channel for the effective demand through increased investment. Actually, reflation, by generating an increase in the inflation rate and therefore a reduction in the real interest rate, determines an increase in investment.
In conclusion, the economic recovery in the USA in the period 1933-1936 took place as a result of an expansive monetary policy following the abandonment of the gold standard. Expansive monetary policy (what we will nowadays call unconventional monetary policy implemented with quantitative easing) produces the following effects:
1. No Keynes effect, due to the presence of the liquidity trap.
2. Positive Pigou effect and therefore, via an increase in monetary balances, an increase in consumption.
3. Positive reflation effect which, by reducing the real interest rate, produces a significant increase in private investment.
Conclusion
This case study has examined a number of issues relating to the GD period of the 1930s. The different conclusions are as follows
• In the first place, the origin of the GD phase must be sought in the bursting of the speculative bubble created in the second five-year period of the 1930s by virtue of low interest rates and expectations of further increases in share prices.
• Secondly, the persistence of the recessionary phase which lasted for more than three years can be traced back to the traditional neutrality of fiscal policy and to a monetary policy which implicitly – given the reduction of the multiplier monetary policy due to the bank run – is restrictive since the defense of the fixed exchange rate does not allow the FED to adequately increase the monetary base.
• Thirdly, in line with the principles of the classical paradigm, macroeconomic policies at least until 1933 are neutral and in any case unable to effectively counteract the real adverse effects resulting from the bursting of the speculative bubble on the stock market.
• Fourthly, the economic recovery between 1933 and 1937 was driven decisively by the phenomenon of reflation favored by a monetary policy which today could easily be defined as unconventional. In fact, faced with a context characterized by the presence of a liquidity trap, the FED favors the stimulus of private investments by favoring the formation of expectations of an increase in the inflation rate so as to reduce the real interest rate.
• Finally, the theoretical repercussions of the Great Depression is–as is well known–the crisis of the classical paradigm unable to provide a plausible explanation of the persistence of the recessionary phase and, therefore, unable to provide useful indications to macroeconomic policy makers for a quick exit from the economic crisis.
References
Bernanke, B. (2002). Remarks by governor ben s. Bernanke. Conference to honor milton friedman. University of Chicago.
Bernanke, B.S. (2000). Essays on the great depression. In Essays on the Great Depression. Princeton University Press.
Bernanke, B.S., & James, H. (1990). The gold standard, deflation, and financial crisis in the Great Depression: An international comparison.
De Long, J.B., & Shleifer, A. (1991). The stock market bubble of 1929: evidence from clsoed-end mutual funds. The Journal of Economic History, 51(3), 675-700.
Indexed at, Google Scholar, Cross Ref
Eichengreen, B., & Irwin, D. (2009). VOX. https://cepr.org/voxeu/columns/protectionist-temptation-lessons-great-depression-today
Eichengreen, B., & Temin, P. (2000). The gold standard and the great depression. Contemporary European History, 9(2), 183-207.
Eichengreen, B.J. (1996). Golden fetters: the gold standard and the Great Depression, 1919-1939. NBER series on long-term factors in economic development.
Friedman, M., & Schwartz A.J. (2008a). The Great Contraction, 1929–1933. Princeton University Press.
Friedman, M., & Schwartz, A.J. (2008b). A monetary history of the United States, 1867-1960. 4, Princeton University Press.
Galbraith, J.K. (1954). The great crash, 1929.
Hamilton, J. D. (1987). Monetary factors in the Great Depression. Journal of Monetary Economics, 19(2), 145-169.
Indexed at, Google Scholar, Cross Ref
Hamilton, J.D. (1988). Role of the international gold standard in propagating the Great Depression. Contemporary Economic Policy, 6(2), 67-89.
Krugman, P. (2009). Protectionism and the Great Depression, New York Times, November 30.
McCallum, B. T. (1990). Could a monetary base rule have prevented the Great Depression?. Journal of Monetary Economics, 26(1), 3-26.
Olney, M.L. (1999). Avoiding default: The role of credit in the consumption collapse of 1930. The Quarterly Journal of Economics, 114(1), 319-335.
Romer, C.D. (1990). The great crash and the onset of the great depression. The Quarterly Journal of Economics, 105(3), 597-624.
Temin, P. (1976). Did monetary forces cause the Great Depression?. Norton.
Temin, P., & Toniolo, G. (2008). The World Economy between the Wars. Oxford University Press, 2008.
Whaples, R. (1995). Where is there consensus among American economic historians? The results of a survey on forty propositions. The Journal of Economic History, 55(1), 139-154.
White, E.N. (1990). The stock market boom and crash of 1929 revisited. Journal of Economic perspectives, 4(2), 67-83.
Wicker, E.R. (1965). Federal Reserve monetary policy, 1922-33: a reinterpretation. Journal of Political Economy, 73(4), 325-343.
Received: 03-Dec-2022, Manuscript No. JEEER-22-005; Editor assigned: 05-Dec-2022, Pre QC No. JEEER-22-005(PQ); Reviewed: 19-Dec2022, QC No.JEEER-22-005; Revised: 22-Dec-2022, Manuscript No. JEEER-22-005(R); Published: 29-Dec-2022.
