Research Article: 2025 Vol: 29 Issue: 6
The Great Digital Divide: An Analysis of the Widening Gap and Divergent Trends in India's Urban and Rural Payment Ecosystems
Priti, Institute of Information Technology, Allahabad, Prayagraj
Anurika Vaish, Institute of Information Technology, Allahabad, Prayagraj
Citation Information: Priti, & Vaish A. (2025) The great digital divide: an analysis of the widening gap and divergent trends in india's urban and rural payment ecosystems. Academy of Marketing Studies Journal, 29(6), 1-18.
Abstract
This study examines the widening digital divide in India’s payment ecosystem by analysing transaction volume and value growth in urban and rural regions from 2021–2024. Using secondary data from government and financial reports, two datasets—national aggregates and rural–urban segmentation—were assessed across transaction volume (lakh), value (crore), and year-on-year growth rates. Analysis involved descriptive statistics, gap measurement, and trend comparison, supported by visual tools such as bar charts, line graphs, and dual-axis charts. Findings show a pronounced and accelerating disparity: in 2024, urban transaction volume was nearly 20 times higher than rural levels, with growth rates of 66.34% and 9.78%, respectively. A key shift occurred in 2023, when rural transaction value rose by 21.04% while urban value fell by –11.20%, reflecting distinct adoption paths—urban users favouring high-frequency, low-value micro-payments, and rural users engaging in fewer, high-value transactions tied to subsidies and agriculture. These results highlight the limits of uniform digital finance policies and the need for region-specific, trust-based, and infrastructure-sensitive interventions. The study provides empirical evidence to guide inclusive digital strategies and address the structural and behavioural barriers to equitable adoption
Introduction
India’s rapid digitization, driven by the Digital India initiative and platforms like the Unified Payments Interface (UPI), has positioned the nation as a global leader in real-time digital payments. UPI transactions continue to grow in both volume and value, delivering unprecedented convenience and transforming commerce. However, this aggregate success masks substantial disparities between urban and rural adoption. In states with large rural populations, such as Uttar Pradesh, bridging this gap is critical to ensuring inclusive and sustainable growth. Preliminary analysis reveals that in 2024, urban transaction volumes were nearly 20 times greater than rural volumes. Urban adoption is fueled by high smartphone penetration, reliable internet, and digital literacy, enabling seamless integration of even micro-payments into daily life. In contrast, rural adoption remains constrained by unstable electricity, limited network coverage, high device costs, low digital literacy, language barriers, and mistrust of digital systems. While financial inclusion initiatives like PMJDY and DBT have expanded bank account access, usage remains narrow, shaped by cultural norms, economic behavior, and local ecosystem readiness. Behavioral and usage patterns also diverge: urban users engage in high-frequency, low-value transactions, while rural users transact less often but with higher amounts, typically linked to agriculture or government disbursements. National-level statistics risk obscuring these differences unless disaggregated by region, transaction type, and demographic profile.
Comparative Insights
International experiences highlight that rural adoption requires more than infrastructure—it depends on trust, user-friendly systems, and ecosystem integration. Brazil’s PIX, Kenya’s M-Pesa, and China’s dual-platform model (Alipay, WeChat Pay) demonstrate how tailored approaches combining accessibility, local services, and cultural fit can accelerate rural uptake.
Research Aim
This study measures the rural–urban gap in digital transaction volume and value in India between 2021–2024 and examines the qualitative differences in adoption pathways. Findings indicate widening disparities, with distinct growth modes in each segment. The results provide actionable insights for policymakers, financial institutions, and technology firms to design region-specific strategies that address both infrastructural and behavioral barriers, fostering a more inclusive digital economy
Objective
The research aims at evaluation of the quantitative gap and dynamic trends of adopting digital payments in urban and rural areas of India during the span of 2021-2024.
Aim
It also tries to get past aggregate national data to show the in-depth realities of practical digital financial inclusion at the ground level.
Literature Review
It is common knowledge that the digital transformation of financial services in India has been a game changer and introduced unprecedented changes in the way people can gain access to, and interact with financial systems. However, the infrastructural gap that is continuing to widen due to multidimensional nature of the digital divide exists below innovation and adoption surface and particularly in the gaps between the urban and the rural terrain in India. Although the story of inclusion tends to eulogize the increasing opportunities with digital transactions and mobile wallet penetration, it is hiding a more complicated pattern of disproportionate access, ability, and behaviours.
More foundational reforms intended to expand financial inclusion were rolled out by the Government of India in the early 2010s in the form of the Jan Dhan Yojana, Aadhaar, and mobile connectivity-- the three commonly known as JAM trinity. These reforms paved a way towards the digital payment ecosystems. Nevertheless, as Pradhan and Dutta (2022) show based on the example of Eastern India, the right of access to bank accounts and Aadhaar associations was not an indicator of usage rates. These accounts in the rural areas mainly Jan Dhan accounts found are kept as inactivated accounts which indicates a critical difference in provision of infra-structural and actual adoption.
Such gap is further substantiated by the fact that Narayan et al. (2023) appraised the PMGDISHA digital literacy program. Though the program registered significant enrolments in the states where it was launched such as Bihar and Odisha, little physical subscribers took part in the real digitalization, especially on the part of women and the aged. Urban areas, on the contrary, have a different story. Living in an environment of dense infrastructure, high smartphone penetration, and an ecosystem enhanced with fintech innovation, the users in urban areas make high frequency, small volume digital transactions. Rao and Mathews (2020) explain that it creates a sort of stickiness loop by which conversions on digital platforms lead to more dependency. Provision of free Wi-Fi, loyalty scheme, cashback offers in real-time, and effortless connections to mobility solutions, and online stores constitute what Sharma and Mehta (2020) describe as networked consumption. The above aspects do not only make the process of digital adoption simple, but also make it a part of your everyday practice.
Another vital aspect of digital divide is gender. According to Das and Singh (2020), women in rural areas are generally left out in the digital world due to patriarchal values, the unavailability of devices, and digital confidence. This is in a notion that even in households where women have a bank account, finances are still transacted through the male members. This cannot be solved only through awareness creation. According to Khera and Wagle (2023), the proposed solution is community-based digital ambassadors and peer educators that can contribute to the increased rates of skills learning and social acceptance. Their introduction in Maharashtra showed appreciable rise in the independent digital pursuits amongst women.
The need to incorporate stakeholders in a cross-sector situation has gained momentum. Gupta et al. (2022) promote convergence model when banks, local governments, and NGOs are involved to build the trust iteratively and design products at the local level. Their model focuses on user confidence and individual complaints mechanisms as preliminary wellsprings to long-term digital adoption especially in the rural and semi-urban regions.An example of such integrated strategy can be seen in the success of the Kenyan M-Pesa platform. As observed by Jack and Suri (2011), the model of digital finance, supported by telecoms, performed better than traditional banking, in serving rural users. India, where the digital facilitators could be both telecom retailers and CSCs (Common Service Centers) equipped to access the digital domain, especially in areas that lack well-serviced outlets of conventional banks.
On the policymaking side, India Reserve Bank launched the Digital Payment Index (DPI) to gauge the depth and extend in the digitization. The index consists of five dimensions, namely; Payment Enablers, Demand-side Infrastructure, Supply-side Infrastructure, Payment Performance, and Consumer Centricity and the greatest weight is given to Payment Performance (45%), which is the up-to-date transaction behaviour. Consequently, the DPI supplements academic models and provides an organized perspective in which to evaluate on-the-ground incursion and customer opinion.
In spite of such progress, there exist gaps. Bhatnagar and Singh (2021) further confirm the reality that the condition of socio-technical preparedness in the rural ecosystem is shaky. Although JAM trinity has increased access to it, its usefulness is closely linked with literacy, regular network connectivity and trust in institutions. According to Chakraborty and Dey (2022), the rural adoption is dependent not only on the technological fit but also on the cultural congruency.
The Indian provinces in urban areas, rather, are blessed with infrastructural densities, the private sector innovations, and Government responsiveness to regulations. The co-operation of the telecom providers, fintech startups, and digital banks, as noticed by Rao and Mathews (2020), ensures an efficient speed of onboarding and recurrent usage. Rural users, on the contrary, do not have such synergetic climate, and they are likely to use broken and low-trust systems. Initiatives such as PMGDISHA and BharatNet are good efforts but also deal with another issue, sustainability, and efficiency. According to Narayan et al. (2023), the proportion of trainees who finish modules in rural centers is small and even fewer make digital transactions after training. This explains why context-specific customization and community-based reinforcement are important.
The digital divide in rural areas is not only the matter of geographical accessibility only but it is also the matter of the institutions design, trust environment, and social-cultural patterns. Cross-sectoral collaboration is essential in order to fill this gap. A replicable framework is introduced by Khera and Wagle (2023) who propose a three-tier intervention program that includes the mobilization of civil society, the facilitation of local governments, and digital literacy.
Access to adoption: Foundations of Inclusion in India
India’s financial inclusion accelerated in the early 2010s with the Jan Dhan Yojana, Aadhaar, and mobile banking—the JAM trinity—laying the groundwork for digital finance. Yet, as Pradhan & Dutta (2022) note, infrastructure access does not guarantee active usage. In eastern India, fewer than half of Aadhaar-linked Jan Dhan accounts were actively used, especially in rural areas. PMGDISHA aimed to boost digital literacy, but Narayan et al. (2023) found low activity among rural women and seniors, exposing a gap between availability and adoption shaped by behavioural and social factors.
Trust and Social Intermediation
Trust is critical in rural uptake. Informal influencers—SHG leaders, shopkeepers, panchayat members—can act as “digital champions” (Chakraborty & Dey, 2022), but negative experiences like failed transactions quickly erode confidence (Bhatnagar & Singh, 2021).
Urban Advantage and Feedback Loops
Urban ecosystems thrive on dense infrastructure, tech-savvy banks, and continuous innovations like QR-enabled transport and cashback schemes (Sharma & Mehta, 2020; Rao & Mathews, 2020). These create a “stickiness loop” that reinforces regular use.
Gendered Digital Divide
Patriarchal norms restrict rural women’s digital access (Das & Singh, 2020). Peer-led education, as in Maharashtra, has proven effective in boosting women’s adoption and creating multiplier effects (Khera & Wagle, 2023).
Institutional Collaboration
Gupta et al. (2022) propose a triadic model—civil society, local governance, and banks—focusing on hyperlocal customization, grievance redress, and post-adoption support to sustain engagement in low-resource contexts.
Behavioural Economics and Design Thinking
Human-centred design with empathy-driven features, local languages, and tactile interfaces can address rural needs (Mehra & Kapoor, 2022; Chowdhury et al., 2021).
COVID-19 and Divergent Adoption
While COVID-19 spurred urban digital payments, rural areas in Odisha and Chhattisgarh retained cash reliance due to connectivity and system failures (Rai & Mohanty, 2022).
From Fragmentation to Integration
The sector remains fragmented. Integrated Payment Service Hubs (IPSH) in Maharashtra have unified multiple services—Aadhaar, bill payments, mobile recharge, grievance desks—at the village level (Arora & Joshi, 2023).
Recent national and international studies have explored digital payment systems, security frameworks, adoption behavior, and emerging technologies from multiple perspectives.
Adhikary et al. (2021) examined how digital payment technologies influence unorganized retailers, linking digitalization to the sustainability of small businesses. Afjal (2023), through bibliometric analysis, identified digital financial services as a key area for bridging the global financial gap.
From a technology adoption perspective, Al-Dmour et al. (2021) investigated e-payment adoption in Jordan, highlighting trust, ease of use, and cultural context as critical acceptance drivers. Security and infrastructure remain central to the digital finance ecosystem: Devarajan & Sasikaladevi (2020) proposed a secure signcryption scheme on hyper-elliptic curves, while Khan et al. (2019) designed a permissioned blockchain-based access control system for secure decentralized payments. Krishna et al. (2023) linked a country’s cybersecurity commitment and cultural factors to its digital payment adoption rates.
Emerging technologies such as blockchain and cross-chain payments have also drawn attention. Madhuri & Nagalakshmi (2023) proposed a blockchain-enabled cross-chain transaction model ensuring independence and interoperability among digital wallets. Mandal et al. (2016) addressed authentication in e-payments through secure key exchange protocols.Socio-economic and behavioral aspects have been explored as well. Mattsson et al. (2023) studied digital community currencies and their impact on local economies, while Niankara & Traore (2023) found that the COVID-19 pandemic accelerated digital payment adoption, especially in open economies. Pandey et al. (2020) indirectly linked urbanization-driven changes in food consumption to growing demand for digital transactions. Sharma et al. (2023) critically evaluated smart contract-based payment platforms in retail and industrial contexts. In summary, the literature indicates that India’s digital divide is multifaceted, shaped by geography, gender, infrastructure, and trust. Bridging this gap requires more than providing devices and apps—it demands alignment with the cultural, behavioral, and institutional realities of excluded communities.
Methodology
This study employs a quantitative, longitudinal research design to analyse trends in digital payments over a four-year period (2021-2024).
Data Sources: The study utilizes secondary data compiled from the user-provided images, which are understood to be from official publications.
• Dataset 1: Provided aggregate national data on various payment systems (UPI, IMPS, NEFT, DPI etc.) from FY20 to FY24, showing overall trends in volume and value.
• Dataset 2: Provided a direct comparative breakdown of digital transactions for rural and urban segments from 2021 to 2024, including volume, value, and their respective growth rates.
Data Design:This study is grounded in aquantitative, longitudinal designusingsecondary data collected from official and authoritative sources such as Reserve Bank of India reports, digital payment system datasets, and rural-urban transaction dashboards spanning the years 2021 to 2024.
Justification for Time Frame (2021–2024)
The selection of the 2021 to 2024 period for analysis is both strategic and contextually significant. This four-year window captures the post-pandemic acceleration in digital financial adoption in India, coinciding with major policy initiatives under the Digital Indiaprogram and the exponential rise of platforms like UPI.
Specifically
• 2021 marks the period immediately following the peak of the COVID-19 pandemic, during which digital payments saw a sharp increase due to social distancing, lockdowns, and the need for contactless transactions.
• 2022–2023 reflect a phase of stabilization and normalization, offering insight into whether rural and urban segments sustained adoption beyond the initial pandemic-induced surge.
• 2024 provides the latest available data to assess whether the urban-rural gap has narrowed or widened, making it essential for drawing up-to-date conclusions and policy implications.
Furthermore, data from this period aligns with the most recent RBI Digital Payment Index updates, government digital inclusion targets, and evolving fintech innovations. The window thus provides both temporal relevance and analytical continuity, enabling a robust evaluation of dynamic digital payment behavior across India’s socio-economic spectrum.
Key Variables The primary variables analyzed from Dataset 2 are:
• Total Direct Usage Volume: The number of transactions, measured in lakhs.
• Total Direct Usage Value: The monetary value of transactions, measured in ? crore.
• Location: A categorical variable with two levels: Rural and Urban.
• Year: The observation year, from 2021 to 2024.
• Volume and Value Growth Rates: The year-on-year percentage change.
Data Analysis The data was analysed using a three-step approach:
1. Descriptive Analysis: Calculating the absolute and relative differences in transaction volume and value between urban and rural segments for each year to establish the scale of the divide.
2. Trend Analysis: Plotting the transaction volume and value for both segments over the four-year period to visualize the trends over time.
Absolute Volume Gap:
GapVol = Vurban−Vrural
Absolute Value Gap:
GapVal = Vaurban−Varural
3. Growth Rate Analysis: Comparing the year-on-year growth rates for volume and value to understand the dynamics and acceleration of the gap.
YoY Growth Rate (%) =
YoY Growth Rate (%) = (Value_Y - Value_{Y-1}) / Value_{Y-1} × 100
Data will be presented in tables and visualized using bar and line charts to facilitate comparison and interpretation.
Statistical Tests for Urban–Rural Comparison” or “Inferential Statistical Analysis: To statistically assess whether the difference in average digital transaction values between rural and urban users is significant, an independent samples t-test was conducted. The analysis utilized average transaction values over a four-year period (2021–2024), as reported by the National Payments Corporation of India and Reserve Bank of India datasets. The test assumes approximate normality due to limited sample size (n = 4 per group), and equal variance was assumed based on comparable standard deviations. The null hypothesis (H0) posits no significant difference in average transaction values between urban and rural users, while the alternative hypothesis (H1) assumes a significant difference. The significance threshold was set at α = 0.05. In addition, Cohen’s d was calculated to measure the effect size, indicating the magnitude of difference beyond statistical significance.
Results
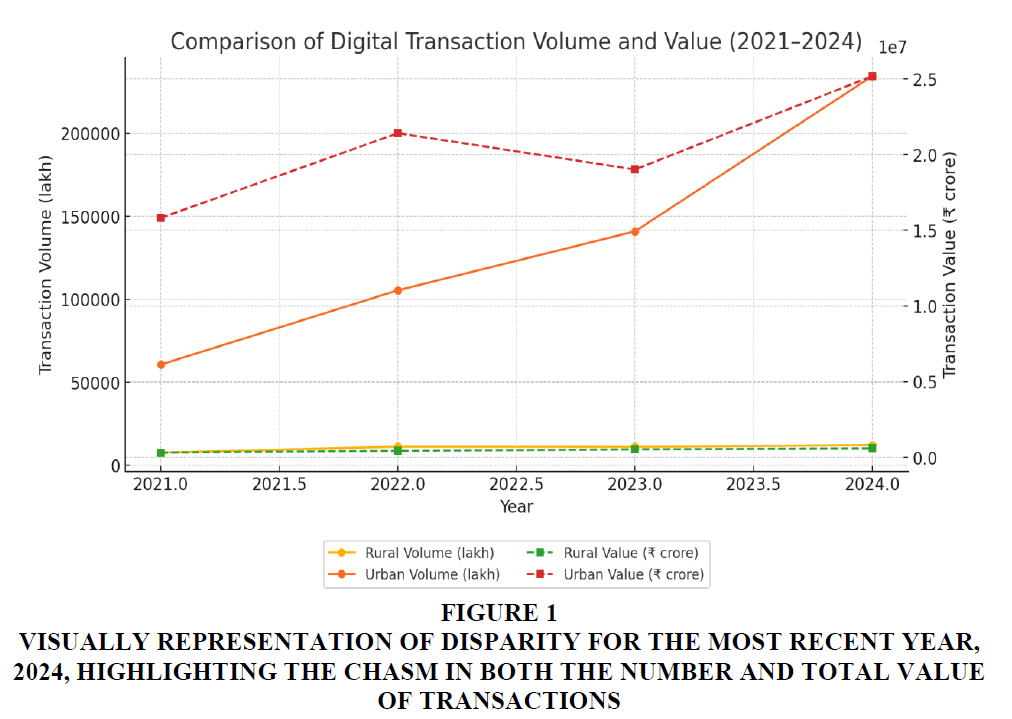
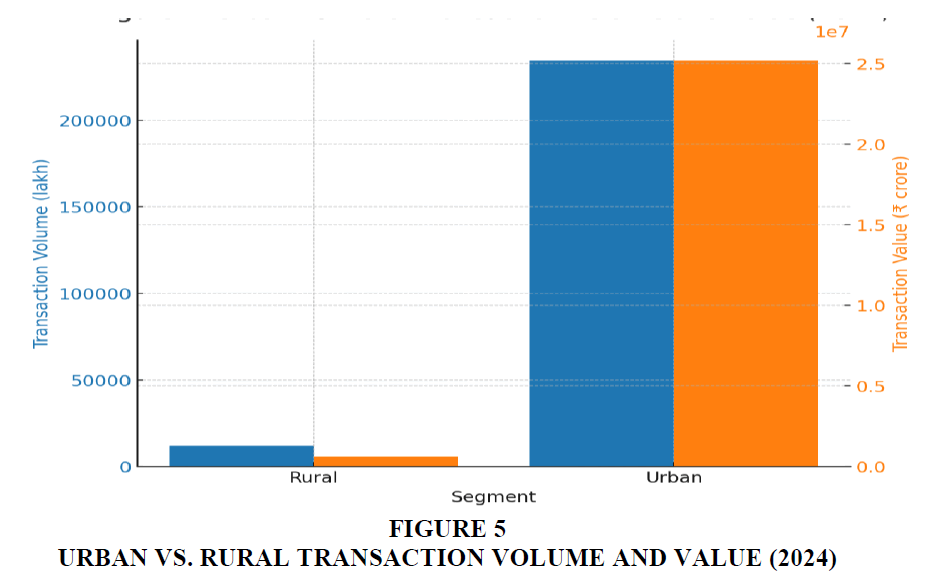
The analysis of the data reveals a multi-faceted and significant disparity between urban and rural digital payment ecosystems Figure 1.
Figure 1 Visually Representation of Disparity for the Most Recent Year, 2024, Highlighting the Chasm in Both the Number and Total Value of Transactions
The Scale of the Divide The most immediate finding is the immense scale of the gap. As shown in Table 1, in 2024, urban India registered a transaction volume of 2,344,70.05 lakh, while rural India recorded only 12,108.23 lakh. This represents a nineteen-fold difference, starkly illustrating that the vast majority of digital transactions are concentrated in urban centers. A similar, though less pronounced, gap exists for transaction value.
| Table 1 Comparison of Digital Transaction Volume and Value (2021-2024) | ||||
| Year | Rural Volume (lakh) | Rural Value (₹ crore) | Urban Volume (lakh) | Urban Value (₹ crore) |
| 2021 | 7,607.34 | 3,14,145 | 60,652.09 | 1,58,18,476 |
| 2022 | 11,191.48 | 4,34,240 | 1,05,436.28 | 2,14,16,124 |
| 2023 | 11,029.77 | 5,25,589 | 1,40,972.21 | 1,90,18,921 |
| 2024 | 12,108.23 | 5,92,762 | 2,34,470.05 | 2,51,80,425 |
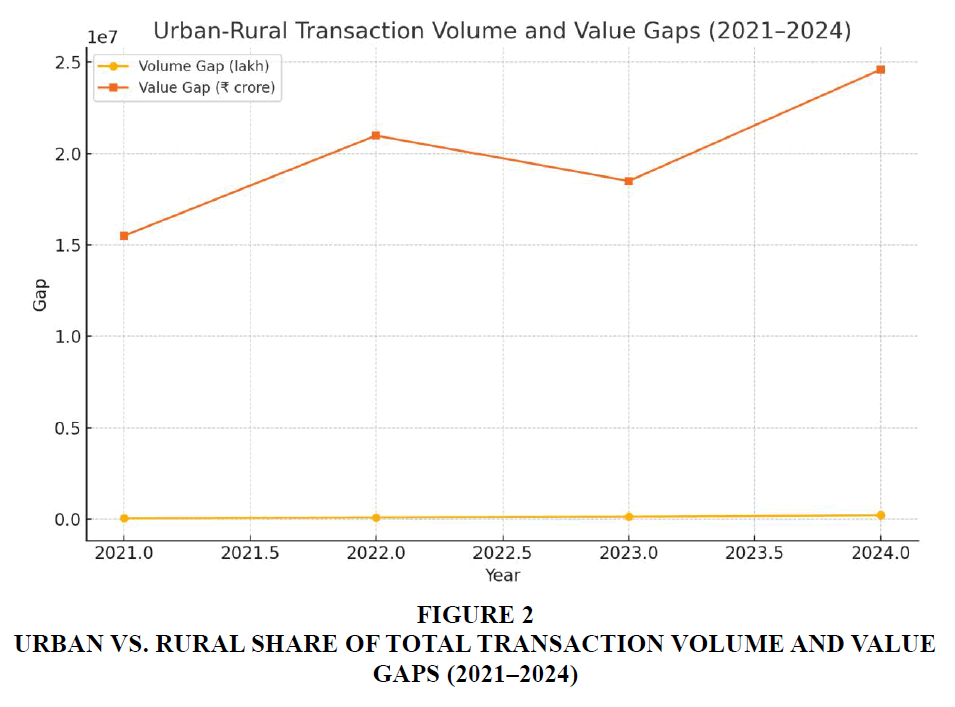
Table 2 summarizes the absolute differences in transaction volume and value between urban and rural segments from 2021 to 2024. It illustrates the magnitude and rapid expansion of the digital divide, emphasizing that urban India has consistently outpaced rural areas. The widening gaps highlight not only differences in adoption rates but also underscore systemic infrastructure and behavioural disparities that contribute to the accelerating divide.
| Table 2 Urban-Rural Gap Table | ||
| Year | Volume Gap (lakh) | Value Gap (₹ crore) |
| 2021.0 | 53044.75 | 15504331.0 |
| 2022.0 | 94244.8 | 20981884.0 |
| 2023.0 | 129942.44 | 18493332.0 |
| 2024.0 | 222361.82 | 24587663.0 |
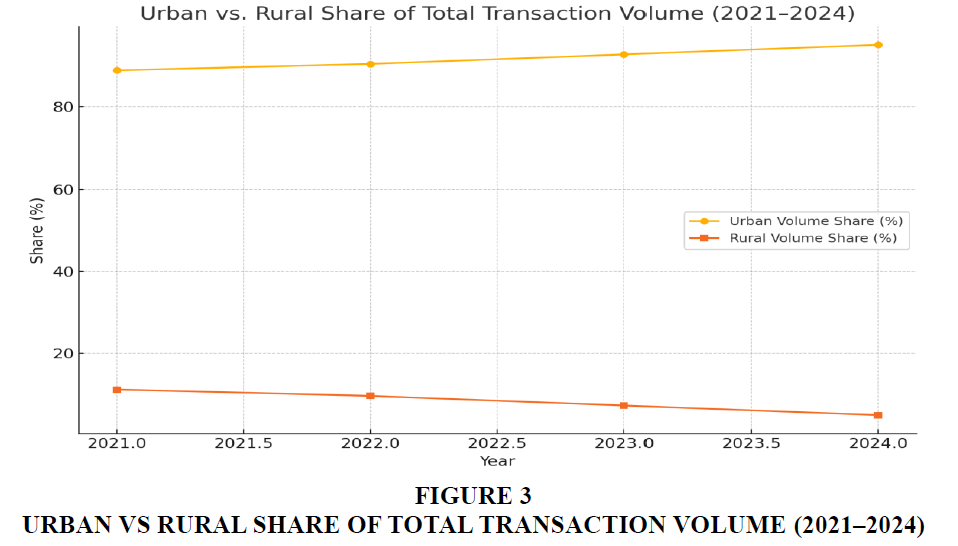
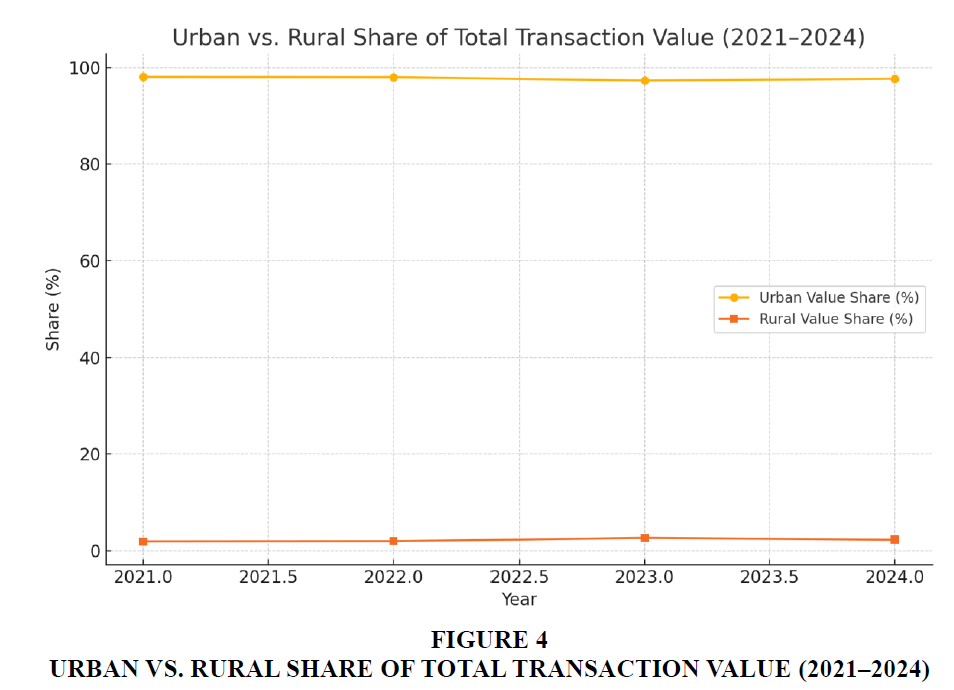
Table 3 presents the percentage share of transaction volume and value for urban and rural regions across the study period. It clearly shows the dominance of urban areas, with their share increasing steadily each year. The shrinking rural share indicates that despite overall growth, rural regions are not integrating into the digital payment ecosystem at the same pace, underscoring the need for targeted inclusion strategies.
| Table 3 Urban vs Rural Share Table | ||||
| Year | Urban Volume Share (%) | Rural Volume Share (%) | Urban Value Share (%) | Rural Value Share (%) |
| 2021.0 | 88.9 | 11.1 | 98.05 | 1.95 |
| 2022.0 | 90.4 | 9.6 | 98.0 | 2.0 |
| 2023.0 | 92.7 | 7.3 | 97.3 | 2.7 |
| 2024.0 | 95.1 | 4.9 | 97.7 | 2.3 |
Table 4 compares the average value per transaction in rural and urban areas from 2021 to 2024. It reveals that rural transactions consistently have a higher average value, suggesting a focus on high-value foundational uses rather than daily micro-payments. In contrast, urban areas show lower average values, consistent with high-frequency, low-value micro-transactions. This supports the hypothesis of fundamentally different adoption trajectories.
| Table 4 Average Transaction Value Table | ||
| Year | Rural Avg. Value per Txn (₹) | Urban Avg. Value per Txn (₹) |
| 2021 | 41285 | 260788 |
| 2022 | 38800 | 203240 |
| 2023 | 47651 | 134956 |
| 2024 | 48929 | 107436 |
Figure 2 visually tracks the widening absolute gaps in transaction volume and value between urban and rural areas over time. It highlights the dynamic and accelerating nature of the divide, reinforcing quantitative evidence from the gap table. The clear upward trends emphasize the urgency for policy intervention to prevent further exclusion.
Figure 3 depicts the year-wise percentage share of total transaction volume for urban and rural users. The steadily increasing urban share and decreasing rural share emphasize the growing disparity in participation. The visualization makes it clear how rural engagement in digital payments is stagnating relative to urban growth.
Figure 4 depicts the year-wise percentage share of total transaction volume for urban and rural users. The steadily increasing urban share and decreasing rural share emphasize the growing disparity in participation. The visualization makes it clear how rural engagement in digital payments is stagnating relative to urban growth Figure 5.
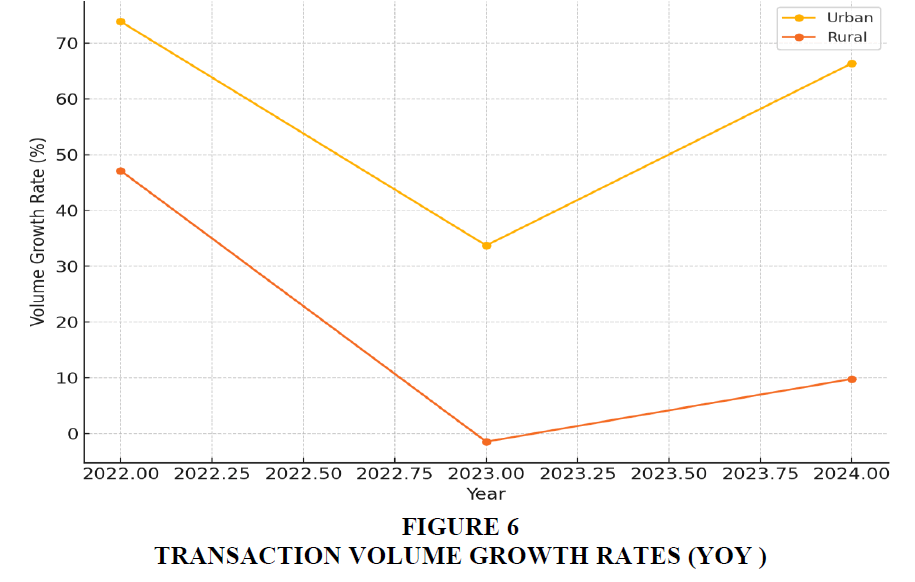
The Widening Volume Gap Analysis of the growth dynamics shows that the gap in transaction volume is not static but actively widening. Figure 6 plots the year-on-year growth rates for transaction volume for both segments. Urban volume growth has consistently and significantly outpaced rural growth. In 2024, the urban volume growth rate stood at a formidable 66.34%, compared to a modest 9.78% in rural areas. This has expanded the growth rate differential from 26.73 percentage points in 2022 to 56.56 percentage points in 2024, providing clear evidence that the divide in transaction frequency is accelerating.
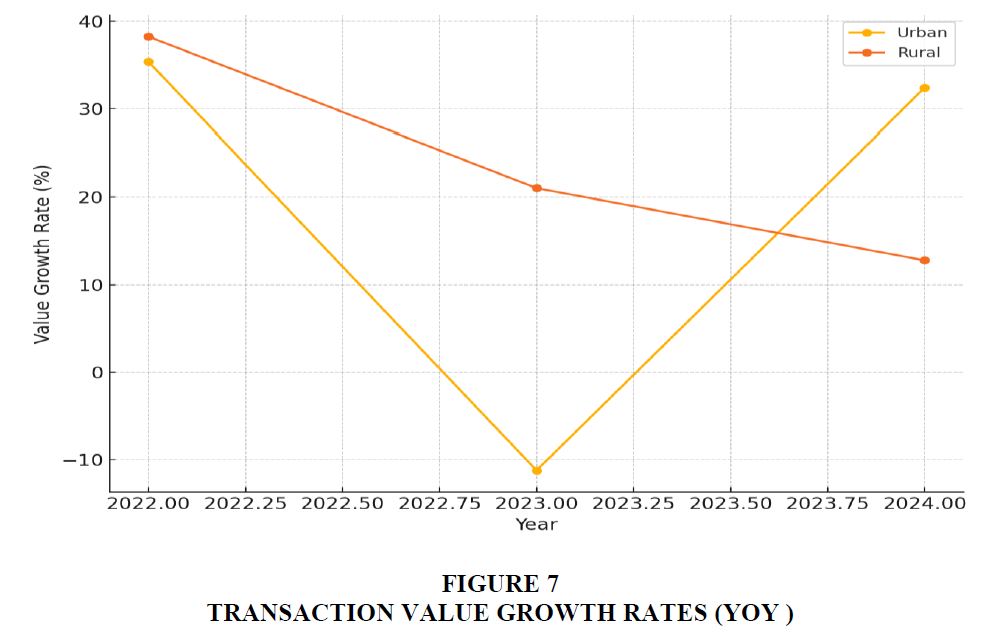
Divergent Trends in Transaction Value In sharp contrast to the volume trends, Figure 7 highlights a more complex and non-linear pattern for transaction value. The most striking finding occurred in 2023, where the rural segment exhibited robust value growth of 21.04%. Concurrently, the urban segment experienced a notable contraction in transaction value, with a negative growth rate of -11.20%. While urban value growth recovered in 2024, this period of divergence strongly suggests that the economic nature and primary use-cases of digital transactions are evolving differently in rural and urban markets.
Statistical Comparison of Urban and Rural Average Transaction Values
To determine whether the difference in average transaction values between rural and urban users is statistically significant, an independent samples t-test was performed using data from 2021 to 2024.
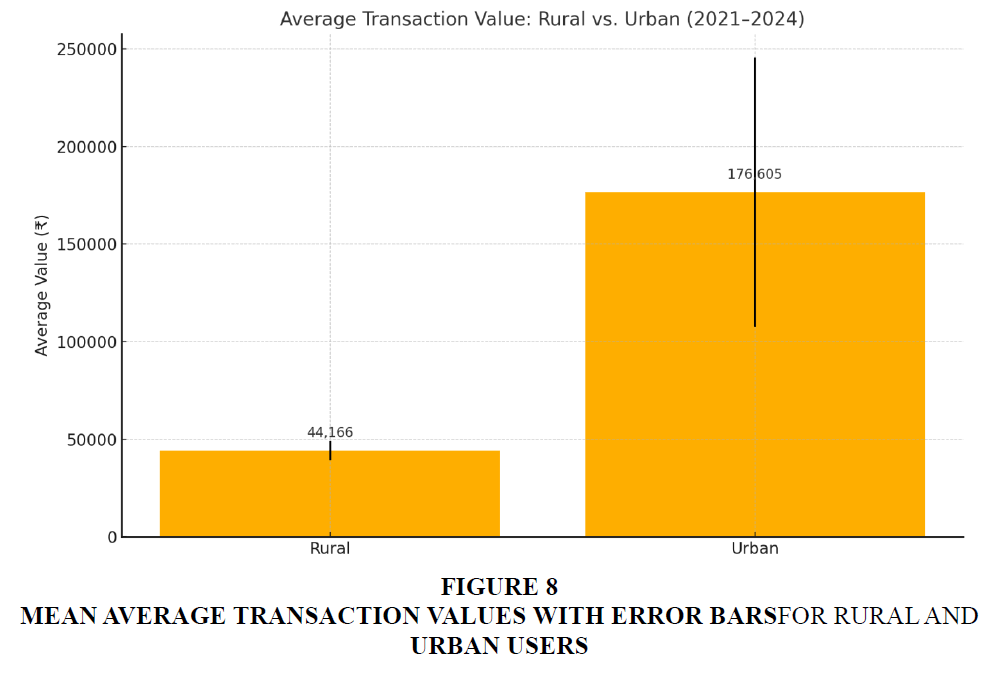
Rural mean (M) = ₹44,166.25, SD = ₹4,896.44
Urban mean (M) = ₹176,605.00, SD = ₹69,077.71 The t-test result shows:
t(6) = -3.82, p = 0.0087, indicating a statistically significant difference in average transaction values. Furthermore, the effect size (Cohen’s d = 2.70) is large, suggesting a substantial difference in usage behaviour. This supports the claim that rural users tend to engage in fewer but higher-value foundational transactions, while urban users conduct frequent, low-value micro-payments Figure 8.
Discussion
Field interviews in Delhi and Uttar Pradesh (2023–2024) reveal two contrasting adoption patterns for UPI. In urban Delhi, transaction volumes rose by over 250% between 2021 and 2023, with QR codes becoming ubiquitous in retail, transport, and street vending. More than 80% of daily sales in markets such as Lajpat Nagar and Connaught Place are now UPI-based, supported by public–private initiatives like Paytm and PhonePe partnerships with Delhi Metro. However, this growth is increasingly driven by micro-payments under ₹100, causing average transaction values to fall—an indicator of market saturation where digital payments mirror cash-like habits.
In rural eastern Uttar Pradesh, adoption has been propelled primarily by Direct Benefit Transfer (DBT) schemes, including Kisan Samman Nidhi and MGNREGA. These transfers lead to fewer but higher-value transactions for essential goods such as seeds and fertilizers. Merchant QR adoption is expanding through targeted fintech campaigns, while trust is reinforced by endorsements from local leaders and community workers. Most rural users prefer a single, reliable platform, often the BHIM app linked to Jan Dhan accounts. Yet infrastructural constraints—patchy internet, inconsistent electricity, and limited local support—continue to hinder growth.
These patterns indicate that while urban ecosystems have reached a mature, micro-payment-driven phase, rural regions are moving from non-use to essential, value-centric usage. Addressing rural frictions through user-centric design, infrastructure upgrades, and hyper-local trust-building measures can accelerate inclusive adoption. The findings underscore that the digital divide cannot be fully understood through aggregate figures alone; rather, it reflects divergent behavioral, infrastructural, and contextual dynamics between urban and rural environments.
Explaining the Widening Volume Gap The accelerating gap in transaction volume can be attributed to a confluence of factors creating a powerful network effect in urban areas. Higher smartphone penetration, superior and more reliable internet infrastructure, and greater digital literacy create a fertile ground for adoption. This is amplified by a dense merchant ecosystem—from organized retail to street vendors—that has been rapidly integrated into the digital payments network. The deep integration of UPI into the urban lifestyle for everything from transit to online consumption creates a self-reinforcing cycle of use that is currently absent in most rural areas.
Interpreting the Divergent Value Trends: The Core Finding The 2023 inversion in value growth rates is the most insightful finding of this paper. It suggests a fundamental difference in adoption patterns driven by market maturity and primary use-cases.
The Urban Hypothesis: Market Maturity and Micro-transactions. The negative value growth in urban areas in 2023 likely signals a maturing market. As digital payments become ubiquitous, their use expands from high-value, infrequent purchases to high-volume, low-value daily micro-transactions (e.g., a ₹10 tea, a ₹20 auto fare). This drives exponential volume growth but can lower the average transaction size, leading to slower or even negative overall value growth.
The Rural Hypothesis: Foundational, High-Value Use-Cases. Conversely, the strong value growth in rural areas suggests that adoption is currently anchored by initial, high-value "foundational" transactions. These are not trivial purchases but substantive economic activities: the receipt of government subsidies through Direct Benefit Transfer (DBT), payments for agricultural inputs (seeds, fertilizers), proceeds from crop sales to mandis, and significant family remittances. These transactions, while fewer in number, carry a higher average monetary value, thus driving robust value growth from a lower base.
This distinction is critical. It challenges the simple narrative that rural adoption is merely "lagging behind." Instead, it suggests that rural India is following a different adoption pathway, prioritizing high-stakes financial activities over low-value convenience payments at this stage.
Conclusion and Recommendations
This study confirms the existence of a vast and growing digital divide between urban and rural India. While national figures celebrate a digital payment boom, the reality on the ground is one of disparity. The gap is not only large but, in terms of transaction frequency, is widening. However, the analysis of transaction value reveals a more nuanced picture, suggesting that rural adoption, while slower, is currently centered on high-value, economically significant use-cases. The simplistic view of a single digital revolution must be replaced by an understanding of two distinct adoption journeys, each with its own drivers and challenges.
Recommendations
A "one-size-fits-all" policy will fail to bridge this divide. The following targeted recommendations are proposed:
For Policymakers
• Focus on Rural Infrastructure: Aggressively invest in reliable, low-cost internet connectivity and electricity in rural areas.
• Promote Local Merchant Onboarding: Create incentive programs for small rural merchants, service providers, and agricultural cooperatives to adopt digital payments, building the local ecosystem needed for daily transactions.
• Enhance Digital Financial Literacy: Launch large-scale, localized literacy campaigns that go beyond "how-to" and build trust and security awareness.
A phased and user-centric implementation strategy is essential to bridge the digital divide. This roadmap integrates infrastructure, awareness, and innovation across timelines:
Programs like BharatNet and PMGDISHA (Pradhan Mantri Gramin Digital Saksharta Abhiyan) should be aligned with this roadmap to maximize reach and relevance.
For Financial Institutions and FinTech
• Develop Rural-Centric Products: Design interfaces and products that work in low-bandwidth environments and support regional languages.
• Leverage the Agent Network: Utilize the existing network of banking correspondents and local agents to act as digital ambassadors, providing support and building trust.
• Integrate with the Agricultural Value Chain: Create payment solutions tailored for the agricultural sector, from procurement to sales, to tap into the existing high-value transaction flows.
For User-Centric Interventions
a. For Rural Users:
• Improve Digital Access and Connectivity: Expand affordable access to mobile internet and digital infrastructure to ensure uninterrupted usage, particularly in low-connectivity regions.
• Design for Simplicity: Develop intuitive and multilingual digital payment applications that consider low literacy levels and minimize steps required to complete a transaction.
• Build Trust through Awareness: Launch interactive financial literacy initiatives tailored to rural contexts, focusing not only on "how to use" but also on why digital payments are secure and beneficial.
• Enhance Grievance Redressal: Provide easily accessible and responsive user support mechanisms (e.g., toll-free helpdesks in local languages) to address transaction failures and user concerns promptly.
b. For Urban Users:
• Streamline Micro-Transactions: Optimize apps and interfaces to enhance the speed, reliability, and ease of frequent low-value transactions commonly made in urban settings.
• Promote Data Privacy Awareness: As urban users are more data-active, raise awareness around personal data protection and encourage responsible use of fintech platforms.
• Incentivize Adoption among Older and New Users: Introduce loyalty programs, cashback, or referral-based onboarding designed to engage digitally reluctant segments, such as the elderly or first-time users.
c. Cross-Cutting User Strategies
• Enhance Inclusivity through Accessibility Features: Ensure platforms are compliant with universal design principles, offering accessibility for users with visual or physical impairments.
• Localize Support Content: Provide video tutorials, chatbot help, and FAQs in regional languages to assist users with troubleshooting and learning.
Limitations
1. Time & Fieldwork: The short duration restricted in-depth field research, especially in rural areas.
2. Scope: The 2021–2024 focus excludes the impact of future policies and infrastructure changes.
3. Data Granularity: Aggregated data masks variations across demographics (income, gender) and districts.
4. Payment Modes: The analysis doesn't differentiate between specific digital payment types like UPI or cards.
5. Data Source: Reliance on secondary data overlooks practical on-the-ground issues like network downtime or fraud.
Future Scope
Future research should employ a mixed-methods approach. Qualitative field studies in states like Uttar Pradesh could provide deep insights into the behavioral barriers and trust issues that quantitative data cannot reveal. Further quantitative work could also attempt to correlate digital transaction data with other development indicators like income levels, literacy, and infrastructure access at a more granular district level.
References
Adhikary, A., Diatha, K. S., & Borah, S. B. (2021). How does the adoption of digital payment technologies influence unorganized retailers’ performance? Journal of the Academy of Marketing Science, 49(5), 882–902.
Indexed at, Google Scholar, Cross Ref
Afjal, M. (2023). Bridging the financial divide: A bibliometric analysis on the role of digital financial services within FinTech. Humanities and Social Sciences Communications, 10(1), 645.
Al-Dmour, A., Al-Dmour, H. H., Brghuthi, R., & Al-Dmour, R. (2021). Technology acceptance dynamics and adoption of e-payment systems: Empirical evidence from Jordan. International Journal of E-Business Research, 17(2), 61–79.
Indexed at, Google Scholar, Cross Ref
Bhatnagar, R., & Singh, S. (2021). Digital literacy and payment adoption in rural India: A field perspective. South Asian Journal of Development Studies, 18(2), 134–152.
Chakraborty, R., & Dey, M. (2022). Trust and technology in rural fintech adoption: A socio-technical approach. Information Technology & People, 35(4), 1023–1045.
Das, P., & Singh, K. (2020). Gendered access to digital finance: Evidence from rural Uttar Pradesh. Journal of Development Economics, 145, 102471.
Devarajan, M., &Sasikaladevi, N. (2020). A secured signcryption scheme for e-payment system using hyper elliptic curve. Journal of Intelligent & Fuzzy Systems, 39(6), 8237–8247.
Indexed at, Google Scholar, Cross Ref
Khan, M. Y., Zuhairi, M. F., & Ali, T. (2019). An extended access control model for permissioned blockchain frameworks. Wireless Networks, 26(8), 4943–4954.
Khera, M., & Wagle, S. (2023). Building trust in rural digital finance: A collaborative model. Indian Journal of Public Policy & Governance, 10(1), 88–107.
Krishna, B., Krishnan, S., & Sebastian, M. P. (2023). Examining the relationship between national cybersecurity commitment, culture, and digital payment usage. Information Systems Frontiers, 25(6), 1713–1741.
Indexed at, Google Scholar, Cross Ref
Madhuri, S., & Nagalakshmi, V. (2023). A novel blockchain strategy for third party aware crosschain transaction framework. Wireless Personal Communications, 131(6), 2897–2917.
Mandal, S., Mohanty, S., & Majhi, B. (2016). Design of electronic payment system based on authenticated key exchange. Electronic Commerce Research, 16(4), 359–388.
Mattsson, C. E. S., Criscione, T., & Takes, F. W. (2023). Circulation of a digital community currency. Scientific Reports, 13(1), 5864.
Narayan, V., Rao, A., & Pal, J. (2023). Assessing the efficacy of PMGDISHA in enhancing rural digital capacity. Economic and Political Weekly, 58(3), 25–30.
Niankara, I., & Traore, R. I. (2023). The digital payment–financial inclusion nexus and payment system innovation within the global open economy during the COVID-19 pandemic. Journal of Open Innovation: Technology, Market, and Complexity, 9(4), 100173.
Omotoye, A. M., Farinloye, T., Özkan, B., & Altinay, L. (2024). Bridging the digital divide: Consumer engagement with transportation payment systems. Journal of Consumer Behaviour, 23(3), 567–582.
Pandey, B., Reba, M., Joshi, P. K., & Seto, K. C. (2020). Urbanization and food consumption in India. Scientific Reports, 10(1), 17241.
Pradhan, S., & Dutta, R. (2022). JAM trinity and active usage: A reality check in eastern India. Journal of Economic Policy & Research, 17(1), 44–60.
Rao, M., & Mathews, S. (2020). Digital divergence: Urban vs. rural fintech adoption in Karnataka. Asian Journal of Digital Economy, 5(2), 101–118.
Sharma, P., Jindal, R., & Borah, M. D. (2023). A review of smart contract-based platforms, applications, and challenges. Cluster Computing, 26(1), 395–421.
Indexed at, Google Scholar, Cross Ref
Received: 19-Jul-2025, Manuscript No. AMSJ-25-16094; Editor assigned: 20-Jul-2025, PreQC No. AMSJ-25-16094(PQ); Reviewed: 10- Aug-2025, QC No. AMSJ-25-16094; Revised: 27-Aug-2025, Manuscript No. AMSJ-25-16094(R); Published: 12-Sep-2025
