Research Article: 2023 Vol: 24 Issue: 3
The Impact of Introductory Courses in Economics on Student Attitudes with an Emphasis on Honors College Students
James Ullmer, Western Carolina University
Kong Chen, Western Carolina University
Citation Information: Ullmer, J., & Chen, K. (2023). The impact of introductory courses in economics on student attitudes with an emphasis on honors college students. Journal of Economics and Economic Education Research, 24(3), 1-11.
Abstract
This research uses a pre and post survey to examine changes in student attitudes toward economics during a semester of introductory economics. The sample consisted of three classes of principles of microeconomics—a traditional class open to the entire student body, a strictly Honors course, and an online class of introductory microeconomics. Four measures of student attitude were developed and assessed. We show that undergraduate student attitudes toward economics can be favorably influenced because of their experiences in a principles of microeconomics course. Also, the impact on student attitudes seems to be more pronounced among Honors students than in the general student body. Finally, and most significantly, Honors students enrolled in a strictly Honors course have a larger positive change in attitude—statistically significant in two of the four metrics measured—than their cohorts in a regular face-to-face class or online principles course.
Keywords
Likert scale, Cronbach’s alpha, General Linear Model (GLM), 2x2 mixed ANOVA.
JEL Classifications
A22, C12, C83
Introduction
Undergraduate students often have apprehension concerning economics before enrolling in their first principles course. This anxiety is primarily caused by their negative attitudes that are mostly attributable to course reputation gained from the student population (Benedict & Hoag, 2002). In that a microeconomics and/or macroeconomics course in principles is often the first and may be the only exposure undergraduate students have to the discipline, it is incumbent that these classes are taught in such a manner as to address the issue of student attitudes.
University honors programs offer honors students specialized advantages such as smaller class size, specialized advising, scholarships, and separate residential housing Campbell (2005) These benefits require sizable financial support from the colleges and universities that offer honors programs. In the present environment of budgetary constraints at universities. there has been discussion as to whether the benefits outweigh the costs. Those researchers arguing that honors programs are more than worth the costs cite the value they offer the university as an institution, honors student in the program, and finally, the non-honors students enrolled in the university (Cosgrove, 2004). Regarding the latter, because honors students take a significant portion of their coursework—approximately 75%—in non-honors courses academic administrators argue that non-honors students’ education is greatly enhanced by exposure to honors students in these classes (Clauss, 2011).
Research on honors students is often based on comparisons between various groups of students with similar college entrance test scores (Cosgrove, 2004; Rinn, 2007; Shushok, 2006). These studies focus on academic achievement and use GPA as a measure. These studies show that honors students earn higher GPAs than their non-honors counterparts (Cosgrove, 2004; Rinn, 2007; Shushok, 2006). Other research focusing more on general student attitudes toward higher education compare honors students with the general population of students. These studies show that honors students are more likely to be grade conscious and to better prepare for class (Long, & Lange, 2002). Also, findings indicate that students in honors programs are more likely to apply a higher academic effort and have more academic interaction with peers than students in the general population (Seifert et al., 2007; Brimeyer et al., 2014).
This study is important in that it focuses on student attitudes toward economics and how those dispositions may change during the semester because of their experiences in a principles course in economics. Nearly thirty years ago a pre and post survey was employed to measure changes in overall attitude and proficiency in economic subject matter (Soper & Walstad, 1983). Twenty years later another attempt using correlation analysis was used to measure such changes in attitude (Brock, 2011). This research updates and expands on those papers in significant ways by exploring changes among and between different populations of undergraduate students1.
The study employs a pre and post survey to measure changes in student attitudes. The student metrics being measured are ability to comprehend economics, usefulness of economics, interest in economics, and a global metric assessing the students’ overall attitude toward economics. With that in mind, the primary purposes of this study are threefold: 1) to determine whether there are changes in undergraduate student attitudes toward economics as a result of their experiences in a principles of microeconomics course; 2) to examine whether student changes in attitudes toward economics vary between honors students and non-honors students; 3) to discover whether the class platform—online class, face to face class or face to face honors course—might affect the attitudes of honors students2.
Questionnaire Development and Reliability
In the fall semester of 2016, three classes of principles of microeconomics were taught at Western Carolina University by the same male professor of economics. Each section covered the familiar material that is taught in a traditional introductory course in microeconomics. Each class also used the same textbook—Microeconomics, 20th edition, McConnell, Brue, and Flynn. However, each section was different in either platform and/or audience. There was an online class of thirty-four students comprised primarily of distance learners, many of whom were non-traditional students and some of whom were honors students. There was a face-to-face class consisting of forty-seven traditional undergraduate students, a few of whom were honors students. Finally, there was a face-to-face honors course of twenty-eight students, who were all members of the Honors College at Western Carolina University3.
A survey using a 7-point Likert Scale was developed to assess student attitudes toward economics. A 7-point scale was chosen because it has been proven to provide a more accurate assessment a respondent’s true evaluation of an item than a 5-point scale, or a scale with more categories (Finstad, 2010). The questionnaire consisted of twenty statements—each representing a positive predisposition toward some aspect of economics. Based on these statements, three variables were developed to measure students’ attitudes in three distinct areas; Ability to comprehend economics, Usefulness of economics, and Interest in economics. A fourth global metric, Overall attitude toward economics (Global), was also calculated using all twenty questions of the survey. The questionnaire also included one open-ended question in which students expressed their general impressions and attitudes toward economics. The survey was administered in such a way as to ensure the anonymity of students.
The survey was administered online using Qualtrics Survey Software. Students in each of the classes were asked to respond from 1, strongly disagree, to 7, strongly agree to each proposition in the survey. To measure student attitudes toward economics at the beginning of the semester, the questionnaire was made available to students in all three classes during the first two weeks of the Fall semester before any student assessment occurred in terms of quizzes or exams. Then, to assess student feelings toward economics at the end of the semester, that same survey was administered during the final two weeks of the Fall semester before finals. To encourage students to complete the survey, extra-credit was made available on a class-by-class basis for both the pre and post surveys. A bonus of five per-cent of total possible points was awarded for a response rate over ninety per-cent and three per-cent for a response rate of between seventy and ninety percent. All classes had response rate of approximately eighty-seven per-cent in both surveys.
A reliability test, Cronbach’s α, was employed using SPSS 24 to test the internal consistency of the four metrics that were being measured by the questions in the survey. On the pre-test data, the three variables: Ability to comprehend economics; Usefulness of economics; and Interest in economics had a Cronbach’s α of 0.845, 0.859, and 0.884, respectively, indicating a relatively high reliability. On the global measure, Overall attitude toward economics, Cronbach’s α equaled 0.924, indicative of an extremely strong reliability. For the post-test data, statistically significant consistencies were revealed as well. Cronbach’s α equaled 0.925, 0.880, and 0.930 for Ability to comprehend economics, Usefulness of economics, and Interest in economics, respectively. The comprehensive metric, Overall attitude toward economics, had a Cronbach’s α of 0.959, demonstrating exceptionally strong reliability.
Model and Results
Having confirmed the reliability of the four measures of student attitudes, statistical tests were used to analyze the data. A General Linear Model (GLM) with repeated measures—in this study, a 2 x 2 mixed ANOVA—was employed in the statistical analysis. This technique enables a researcher to build a linear relationship between the response variable and the categorical predictors. This process is made possible by using a link function which connects the response variable to the linear model. The model included two equations. The first equation measured the between-subject factor. The second equation captured the within-subject factor—time—i.e., student attitudes at beginning of semester compared to student attitudes at the conclusion of the semester. With that in mind, the following equations were specified.
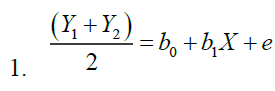
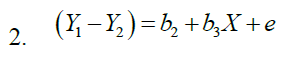
Where Y1 is the pre-test scores (i.e., comprehension of economics, usefulness of economics, interest in economics, and overall attitude toward economics) and Y2 the corresponding post-test scores. The variable X is the dichotomous between-subjects factors (i.e., whether or not a student is in the Honors College, or whether or not an honors College student is in the honors class or in a face-to-face or online class), while e refers to the errors. The coefficient b0 in the first equation represents the grand mean (which is of no interest and hence not interpreted). The coefficient b1 measures the main effect of the between-subjects factor. The coefficient b2 in the second equation represents the effect of time, as given by pre- and post-test results, while b3 measures the interaction effect, which is not pertinent in this analysis.
The first test assessed the entire sample of students—both honors and non-honors. The null hypothesis was—Ho: (Y2 - Y1 = 0)—indicating that the post-test scores were not significantly different than the pre-test scores That is, the students’ experiences in the principles course did not significantly alter their attitudes toward economics. To test the hypothesis, it was necessary to use pairwise comparisons in the model. Student identifiers from the demographic portion of the survey were used to detect the respondents and pair their pre and post responses. These characteristics included a student’s; major, minor, year in school, gender, and whether they were enrolled in the Honors College.
The descriptive and inferential statistics for that analysis are displayed in Table 1 below. From the descriptive statistics, it was evident that student attitudes became more favorable toward economics during the semester because the mean scores were higher in the post survey than in the pre survey for all four measures of attitude. Nevertheless, in only one parameter, comprehension of economics, is there a statistically significant change in attitude (p-value = 0.003). However, this is an important finding. It indicates that the overall student body became more confident in their ability to learn economic concepts as the result of their experiences in the principle of microeconomic course.
| Table 1 Results of Pre- and Post-Tests for All Students (N = 30) | |||||
| Pre | Post | ||||
| Parameters | M | SD | M | SD | p |
| Comprehension of Economics | 4.66 | 0.76 | 5.26 | 0.89 | 0.003 |
| Usefulness of Economics | 5.37 | 0.97 | 5.60 | 0.99 | 0.327 |
| Interest in Economics | 5.03 | 1.07 | 5.16 | 1.13 | 0.518 |
| Overall Attitude toward Economics | 5.02 | 0.82 | 5.35 | 0.95 | 0.086 |
The next test evaluated honors students and non-honors students as separate samples. Again, the null hypothesis was: Ho: (Y2 - Y1 = 0). The descriptive and inferential statistics for both samples are displayed in Table 2 below. An examination of the mean scores indicates that both populations of students have more favorable attitudes towards economics post semester on all four parameters. However, when comparing the pre and post survey results, only Honors College students have a statistically significant change in any of the four attitude measures. Specifically, Honors College students have a statistically significant change in the comprehension of economics parameter (p-value < 0.001), and the overall attitude toward economics measure (p-value = 0.036). This vital finding indicates that honors college students were significantly more impacted by their experiences in the principles course than the rest of the student-body. For illustrative purposes, Profile plots for the estimated marginal means of both samples are provided in Figure 1 and Figure 2 below. A profile plot is a linear plot in which each point indicates the estimated marginal means of the dependent variable adjusted for any covariate.
| Table 2 Results of Pre-and Post-Tests, Honors College Students vs. Non-Honors College Students | ||||||||||
| Honors (n = 17) | Non-Honors (n = 13) | |||||||||
| Pre | Post | Pre | Post | |||||||
| Parameters | M | SD | M | SD | p | M | SD | M | SD | p |
| Comprehension of Economics | 4.59 | 0.81 | 5.50 | 0.75 | <0.001 | 4.76 | 0.75 | 4.93 | 0.97 | 0.492 |
| Usefulness of Economics | 5.42 | 1.17 | 5.81 | 0.84 | 0.174 | 5.30 | 0.65 | 5.33 | 1.14 | 0.917 |
| Interest in Economics | 5.19 | 1.15 | 5.30 | 1.07 | 0.654 | 4.83 | 0.97 | 4.98 | 1.22 | 0.639 |
| Overall Attitude toward Economics | 5.06 | 0.93 | 5.55 | 0.82 | 0.036 | 4.97 | 0.67 | 5.08 | 1.07 | 0.659 |

Figure 1 Estimated Marginal Means of Overall Attitude Towards Economics

Figure 2 Estimated Marginal Means of Comprehensive of Economics
The final research question examines whether the class platform affects honors students’ attitudes toward economics. The general linear model (GLM) was run on two separate samples of honors students—honors students enrolled in the Honors class was compared to those honors students enrolled in the Face-to-Face or the online class. Of the 17 Honors College students who were able to be identified, 11 were enrolled in the Honors course and six in face-to-face or online class. Again, the null hypothesis was—Ho: (Y2 - Y1 = 0)—indicating that student experiences in the principles course did not significantly affect their attitudes toward economics.
Table 3 displays the descriptive and inferential statistics for both groups of students A comparison of sample means indicates that honors college students enrolled in the honors course had higher mean scores in all the attitude measures in the post survey than the pre survey. Honors College students enrolled in the Honors class experienced greater positive changes in attitude in all four measures than those enrolled in face-to-face or online classes. In fact, the interest in economics measure declined for Honors College students enrolled in face-to-face and online classes.
| Table 3 Honors Students in Honors Class vs. Honors Students in Face-to-Face and Online Classes | ||||||||||
| Honors class (n = 11) | Face-to-Face and online (n = 6) | |||||||||
| Pre | Post | Pre | Post | |||||||
| Parameters | M | SD | M | SD | p | M | SD | M | SD | p |
| Comprehension of students Economics | 4.45 | 0.69 | 5.53 | 0.47 | 0.001 | 4.83 | 1.02 | 5.45 | 1.16 | 0.089 |
| Usefulness of Economics | 5.39 | 1.32 | 5.99 | 0.60 | 0.166 | 5.48 | 0.94 | 5.50 | 1.15 | 0.969 |
| Interest in Economics | 5.12 | 1.19 | 5.39 | 0.85 | 0.498 | 5.31 | 1.19 | 5.14 | 1.47 | 0.761 |
| Overall Attitude toward Economics | 4.98 | 0.91 | 5.65 | 0.57 | 0.049 | 5.20 | 1.04 | 5.38 | 1.20 | 0.685 |
However, when comparing the pre and post survey results, only Honors college students enrolled in the honors course have a statistically significant change in any of the attitude measures. Honors College students had a statistically significant change in the comprehension of economics parameter (p-value = 0.001), and the overall attitude toward economics measure (p-value = 0.049). This indicates that those honors students enrolled in the honors course were more confident in their ability to understand economic concepts at the end of the semester. Also, their overall disposition toward economics improved significantly. For honors students enrolled in either the online or face-to-face classes, there were no statistically significant changes in any of the four variables measuring attitude toward economics during the semester. The estimated marginal means for comprehension of economics and the global measure are depicted for both samples of students in Figure 3 and Figure 4 above. There are two likely reasons for this significant difference in changes in attitude between honors students enrolled in honors courses and those in a traditional course in principles of microeconomics: 1) The honors course moves at a faster pace and has more of a seminar feel to it in that there is more discussion of concepts and application of principles; 2) There are five written assignments in the honors course, where students comment on five separate blog posts on designated economic websites--Greg Mankiw's blog (gregmankiwblogspot.com), Marginal Revolution (www.marginal revolution.com), and Econ Log (econlog.econlib.org). This gives students an opportunity to interact with students from other universities and professional economists on important current issues.

Figure 3 Estimated Marginal Means of Comprehension
Figure 4 Estimated Marginal Means of General Attitude
Conclusion
This research demonstrates that undergraduate student experiences in a principles of microeconomics course can favorably affect their attitudes toward the discipline. This appears to be the case for the overall undergraduate student body and is even more pronounced for honors students, especially those enrolled in strictly honors courses. Honors students enrolled in strictly honors classes have more pronounced positive changes in attitude than those enrolled in regular face-to-face classes or on-line classes. The writing component of the honors class, as well as the more seminar-like ambiance of the course appear to be the ostensible reasons. In an era of tight budgets, this provides strong empirical evidence for the value of offering honors courses in introductory economics to honors college students.
While the open-ended question provided some anecdotal evidence for successful teaching approaches, further research is needed to explore these issues and to discover those pedagogical techniques that lead students to have more positive predispositions after a semester in a principles of economics class. Moreover, a subsequent study with more observations and thus more degrees of freedom would be beneficial in extending this research. Finally, while still insuring student anonymity, it would be most useful to use the built-in IP address feature in Qualtrics as an additional respondent identifier.
End Notes
1The Honors College at Western Carolina University is very selective and rated in the top ten nationally in undergraduate research. Presently, there are approximately 1300 students enrolled in the Honors College.
2Refer to Appendix A1 & A2 for the Questionnaire: The variable Ability to Comprehend Economics is measured by items 1, 2, 3, 4, 10, 14, and 20. The variable Usefulness of Economics is measured by items 7, 9, 11, 12,15, 17, and 18. The variable General Interest in Economics is measured by items 5, 6, 8, 13, 16, and 18.
3A Cronbach’s alpha from 0.65 – 0.8 indicates that the measure is reliable. A Cronbach’s alpha greater than 0.8 is an indication of high reliability for the metric.
Appendix A1 Questionnaire
| Appendix A2 Indicate Your Opinion on Each of the Following | |||||||
| Strongly disagree | Disagree | Somewhat disagree | Neither agree nor Disagree | Somewhat agree | Agree | Strongly Agree | |
| 1. My current understanding of economics is good. | Ο | Ο | Ο | Ο | Ο | Ο | Ο |
| 2. I am able to grasp the essence of current economic issues | Ο | Ο | Ο | Ο | Ο | Ο | Ο |
| 3. I am able to understand and apply the math in economics. | Ο | Ο | Ο | Ο | Ο | Ο | Ο |
| 4. Principles of Economics are easy to understand. | Ο | Ο | Ο | Ο | Ο | Ο | Ο |
| 5. I find economics interesting | Ο | Ο | Ο | Ο | Ο | Ο | Ο |
| 6. I enjoy reading about topics in economic. | Ο | Ο | Ο | Ο | Ο | Ο | Ο |
| 7. Economic models are helpful in understanding economic concepts. | Ο | Ο | Ο | Ο | Ο | Ο | Ο |
| 8. I would like to learn more economics. | Ο | Ο | Ο | Ο | Ο | Ο | Ο |
| 10. I feel at ease with economics | Ο | Ο | Ο | Ο | Ο | Ο | Ο |
| 11. Economics is a valuable tool in business decision-making | Ο | Ο | Ο | Ο | Ο | Ο | Ο |
| 12. Economics is a valuable tool in personal decision-making | Ο | Ο | Ο | Ο | Ο | Ο | Ο |
| 13. Economics can be very exciting. | Ο | Ο | Ο | Ο | Ο | Ο | Ο |
| 14. I could become really proficient in economics | Ο | Ο | Ο | Ο | Ο | Ο | Ο |
| 15. I like using economic concepts to analyze real-life situations. | Ο | Ο | Ο | Ο | Ο | Ο | Ο |
| 16. I would like to have more opportunity to learn about economics. | Ο | Ο | Ο | Ο | Ο | Ο | Ο |
| 17. To understand political issues, one needs some knowledge of economic principles. | Ο | Ο | Ο | Ο | Ο | Ο | Ο |
| 18. I find economic issues stimulating. | Ο | Ο | Ο | Ο | Ο | Ο | Ο |
| 19. Graphs in microeconomics are important tools for understanding economic principles. | Ο | Ο | Ο | Ο | Ο | Ο | Ο |
| 20. I understand the economic way of thinking | Ο | Ο | Ο | Ο | Ο | Ο | Ο |
References
Benedict, M. E., & Hoag, J. (2002). Who's afraid of their economics classes? Why are students apprehensive about introductory economics courses? An empirical investigation. The American Economist, 46(2), 31-44.
Indexed at, Google Scholar, Cross Ref
Brimeyer, T. M., Schueths, A. M., & Smith, W. L. (2014). Who benefits from honors: An empirical analysis of honors and non-honors students’ backgrounds, academic attitudes, and behaviors.
Brock, G. J. (2011). Student attitudes and knowledge change in an introductory college economics course. The Georgia Social Studies Journal, 1(1), 45-61.
Campbell, K.C. (2005). Allocation of resources: Should honors programs take priority?. J Collegiate Honors Council, 6(1): 95-103.
Clauss, J. J. (2011). The benefits of honors education for all college students.
Cosgrove, J. (2004). The impact of honors programs on undergraduate academic performance, retention, and graduation.
Finstad, K. (2010). Response interpolation and scale sensitivity: evidence against 5-point scales. Journal of usability studies, 5(3), 104-110.
Long, E. C., & Lange, S. (2002). An exploratory study: A comparison of honors and nonhonors students. The National Honors Report, 23(1), 20-30.
Rinn, A. N. (2007). Effects of programmatic selectivity on the academic achievement, academic self-concepts, and aspirations of gifted college students. Gifted Child Quarterly, 51(3), 232-245.
Indexed at, Google Scholar, Cross Ref
Seifert, T. A., Pascarella, E. T., Colangelo, N., & Assouline, S. G. (2007). The effects of honors program participation on experiences of good practices and learning outcomes. Journal of College Student Development, 48(1), 57-74.
Indexed at, Google Scholar, Cross Ref
Shushok, F. (2006). Student outcomes and honors programs: a longitudinal study of 172 honors students 2000-2004. Journal of the National Collegiate Honors Council--Online Archive, 15.
Soper, J. C., & Walstad, W. B. (1983). On measuring economic attitudes. The Journal of Economic Education, 14(4), 4-17.
Indexed at, Google Scholar, Cross Ref
Received: 08-May-2023, Manuscript No. JEEER-23-13573; Editor assigned: 10-May-2023, Pre QC No. JEEER-23-13573 (PQ); Reviewed: 24-May-2023, QC No. JEEER-23-13573; Published: 27-May-2023