Research Article: 2018 Vol: 19 Issue: 3
The Impact Tools of Financial Policy as Determined of Iraq's Economic Growth Rates for the Period (2003-2016)
Adel Salam Al-Hashimi, Wasit University
Hatem Kareem Al-Qurayshi, Wasit University
Shaymaa Fadhel Al-Zubaydi, Wasit University
Abstract
Keywords
Financial Policy Tools, Economic Growth, Economic Reform Programs.
Introduction
The tools of financial policy are the most important activation economic tools that have a role in influencing the economic for any country, It also co-ordinates relations with other economic policies. According to the developed stages of economic schools by sequence as classical which its characterized of balancing the budget and Sustainability the balancing level, and then moved to the stage of intervention in the thought of the Keynesian school that the make fiscal policy transition from the neutrality to the direct influence in economic activity that caused stimulating demand through the increase government spending, and then the tools of fiscal policy have developed into the central planning stage in socialist thought as a result of the expansion of the role and functions of the state, lead the expansion of tools financial, which not covering public expenditures, but there are important financial instruments have a clear impact in economic activity such as redistribution of income and the achievement of social justice and others.
Financial policy is defined as the use of expenditure and government revenue to influence the of aggregate effective demand in accordance with the common economic situation to increase economic growth rates and redistribute income among individuals (Kneller et al., 1999), and can be defined as direct intervention by the financial authority to influence income and employment levels and GDP, through the using of fiscal policy means of public expenditure and public revenues (Fatás & Mihov, 2001) in order to increase public welfare and control of financial resources (Besley & Smart, 2007). The fiscal policy uses two main tools to achieve its general objectives, which are the tools of the other (public expenditure and revenues), the general revenues and expenditures are the main means of the state's fiscal policy (Hemming et al., 2002), the public expenditures and revenues relate to the quantities required to perform the state's financial function and to finance the requirements of economic activity and there is a third tool related to the technical organization of these financial quantities and called the general budget (Abu & Mohammad, 2006), Investment plays a big role in determining the rate of economic growth, as each increase in that expenditure represents the addition of new production capacity, the goal of the economic development plans is to achieving an increase in the national income more than the rate of population increase, hence known the importance of investment expenditure due considered it the axis of economic development (Aljanabi & Taher, 1990).
In related at the tools of fiscal policy in Iraq is no less than importance other countries as an effective tool in promoting economic growth rates through the management of the public budget and directing public spending to more effective sides, but the constraints and economic and political crises after 2003 prevented the achievement of the desired goals as well as The expansion of public spending on services and the requirements of such service and investment projects on the one hand, and on the other has directly affected the reality of fiscal policy, which led to a decline in economic growth rates as a result of local and regional political and economic changes And international, And therefore the failure of economic development programs and therefore ineffectiveness of financial policy tools, the protection of the country from the crises that may occur to it especially after the political and economic transformation may contribute to the achievement of economic growth and development, the tools of financial policy is prestigious for the programs Development of key indicators and findings effective solutions to the economic problems and imbalances of different sectors (Alsamaraey & Hana abdel, 2002).
Literature Reveiws
There are a many studies on the tools of policy financial, but its difference accordance to editors and visions as Saad's study under the title “Discretionary Fiscal Policy and Its Impact on Economic Growth in Jordan during the Period 1976-2011. Jordan Journal of Economic Sciences, 2016”, which to aims to investigate the effect of discretionary fiscal policy on economic growth in Jordan during the period (1976-2011) and the results shown the existence of a long run equilibrium relationship between economic growth rates and discretionary fiscal policy variables, and recommended the government should follow a neutral fiscal policy in order to stimulate the economic activity in the long run and reduce the effects of economic slowdown. That is, the government should follow a countercyclical fiscal policy (Altrawna et al., 2016; Ben-Allal, 2013) study which referred “The liberalization of fiscal policy and Economic growth in developing countries its relationship and its success conditions by using simple data for developing countries-Econometrics study under the Dynamic model period 1980-2010” explained the theatrical of fiscal policy liberalization and it relationship with Economic growth and evaluation of effect nature for this policy and which the effective about the economic growth for period 1980-2010 with 56 developing countries states (Ben-Allal, 2013), Othman (2004) study has titled “The Role of Fiscal Policy in Increasing Labor Absorptive Capacity for the Palestinian Economy” that aimed at acquainting with the role of the financial policy adopted be the Palestinian authority in increasing the comprehendible capability for the Palestinian economy through the period 1968-2001, so that it was divided into three periods like the following: (1968-1987), (1978-1996), (1996-2001), whereas volume of that gap during the three periods respectively reached to 24%, 34.4%, 33%, of the acting forces volume. Then the role of tax policy was analyzed in increasing the comprehendible capabilities to the Palestinian economy through studying aims and directions of the tax policy and a group of policies and measures which the policies and measures which the Palestinian followed to influence the Palestinian tax system, and the capital formation reached to 37.7% of the whole local income due increase of public investment importance as the public investment rate rose to the public expenditure volume from 16% in 1996 to 20% in 2001, in comprehending great volume employment in the Palestinian economy during 1996-2001. And in spite of this the Palestinian authority remained limited in the field of public expenditure because of the limits imposed by the temporary stage agreements from one side and measured of occupation of the other (Othman, 2004), and that the “Public expenditure and Economic growth” studied by Ahmed et al., 2016. Which the aimed to a known the relationship between the public expenditure and developed of economic growth, to order that divided into sides the 1st theory side which explained the importance concepts and based of public expenditure with economic growth included economic thought, the public expenditure indicated of developed and advanced the countries, through the optimal control of expenditure which allowed of state to economic growth achieving, and other side it taken the reality of Algeria during 1990-2014, and though the transition period by the opportunity of oil price rising, and adopted the agreements and programs of developing especially through the period 2001-2004, the completely support growth program through 2005-2009, that lead to public expenditure level and achieving the growth rates -2.2% to 7.2% during the period 1990-2014 (Ahmed et al., 2016).
Model
The model can be characterized by diagnosing both the dependent variable (Y) and the independent variables (X1, X2 ... XK) which affect the dependent variable according to the logic of economic theory by using multiple linear regressions and describe the relationship between the variables studied as a following:

The model data is as follows.
The dependent variables can be explained in the Econometrics model:
1. The dependent variable (Y): Economic growth in Iraq expressed in GDP (Million Dinars).
2. Independent variable (X1): Public revenues (Million Dinars).
3. Independent variable (X2): Public expenditure (Million Dinars).
4. Independent variable (X3): Investment (Million Dinars).
5. The Dummy variable (X4): Includes crises and geopolitical factors given number (1) if there is a crisis and (0) if not a crisis.
Stability For The Studied Variables
1. The dependent variable (Y) GDP: The variable series were plotted in Figure 1 and found to be unstable over time because the series direction took an upward trend, the variable series was checking by the (Dickey-Fuller) test, under the level (5%) and the probability value is greater than (5%), This indicates that the series is contained on the unit root and that it is unstable as shown in Shape (6), It's also noted in Table 5 that value of KPSS test was (0.549148) greater than the critical value (Kwiatkowski) at a significant level (5%) of (0.463000), This means that we accept the alternative hypothesis which it determines the root of any unit The string is unstable, and in the Table 6 noted the value of the test statistic (PP) its (-1.522004) smaller than the critical value (Mackinnon) at the level of significance (5%) and the (-3.119910) This means that we accept the hypothesis of the existence of a root unit.
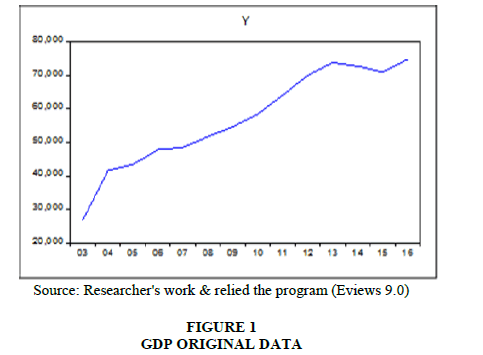
Figure 1: GDP Original Data
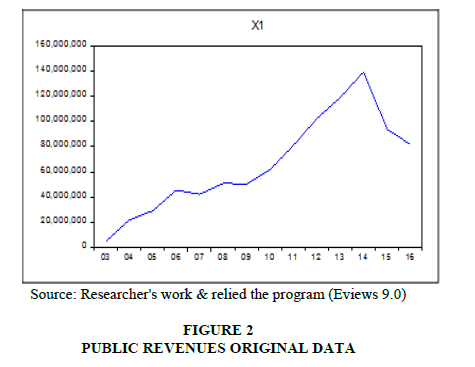
Figure 2: Public Revenues Original Data
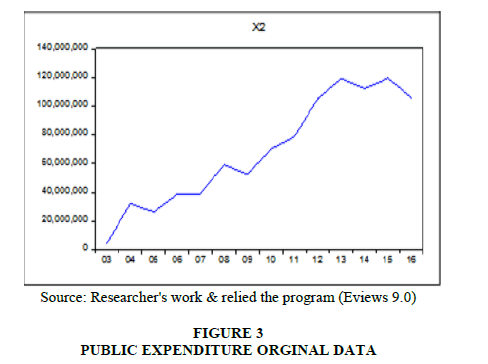
Figure 3: Public Expenditure Orginal Data
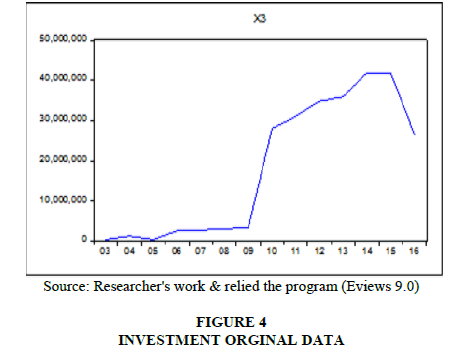
Figure 4: Investment Orginal Data
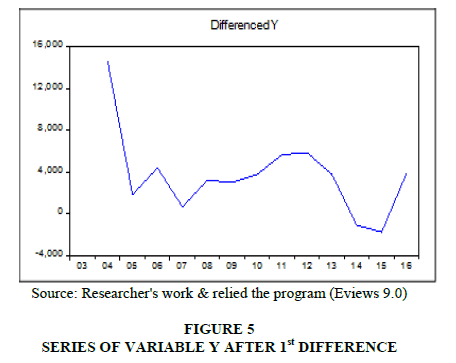
Figure 5: Series Of Variable Y After 1st Difference
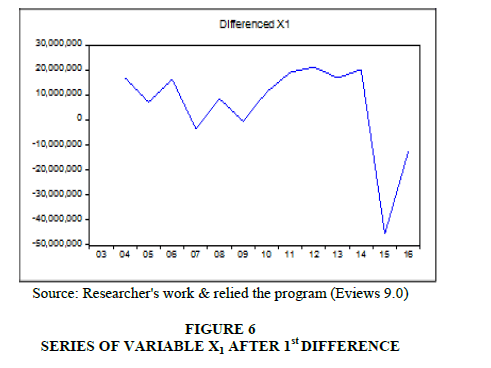
Figure 6: Series Of Variable X1 After 1st Difference
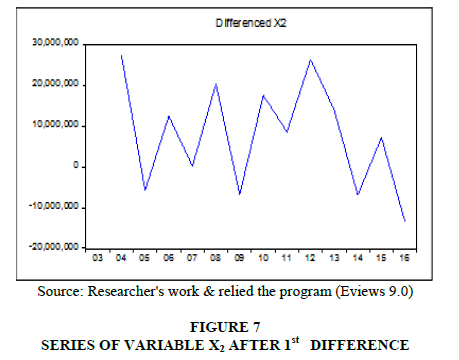
Figure 7: Series Of Variable X2 After 1st Difference
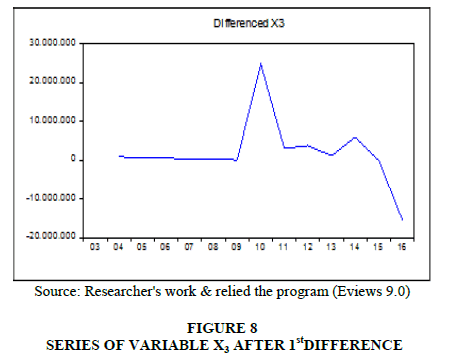
Figure 8: Series Of Variable X3 After 1st Difference
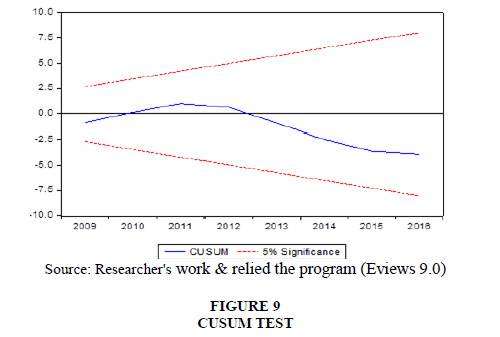
Figure 9: Cusum Test
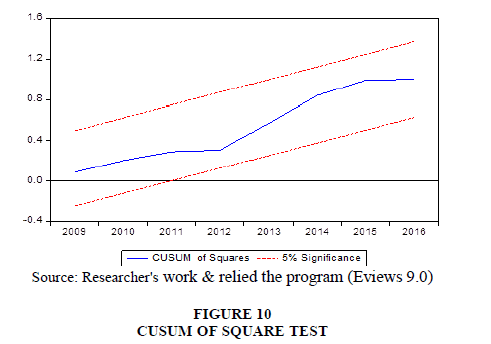
Figure 10: Cusum Of Square Test
2. The independent variable (X1) public revenue: The variable series (X1) was plotted as Figure 2 and was found to be unstable over time due to a general trend over time, as well as Its average is not stable through the time and it takes an upward trend, The variable series it's tested with (Dickey-Fuller) and its found that the t-table (-1.648639) it greater than t-calculated (3.119910) at a significant level (5%), The probability value is greater than (5%) which means there is a unit root in the series as well as is unstable as shown in Shape (7), at the related context, Table 5 shown the value of KPSS (0.494151) is greater than the critical value (Kwiatkowski) at a significant level (5%) of (0.463000). This means that we accept the alternative hypothesis which it determines that a series it's unstable. The value of the test statistic (PP) was (-1.648639) smaller than the critical value (Mackinnon) at the level of significance (5%) and the (-3.119910) this means that we accept the hypothesis of the existence of a root unit as Table 6.
3. The independent variable (X2) public expenditure: The series (X2) its drown as shape (3) and found its unstable over time because the series direction is not constant around it means through the time, as the series is tested by using (Dickey-Fuller) and shown The value of t (tabular) (-1.500408) is greater than (t) calculated (3.119910) at a moral level (5%) and the probability value is greater than (5%) which indicates that the series is unstable that is explained in shape (8).
4. The independent (X3) investment: It explained that the series also unstable as Shape (4), and the series was tested by using (Dickey-Fuller), the t-table (-1.099604) which greater than the t-calculated (- 3.119910) under a significant level (5%) It is a sign to non-stability as shown in shape (9), And so it is with the value of KPSS statistic is (0.485401) when we compare it with the critical value (Kwiatkowski) with a significance of (5%) and the maximum (0.463000) it's greater, this indicates to a unit root and the series is unstable. In a related aspect, the value of the (PP) test statistic was (-1.086157) and is smaller than the critical value (Mackinnon) at a significant level (5%) and the (-3.119910) It is refer to the existence unit root and the series it's unstable.
To obtain stable series, must be differences for the studied variables, as following tables:
VEC Model
The estimated parameter of the correction limit in the variable (X1), is significant, and positive (0.411362), this means that error correction limit can to help as for explain the changes in Y at the long run and indicates that is a causal relationship in the long run from (X1) toward (Y), the Positive value means a positive relationship between two variables X1 explains the change in the value of Y by 23% and the rest is back to other factors.
In addition, we note the value of the adjustment coefficient for correction of variable (X2) is significant also and positive at (0.988268), this shown the error correction limit can help as to explain the changes in Y, i.e. there is a causal relationship in the long term (Y), with positive value is a positive relationship between two variables. X2 explains the change in the value of Y by 78% and the rest is back to other factors.
And the value of the correction adjustment coefficient in the variable (X3) is significant and negative at (0.074402), this means the error correction limit can help as to explain the changes in Y, which means that there is a causal relationship in the long run from (X3) towards Y; the negative value means a negative relationship between two variables. X3 explains the change in the value of Y by 24% and the rest is back to other factors, as the following table:
Results And Analysis
After the stability tests became all the independent variables (X1, X2, X3) in the model and its stable in the first difference i.e., that means consisted relationship of co-integration at long run in 1st class I (I) between the independent variables at the effect on the dependent variable (y) therefore will testing the relationship of co-integration using Johansen-Giselius (Birău & Trivedi, 2013).
Based at the results of the Trace test, showed the calculated value of the maximum likelihood rate equal (89.00238) it's greater than the critical value of (69.81889) at a significant level of 5%, that means we are reject the null hypothesis that (r=0), and we accept the alternative hypothesis that indicates there are a number of co-integration vectors greater than zero (r=1), that confirms a co-integration relationship of the studied variables. Therefore, will estimating the error correction model through will estimating the equation of the model according to the estimated lag period in the stability of the time series as shown in Table 12.
The Economic Interpretation
The Table 12 shown a correspondence with hypotheses economic logical as a follows:
1. The results of the estimation showed the positive relationship between the public revenues (X1) and the growth rate in Iraq (Y), In other words, the change in public revenues by one unit will shift the growth rate by (3.6205), and with related side the Public revenues have led to a greater increase in public expenditure towards economic development programs.
2. The results explained a positive relationship between the public expenditure (X2) and the rate of growth in Iraq (Y) due positive signal that will be lead to change in the amount of expenditures by one unit will effects to a change in growth rate by (0.000412), to achieving economic development through directing these expenditures to more effective aspects linked to economic development.
3. On the other hand, the estimated model showed the positive relationship between the size of the investment (X3) and the growth rate in Iraq (Y) by proving the positive sign. The change in the size of the investment by one unit will shift the growth rate in Iraq by (0.000159).
4. The results of the analysis also showed the inverse relationship between the Dummy variable (X4), which represented crises and other political factors and the rate of growth in Iraq (Y), In other words, any change of one unit in the Dummy variable will change the rate of growth in Iraq by (-3126.508), And in the nature of the situation and under the crises always there economic unstable situations followed by political instability and the result of confusion in the process of financing economic development programs.
For the related the econometrics side, the R2 showed the explanatory capacity of 96% to explain the changes that may occur in the independent variable due to the dependent variables, and that (4%) due to other factors not included in the model can be included under the error limit (u). The significance and the ability of the independent variables it's also examined in the interpretation of the changes in the dependent variable relied on the t-calculated and corresponding value t-table, and the proven the estimated parameters  its high significant in accordance with the statistical value t-calculated (2.017) and compared with the t-table (0.975) and that the probability value (p-value) which is less than (0.05).
For the moral knowledge of the estimated model as a whole by means of F and computed in the table at a significant level (0.05), it was found that the calculated F is greater than the scale and equal to 2.87=(0.95.3.43) F, (F) is less than (0.05). This means that the model is statistically acceptable, so the estimated formula of the model is as follows:

Through of the analysis which showed that the estimated model without autocorrelation problem among the error variable values by depend (Durbin-Watson) test of the estimated model its amount to (1.836720) when compared with the value of the upper (dU) and lower extremities (dL) at a significant level (0.05) and the number of variables (K=4) and n=14, it was observed that all the calculated values are in the (rejection zone) i.e. the not any autocorrelation, which confirms the model's integrity from the autocorrelation problem.
Cusum & Cusumsq Tests
| Table 1 Variables Of Financial Policy Instruments In Iraq For The Period (2003-2016) |
|||||
| Years | GDP | Public Expenditure | Public Revenues | Investment | Dummy Variables |
| 2003 | 26990.4 | 4827493 | 4596000 | 417120 | 1 |
| 2004 | 41607.8 | 32117491 | 21729106 | 1287358 | 0 |
| 2005 | 43438.8 | 26375175 | 28958608 | 417120 | 0 |
| 2006 | 47851.4 | 38806679 | 45392304 | 2649402 | 0 |
| 2007 | 48510.6 | 39031232 | 42064530 | 2792375 | 0 |
| 2008 | 51716.6 | 59403375 | 50775081 | 3205591 | 1 |
| 2009 | 54720.8 | 52567025 | 50408215 | 3273660 | 0 |
| 2010 | 58495.9 | 70134201 | 61735312 | 28064790 | 0 |
| 2011 | 64159.9 | 78757666 | 80934790 | 31057650 | 0 |
| 2012 | 70034.7 | 105139576 | 102326898 | 34835416 | 0 |
| 2013 | 73830.0 | 119127556 | 119296663 | 35996752 | 0 |
| 2014 | 72736.2 | 112192125 | 139640628 | 41960842 | 1 |
| 2015 | 70990.3 | 119462429 | 94048364 | 41831416 | 1 |
| 2016 | 74867.6 | 105895722 | 81700803 | 26414564 | 1 |
Source: CBI Reports: 2006, 2009, 2014, World Bank through the following link:
www.albankaldwly.statisties
| Table 2 (DICKY-FULLER) Test For GDP |
||
| Null Hypothesis Y has a unit root, Exogenous: constant Lag Length: 0 (Automatic-based on SIC, max lag=2 |
||
| t-Statistic | Prob. | |
| Augmented Dickey-Fuller test statistic | -2.526231 | 0.1320 |
| Test critical values: 1% level | -4.057910 | |
| 5% level | -3.119910 | |
| 10% level | -2.701103 | |
Source: Researcher's work & relied the program (Eviews 9.0).
| Table 3 (DICKY-FULLER) Test for X1 Original |
||
| Null Hypothesis: X1 has a unit root, Exogenous: Constant Lag Length: 0 (Automatic-based on SIC, max lag=2 |
||
| t-Statistic | Prob. | |
| Augmented Dickey-Fuller test statistic | -1.648639 | 0.4319 |
| Test critical values: 1% level | -4.057910 | |
| 5% level | -3.119910 | |
| 10% level | -2.701103 | |
Source: Researcher's work & relied the program (Eviews 9.0).
| Table 4 (DICKY-FULLER) |
||||||
 |
Original Variables | Prob. | At 1st Difference | Prob. | ||
| Tcal | Ttab (5%) | Tcal | Ttab (5%) | |||
| GDP | -2.526231 | -3.119910 | 0.1320 | -5.057516 | -3.212696 | 0.0035 |
| PUBLIC REVENUES | -1.648639 | -3.119910 | 0.4319 | -2.605025 | -1.974028 | 0.0141 |
| PUBLIC EXPENDITURES | -1.500408 | -3.119910 | 0.5017 | -4.740590 | -3.144920 | 0.0037 |
| INVESTMENT | -1.099604 | -3.119910 | 0.6816 | -2.467265 | -1.974028 | 0.0187 |
Source: Researcher's work & relied the program (Eviews 9.0).
| Table 5 KPSS Test |
||||
|
Original variables | At 1st Difference | ||
| LM | 5% | LM | 5% | |
| GDP | 0.572552 | 0.463000 | 0.290317 | 0.463000 |
| PUBLIC REVENUES | 0.549148 | 0.463000 | 0.224543 | 0.463000 |
| PUBLIC EXPENDITURES | 0.494151 | 0.4630000 | 0.236314 | 0.463000 |
| INVESTMENT | 0.485401 | 0.463000 | 0.159421 | 0.463000 |
Source: Researcher's work & relied the program (Eviews 9.0).
| Table 6 PP Test |
||||||
|
Original Variables | Prob. | At 1st Difference | Prob. | ||
| PP | 5% | PP | 5% | |||
| GDP | -2.526231 | -3.119910 | 0.1320 | -5.290204 | -3.144920 | 0.0016 |
| Public Revenues | -1.522004 | -3.119910 | 0.4914 | -4.633423 | -3.144920 | 0.0044 |
| Public Expenditures | -1.648639 | -3.119910 | 0.4319 | -3.559759 | -3.144920 | 0.0127 |
| Investment | -1.086157 | -3.119910 | 0.6869 | -3.441953 | -3.144920 | 0.0151 |
Source: Researcher's work & relied the program (Eviews 9.0).
| Table 7 (DICKY-FULLER) Test For GDP |
||
| Null hypothesis D (Y) has a unit root Exogenous constant Lag lenghth: 2 (Aromatic -based on SIC, max lag=2) |
||
| t-statistics | Prob. | |
| Augmented Dickey-Fuller test statistic | -5.057516 | 0.0035 |
| Test critical values 1% value | -4.297073 | |
| 5% value | -3.212696 | |
| 10% value | -2.747676 | |
| Table 8 (DICKY-FULLER) Test for X1 Original |
||
| Null hypothesis D (X1) has a unit root Exogenous constant Lag lenghth: 0 (Aromatic-based on SIC, max lag=2) |
||
| t-statistics | Prob. | |
| Augmented Dickey-Fuller test statistic | -2.605025 | 0.0141 |
| Test critical values 1% value | -2.771926 | |
| 5% value | -1.974028 | |
| 10% value | -1.602922 | |
| Table 9 (Dickey-Fuller) test of Y after 1st Difference |
||
| Null hypothesis D (X2) has a unit root Exogenous constant Lag lenghth: 0 (Aromatic-based on SIC, max lag=2) |
||
| t-statistics | Prob. | |
| Augmented Dickey-Fuller test statistic | -4.740590 | 0.0037 |
| Test critical values 1% value | -4.121990 | |
| 5% value | -3.144920 | |
| 10% value | -2.713751 | |
| Table 10 (Dickey-Fuller) test of X1 after 1st Difference |
||
| Null hypothesis D (X3) has a unit root Exogenous None Lag lenghth: 0 (Aromatic-based on SIC, max lag=2) |
||
| t-statistics | Prob. | |
| Augmented Dickey-Fuller test statistic | -2.467265 | 0.0187 |
| Test critical values 1% value | -2.771926 | |
| 5% value | -1.974028 | |
| 10% value | -1.602922 | |
Source: Researcher's work & relied the program (Eviews 9.0).
| Table 11 VEC Model |
|||||
| Variables | Y (-1) | DY (-1) | C | Coint Eq1 | R2 |
| Public Revenues | 1.000000 | -0.000348 | -33708.73 | 0.411362 | 0.23 |
| Public Expenditures | 1.000000 | -0.821030 | -33197.55 | 0.988268 | 0.78 |
| Investment | 1.000000 | -0.000719 | -44904.02 | -0.074402 | 0.24 |
Source: Researcher's work & relied the program (Eviews 9.0)
| Table 12 Johnson Test For Variables |
||||
| Date:08/01/17 Time: 07:33 Sample (adjusted): 2004 2016 Included observations: 13 after adjustments Trend assumption: Linear deterministic trend Series: X1 X2 X3 X4 Y Lags interval (in first differences): Unrestricted Co Integration Rank Test (Trace) |
||||
| Hypothesized | Trace | 0.05 | ||
| No. of CE (s) | Eigenvalue | Statistic | Critical Value | Prob. |
| None • | 0.977796 | 89.00238 | 69.81889 | 0.0007 |
| At most 1 | 0.856096 | 39.50525 | 47.85613 | 0.2407 |
| At most 2 | 0.561073 | 14.30330 | 29.79707 | 0.8232 |
| At most 3 | 0.236484 | 3.598807 | 15.49471 | 0.9332 |
| At most 4 | 0.006986 | 0.091140 | 3.841466 | 0.7627 |
Source: Researcher's work & relied the program (Eviews 9.0).
| Table 13 Economic Development Equation Estimation In Iraq For Period (2003-2016) |
||||
| Date: 08/02/17 Time: 08:37 Sample: 2003 2016 Method: Least Squares Dependent Variable: DY Included observations:14 |
||||
| Variable | Coefficient | Std. Error | t-Statistic | Prob. |
| C | 30370.12 | 2268.696 | 13.3865 9 | 0.0000 |
| DX 1 | 3.62E-05 | 7.07E-05 | 0.512389 | 0.6207 |
| DX2 | 0.000412 | 7.90E-05 | 5.218817 | 0.0006 |
| DX3 | 0.000159 | 0.000137 | 1.15974 8 | 0.0276 |
| X4 | -3126.508 | 805.229 | -1.731918 | 0.0117 |
| R-squared=0.968842; Mean dependent var=57139.36 Adjusted R-squared=0.954994; S.D. dependent var=14621.55 S.E. of regression=3101.913; Akaike info criterion=19.18988 Sum squared resid=86596780; Schwarz criterion=19.41811 Log likelihood=129.3292; Hannan-Quinn criter.=19.16875 F-statistic=69.96230; Durbin-Watson stat=1.836720 Prob (F-statistic)=0.00000 1 |
||||
Source: Researcher's work & relied the program (Eviews 9.0).
The CUSUM TEST & CUSUMSQ achieved When the Graph Line is within the critical graphs lines at a significant level of 5%, as the following figures:
Conclusion
1. The financial policy instruments are key factors in determining the economic growth rates of any country in the world because it have the ability to determine financial position and trend the public expenditure in the right direction.
2. Foreign investment is a key determinant in improving economic growth rates due to the added value to GDP and the development of some economic indicators either directly or indirectly.
3. There had a many of an economic and political crises a cross by the Iraqi economy after 2003 and continues to be affected negatively, which was reflected on the reality of economic growth in Iraq.
4. The practical side proved the true of the hypothesis of research through the logic of economic theory first and supported by the statistical side through statistical and econometrics tests, which founded a mutual strong relationship between financial policy tools and improve economic growth rates in Iraq.
5. The results of the econometrics analysis of the model showed that the hypothesis of the research with the analysis and its results is accordance with the using of financial policy instruments that can achieve growth rates on the one hand, and the others, the crises have a negative impact on the environment of economic growth.
References
- Abu, N., & Mohammad, O. (2006) Rationalization of public spending and the state budget deficit, adar aljameya, iskandreya. Egypt.
- Ahmed, T., Kabur, L., & Bourheli (2016). Public expenditure and Economic growth. Algeria.
- Aljanabi. & Taher (1990). Public financial studies, higher education press. Baghdad.
- Alsamaraey., & Hana abdel, G. (2002). FDI with international trade, china modeling, by alhikma. Baghdad.
- Altrawna, S., Adnan, A., & Saeed, M. (2016). The discretionary fiscal policy and its impact on economic growth in Jordan during the period 1976-2011. Jordan Journal of Economic Sciences, 406(3655), 1-20.
- Ben-Allal, B. (2013). The liberalization of fiscal policy and Economic growth in developing countries its relationship and Its success conditions by using simple data for developing countries-Econometrics study under the Dynamic Model period 1980-2010.
- Bensalma, A. (2013). A Consistent test for Unit Root against Fractional alternative. 5th International Conference on Modeling, Simulation and Applied Optimization 2013 (ICMSAO'2013), 28-30.
- Besley, T., & Smart, M. (2007). Fiscal restraints and voter welfare. Journal of public Economics, 91(3-4), 755-773.
- Birău, F. R., & Trivedi, J. (2013). Analyzing co-integration and international linkage between Bucharest stock exchange and European developed stock markets. International Journal of Economics and Statistics, 1(4), 237-246.
- Fatás, A., & Mihov, I. (2001). The effects of fiscal policy on consumption and employment: Theory and evidence, 2760. London: Centre for Economic Policy Research.
- Hemming, R., Mahfouz, S., & Kell, M. (2002). The effectiveness of fiscal policy in stimulating economic activity-A review of the literature. International Monetary Fund.
- Kneller, R., Bleaney, M. F., & Gemmell, N. (1999). Fiscal policy and growth: Evidence from OECD countries. Journal of Public Economics, 74(2), 171-190.
- Othman, S.M.I. (2004). The Role of Fisical Policy in Increasing Labor Absorptive Capacity for the Palestinian Economy.