Research Article: 2018 Vol: 19 Issue: 4
The Influence of Leading Commodity, Quality of Labor, Economic Structure, and Productivity of Labor against Inequality of Income among the Regencies in South Sumatra Province, Indonesia
Syamsurijal Abdul Kadir, Sriwijaya University
Azwardi, Sriwijaya University
Anna Yulianita, Sriwijaya University
Siti Rohima, Sriwijaya University
Abstract
Keywords
Leading Commodity, Quality of Labor, Economic Structure, Labor Productivity, Income Inequality.
Introduction
The main objective of economic development in addition to create high growth is also to reduce some levels of poverty and inequality of income between groups either communities or regions. The development policy that prioritizes economic growth has led to increasingly high levels of inequality. A major factor that causes the problem of income inequality is economic growth. High economic growth that is not followed by a proper policy of equitable income distribution would lead to an increasingly widening income inequalityy. This inequality may result of the presence of the polarization of development with determination of the urban center, the development of which does not produce the effect of deployment and the effect of trickle downwards (Jhingan, 2006; Leigh & Blakely, 2016).
The economic growth of a region can be determined by some factors of production which belong to the region; those are man-made factor of productions, natural resources, human resources, and the level of technology used. Human resource is an important factor of production in determining the level of economic growth because it closely relates to the skills and technological advances that determines the level of productivity in a given sector or region, also affects the inequality of income.
The existence of differences in natural resources, per capita income levels, and the availability of infrastructures are some of the factors which influence the inequality among regions. According to Muttaqim (2014); Dhyatmika & Atmanti (2013); Ginting (2014); Dellis et al. (2013), income inequality has caused by the uneven development among regions that led to imbalance in the economy. It can be seen from the more unequal the distribution of income among different layers of society and regions. So, do the distribution of GRDP in South Sumatra Province in the year 2015 varied among regencies and cities. The highest distribution was the regency of Musi Banyuasin 15.97%, followed by the regency of Muara Enim and regency of OKI 12.14% and 6.45%, respectively. The next lower was followed by regency of Banyuasin the 6.16% and then regency of Musi Rawas 4.18%, regency of Lahat 4.10%, regency of OKUT 3.25%, regency of OKU 3.15%, regency of Ogan Ilir 2.42% and the lowest is regency of OKUS 1.80% (BPS, 2015).
Other phenomena show that South Sumatra Province is the province's a fourth largest inequality level of income in Sumatra (Yeniwati, 2013). Gini index of South Sumatra became 0.4 in 2012, had previously been at the moderate level those were between 0.3-0.34 during 2008-2011 (BPS, 2013). It seemed there was a drastic increase in Gini index of South Sumatra that was much higher than Aceh province and Riau Kepulauan province, which only reached a number of about 0.35 in year 2012 (BPS, 2011).
Basically the implementation of development in South Sumatra Province is expected to increase revenue and generate equitable in prosperity, but in reality there still exists income inequality. Inequality in South Sumatra Region lasts and occurs in various forms and differences in aspects or dimensions, and due to various obstacles, both in terms of investment, or the potential of the natural resources belonging to the respective regency and city. Based on the description that has been outlined above, then the purpose of this research is to look at the influence of leading commodity, life expectancy, education, economic structure, and productivity of labor against the inequality of income regencies and cities in the province of South Sumatra, Indonesia.
Literature Review
The analysis carried out in this study refers to some theoretical literatures related to disparities between regions. Inequality is basically caused by the existence of differences in natural resources content and differences in demographic conditions in each region. As a result of these differences, the ability of the region to encourage development process is also different. The occurrence of this inequality has implications against the level of social welfare among regions. Therefore, the aspect of development imbalances among regions also has implications to the formulation of regional development policy carried out by the local government (Higgins, 2017; Jhingan, 2006).
Inequality between regions was raised by Douglas C. North in his analysis of Neo Classical Growth Theory. In this theory a prediction of the relationship between the level of national economic development of a country and development inequality between regions is raised. This hypothesis is then well known as the Neo-Classical Hypothesis (Sjafrizal & Elfindri, 2008). According to the Neo-Classical Hypothesis, at the beginning of the development process of a country, development inequality between regions tends to increase. This process will continue to occur until inequality reaches its peak. Then, if the development process continues, the development imbalance will gradually decrease. Based on this hypothesis, inequality of development between regions tends to be higher generally in developing countries, and will occur otherwise in developed countries. In other words, development inequality curves between inverted U-shaped regions shows the degree of inequality.
This Neo-Classic Hypothesis Truth was tested by Williamson (1965) through the study of development inequality between regions in developed and developing countries using time series and cross section data. The results show that the Neo-Classical Hypothesis proved to be empirically correct. This means that the development process of a country can indirectly reduce the level of development inequality between regions, but in the initial stage the opposite happens (Sjafrizal & Elfindri, 2008). Kuznets (1955) says that in the early stages of economic growth, income distribution will deteriorate, but in the next stage, the distribution of income will increase. This observation is then known as the “U-Reverse” Kuznets curve, because of longitudinal changes (time-series) in income distribution.
Other factor may cause inequality of income is productivity. According to Todaro & Smith (2013) and Tambunan (2012) Productivity is the level of production that can be generated by a worker per year. Compared with the level of productivity of the labor in developed countries, the rate of productivity of labor in developing countries is still very low, it is caused by some factors such as low level of education and lack of supporting equipments, and most labor are concentrated on the traditional agricultural sector which is still faced the problem of disguised unemployment. Productivity of traditional agriculture is still very low, usually because technology in farming activities is still very traditional. The existence of disguised unemployment which means an excess of manpower in the agricultural sector will further lower average production or worker productivity. Low productivity is often associated with level of education. It is assumed the higher the education level a person has, the higher the level of productivity may be achieved (Wie, 1997; Antoni, 2013).
Labor Productivity can also be determined by the level of the health of labor. Labor health level can be seen from life expectancy. In South Sumatra, life expectancy increased from 67.7 years in 2004 to 69.16 years in 2016, reflecting the existence of improvement in public health level of South Sumatra in the period. The education aspect is represented by two components, namely the number of literacy and average years of schooling show upward trend and it also shows that there is an improvement of schooling in that period as the image of rising public education during 2005–2016 (BPS, 2016).
Life expectancy (AHH) at any given age is defined as the average number of years of life that a person still lives who has reached age appropriate in the prevailing mortality situation in the milieu of community. The indicator that is often used is the time-life expectancy at birth (expectation of life at birth) which is defined as the average years of life for a new-born baby who is still alive, along with the declining in infant mortality rate and the increasing in life expectancy (BPS, 2015).
The variety of economic activities encourages each regency and city to develop its economic potential. Therefore regional development is implemented in an integrated and harmonious as well as directed in order for development to take place in each area completely in accordance with the priorities and potential of the region. Steps that can be done are to determine the leading sector. This leading sector will produce leading commodity that becomes the pride of the region and contributes to the income of the region. This leading commodity is one of the capitals for development in increasing people's income, particularly in increasing the income of farmers who ultimately can improve their well-being (upward mobility).
Thus, the utilization of the regional resources of excellence and potential optimally integrated is a requirement to note in order for the well-being and prosperity of society can be achieved (Mubyarto, 1998). In addition to the development of the agricultural sector, it is to be very important in an attempt to lower the level of poverty (Yudhoyono & Harniati, 2004; Datt & Ravallion, 1992; Matsuyama et al., 1992; Zhang et al., 2013). Of course to develop the sector there will be the need for management in the form of a partnership between local government, the public and the private sectors (Zuhdi & Suharno, 2016; Hadi, 2004; Kusdiana & Wulan, 2007).
Agricultural commodities of a region can be said to be a leading commodity if it has a large number of commodity production and a very broad market share (Oktavia et al., 2016). An increase in market share of agricultural commodities will be able to encourage an increase in demand for agricultural products produced by a region. The leading commodityy can be seen from two sides, those are the supply side and the demand side. The leading commodity from supply side is characterized by superiority in its growth on the biophysical conditions, technology and socio-economic conditions of farmers in a region (Hendayana, 2003; Iyan, 2014). While from demand side, the leading commodity characterized by the strength of demand for in both international and domestic markets (Syafa'at & Friyatno, 2000; Oktavia et al., 2016). Socio-economic conditions in question include the mastery of technology; the ability of human resources, infrastructure, such as local farmers' markets and habits (Yulianita, 2009).
Methodology
Description of the South Sumatra Province
South Sumatera Province is one of the provinces in Indonesia that has abundant natural resources. For instances, coal is the potential one in South Sumatra, it reached 37% of the total potential of existing coal in Indonesia, larger than that found in the East Kalimantan Province (35%) and South Kalimantan Province (26%) (Atmajaya, 2014). The position of the South Sumatra Province and its potential are strategic and important for the success of development. The achievement of development was showed by a high economic growth rate and an improvement in local revenue equalization. In additon, South Sumatra Province was the ninth highest of Gross Regional Domestic Product (GRDP) among the others in Indonesia, however it still has a high-enough poor population, i.e. the fifth highest compared with the other provinces in the year 2012 (BPS, 2012).
South Sumatra Province has 13 regencies and 4 cities namely regencies of OKU, OKI, Muara Enim, Lahat, Musi Rawas, Musi Banyuasin, Banyuasin, OKUS, OKUT, Ogan Ilir, Muratara, Empat Lawang, PALI, and cities of Prabumulih, Pagaralam, Lubuk Linggau, and Palembang as shown in Figure 1.
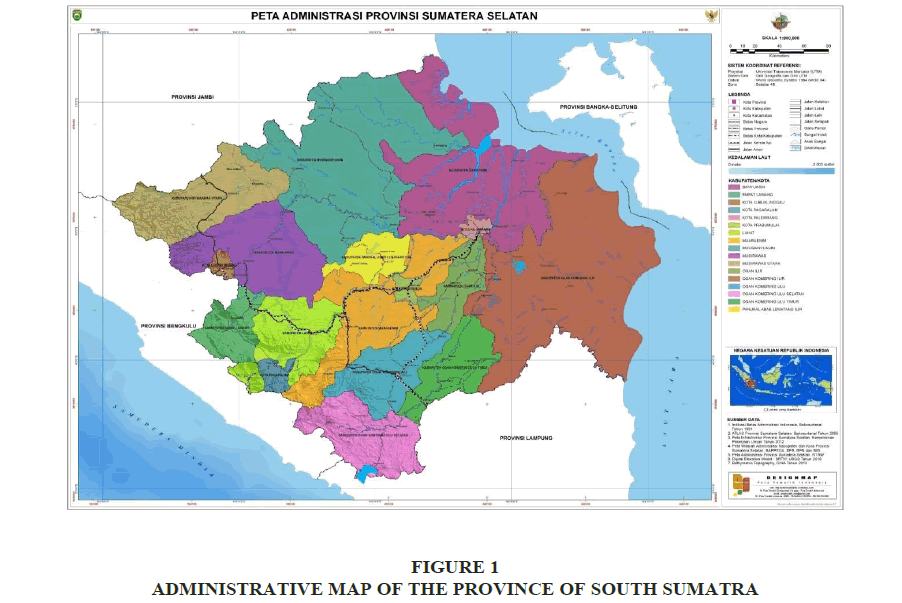
Figure 1: Administrative Map Of The Province Of South Sumatra
Compared with the other provinces in Sumatera Island, South Sumatra has the sixth highest per capita income during the years of 2005-2010 (Yeniwati, 2013). Although, in 2011-2012, South Sumatra has an increase in economic growth rate higher than that of Riau Province and Riau Kepulauan Province, but they still have the highest per capita income of the first and the second, respectively (BPS, 2013). Economic condition of South Sumatra Province in year 2016 compared with its condition in previous year rose to 3.68%. From production side of business, this growth was contributed by agriculture sector such as forestry and fishery which grew 8.04%. While from expenditure side, it was much more caused by component of government expenditures that grew 19.44% (BPS, 2017).
The number of poor population in South Sumatra Province in 2016 was 13.54%, it was still higher when it is compared with the number of poor population nationally in the same year, which was 10.86%. The number of poor population the first-highest was in Palembang city, it was approximately 203 thousand inhabitants, the second was OKI regency, it was around 134 thousand inhabitants, and the lowest poor population of the city was Pagar Alam, it was around 12 thousands (BPS, 2017). This fact shows that the development being done had not yet delivered optimal results to their GRDPs, in 2016.
Method of Analysis
South Sumatra Province is one of the provinces that have the potential to develop agricultural sector. Each regency and city has contribution to income from agricultural sector. The regencies with economic structure of agriculture have considerable contribution to their regional incomes namely, regency of OKI (67%), regency of Empat Lawang (45%), regency of OKUT (46%), regency of Banyuasin (36%) and regency of Musi Rawas (35%), as shown in Figure 2.
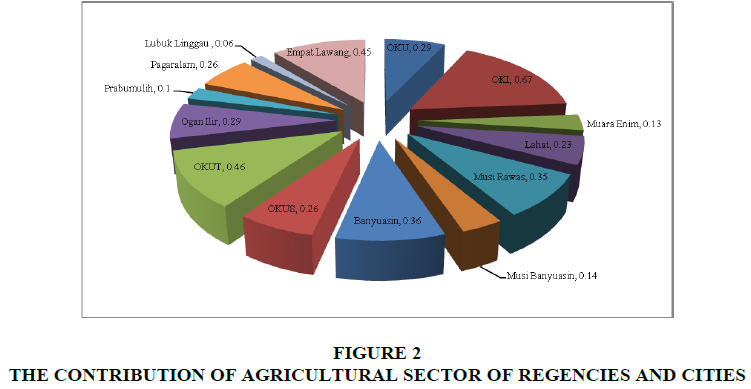
Figure 2: The Contribution Of Agricultural Sector Of Regencies And Cities
Basically method of analysis used in this research is a multiple regression technique. Since variables used in this research require certain techniques, then Location Quotient (LQ) and Willianson Index (WI) techniques are used to measure leading commodity and income inequaity, respectively.
Based on regional data on regencies and cities in South Sumatra, sub-sector of the agricultural sector which is still dominant is plantation sub-sector. Since the production of plantation contributes more to agricultural sector, then it becomes made leading commodities i.e. rubber, palm oil, and coffee. The leading Sectors are very important in influencing the growth of the economy of a region. This can be seen from the growth of the value of GRDP from year to year. These leading commodities are determined by using the method of LQ (Location Quotient). Base on this method the leading commodities of regency in South Sumatra Province can be determined. They are shown in Figure 2.
Figure 3 shows that the leading commodity of rubber is in the regency of OKU, regency of Muara Enim, regency of Musi Rawas, regency of OKUT, regency of Ogan Ilir, city of Lubuk Linggau, and city of Prabumulih. Leading commodity of palm oil is in the regency of OKI, regency of Lahat, regency of Musi Rawas, regency of Musi Banyuasin and regency of Banyuasin. Leading commodity of coffee is in the regency of OKU, regency of Muara Enim, regency of Lahat, regency of OKUS, regency of OKUT, and regency of Ogan Ilir.
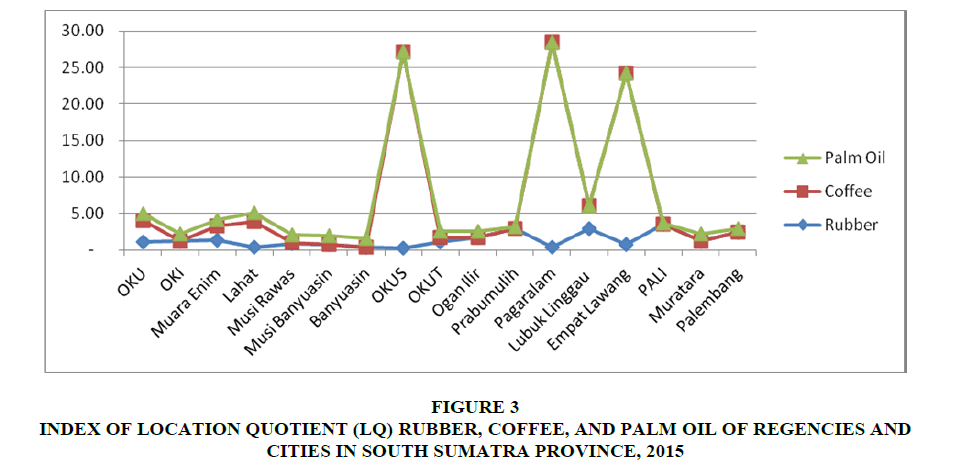
Figure 3: Index Of Location Quotient (Lq) Rubber, Coffee, And Palm Oil Of Regencies And Cities In South Sumatra Province, 2015
To determine the leading commodities one can use the Economic Base Theory (North, 1991) which was developed by (Tiebout, 1956). The theory divides the production sector or types of jobs in a region over a job base (basic) and employment service (non-basic). Basic activities are activities that are exogenous means not tied to the condition of the internal economy of the region and serve to push for other types of work to grow. Whereas, the activity of the non-basic is an activity to meet the needs of the community in the region itself.
Furthermore, contribution of palm oil production against total production of plantations from the year 2010 up to the year 2016 was relatively stable. For the regencies of Musi Banyuasin, Lahat, and OKI, their contributions on average were 70.07%, 66.57%, and 60.35%, respectively, then followed by regency of Musi Rawas and regency of Banyuasin were 56.15%, and 53.38%, respectively. The regencies of OKU and OKUT during the years of (2010-2016) had had an average contribution of the production of palm oil to the total production of the plantations in the regions were relatively stable with an average of each was 47.98% and 47.52%, respectively. Palm oil production contributed least to the total production of the plantation commodity was in regency of Empat Lawang and regency of OKUS, each only amounted to 2.4% and 2.7%, respectively (Estate Agency, 2016).
This causality research discusses problems associated with leading commodity, quality of labor, economic structure, labor productivity and inequality of income. Data used in this research are panel data with time period of 6 years i.e. from 2010 up to 2015 and 14 regencies and cities in the province of South Sumatra based on secondary data. The data obtained and collected from The Central Bureau of Statistics of South Sumatra Province and Department of Agriculture and Plantation of South Sumatra Province.
In this study, Williamson index is used to see how high the level of inequality of income among regions as a dependent variable. Williamson Index is used to measure the development imbalance among regencies and cities based on gross regional income of regencies and province per capita and total population of regencies and province. A formula to measure provincial gross regional income inequality (Kuncoro, 2004) is:
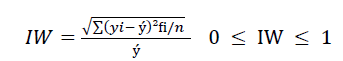
Where,
IW = Indeks Williamson.
yi = GRDP per capita in the regency and city i.
 = Provincial GRDP per capita.
fi = Number population of regency and city i.
n = Total population.
i = 1, 2, ………, k.
k = Number of districts or cities.
While Location Quotient index, quality of labor (life expectancy, Labor Education), economic structure, and productivity of labor, are independent variables.
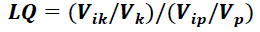
Location Quotient (LQ) is a theory of economic basis which is basically because the base industry produces goods and services for the market within the region and outside the region in question, the sale out of the region will generate income within the region. In general, the LQ analysis method can be formulated as follows:
Where,
Vik : output value (GRDP) of sector i study area k (regency/city, for example) in the formation of the regional GRDP of the study area k.
Vk : Total GRDP of all sectors in the study area k.
Vip : sector i output value (GRDP) reference area p (province for example) in the formation of the GRDP reference area p.
Vp: Total GRDP of all sectors in the reference area p.
Based on the results of the Location Quotient calculation, it can be known the concentration of an activity in an area with the following criteria:
1)LQ value in sector i=1. This means that the growth rate of sector i in the study area k is the same as thegrowth rate of the same sector in the economy of the reference area p.
2)LQ value in sector i˃1. This means that the growth rate of sector i in the study area k is greater than thegrowth rate of the same sector in the economy of the reference area p. thus, sector i is the leading sectorof the study area k as well as an economic basis to be further developed by the study area k.
3)LQ value in sector i˂1. This means that the growth rate of sector i in the study area k is smaller than thegrowth rate of the same sector in the economic reference area p. Thus, sector i is not a leading sector ofthe study area k and is not an economic base and is not prospective to be further developed by the studyarea k.
Analytical technique used in this study is a multiple linear regression model and is specified in the form of a double-logarithmic. In general the income inequality among the regencies in South Sumatra is a function of its leading commodity, quality of labor, labor productivity, and economic structure of the regencies in South Sumatra Province. The mathematical function is as follows:
IWit=f (LQRit, LQCit, LQOit, AHHit, PTKit, PTKRit, PTKCit, PTKOit, STEAit)
The eeconometric model in a double-logarithmic form used in this analysis is:

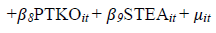
Imformation:
IWit : Index of income inequality of regency years 2010-2015 in the province of South
Sumatra.
LQRit : Number of rubber commodity LQ of regency years 2010-2015 in the province of
South Sumatra.
LQCit : Number of coffee commodity LQ of regency years 2010-2015 in the province of
South Sumatra.
LQOit : Number of palm oil commodity LQ of regency years 2010-2015 in the province of South Sumatra.
AHHit : Life Expectancy of regency years 2010-2015 in the province of South Sumatra.
PTKit : Education of Labor years 2010-2015 in the province of South Sumatra.
PTKRit : Labor Productivity of rubber commodity of regency years 2010-2015 in the
province of Sumatra South.
PTKCit : Labor Productivity of coffee commodity of regency years 2010-2015 in the
province of Sumatra South.
PTKOit : Labor Productivity of palm oil commodity of regency years 2010-2015 in the
province of Sumatra South.
STEAit: Structure of the economyof regency years 2010-2015 in the province of Sumatra
South.
μit : Error terms.
i : Regency.
t : year.
β0... β9 : Parameter Estimates.
Results And Discussion
Based on the results of calculation using formula of Williamson index obtained that regencies which experienced fluctuating in Williamson index were OKU, OKI, Lahat, Musi Banyuasin, Ogan Ilir, and Lubuk Linggau (Table 1). The maximum value of Williamson Index is 0.31 and the minimum value of it is 0.10 with mean 0.2181. The regencies experienced decreasing in inequality were Muara Enim, Musi Rawas, and Banyuasin. These results are in line with the results of the research by Priyambodo (2015) which tend to decline. The regency experienced a rise in inequality was only OKUS. This result is in line with the results of the research of Rachmawati (2013) which are likely to rise. While the indices of others, namely OKUT, Prabumulih, Pagar Alam, and Lubuk Linggau were unchanged.
| Table 1 Descriptive Statistics |
||||||||||||
| WI | LQR | LQC | LQO | AHH | PTK | PTKR | PTKC | PTKO | STEA | |||
| N | Valid | 84 | 84 | 84 | 84 | 84 | 84 | 84 | 84 | 84 | 84 | |
| Missing | 0 | 0 | 0 | 0 | 0 | 0 | 0 | 0 | 0 | 0 | ||
| Mean | .2181 | 1.0968 | 5.2862 | .6532 | 66.8520 | 26.0381 | 1.3311 | .6308 | 8.8845 | .2887 | ||
| Median | .2200 | .9900 | .6800 | .8250 | 67.6400 | 22.5150 | 1.2115 | .4835 | 9.2430 | .2864 | ||
| Std. Deviation | .05908 | .87652 | 8.70550 | .48256 | 1.71794 | 9.24440 | .80360 | .61799 | 6.00345 | .16641 | ||
| Minimum | .10 | .07 | .00 | .00 | 63.85 | 12.17 | .18 | .00 | .00 | .01 | ||
| Maximum | .31 | 3.31 | 28.05 | 1.34 | 69.59 | 46.93 | 3.10 | 3.57 | 27.35 | .70 | ||
| Sum | 18.32 | 92.13 | 444.04 | 54.87 | 5615.57 | 2187.20 | 111.81 | 52.98 | 746.30 | 24.25 | ||
| % oiles | 25 | .1700 | .4325 | .0300 | .0350 | 65.4250 | 19.2650 | .7173 | .1865 | 6.3505 | .1351 | |
| 50 | .2200 | .9900 | .6800 | .8250 | 67.6400 | 22.5150 | 1.2115 | .4835 | 9.2430 | .2864 | ||
| 75 | .2775 | 1.3550 | 3.0325 | 1.0675 | 68.0075 | 33.1000 | 1.8940 | .8723 | 11.4098 | .3818 | ||
Source: Results of statistics, 2017.
In general, the development or the income inequality among regencies and cities in South Sumatra Province is still classified low because the values of Williamson Indices are still in a range between 0.10-0.31 with the average of 0.2181. This information about the factors that affect the development imbalance among the regencies and cities may be used as an input for decision makers to determine police which will be taken.
Location Quotient indexes of rubber commodity range from 0.07 to 3.31, of coffee range from 0.00 to 28.05, and of palm oil range from 0.00 to 1.34. On average, LQ of coffee commodity is the highest (5.2862), and then followed by LQ of rubber and palm oil commodities, 1.0968 and 0.6532, rerespectively
The quality of labor represented by Life Expectancy (AHH) which is measured by number of years a person is still alive since he was born and Labor Education (PTK) which is measured by % age of labor force graduated from senior high school and above, respectively, are highest in Prabumulih and Lubuk Linggau cities, while the lowest figures are in Lahat and OKI Regencies. The highest labor productivity of palm oil commodities is 27.35, which are in Lubuk Linggau regency. While the highest labor productivity of rubber and coffee commodities is 3.10 and 3.57 respectively. The regency of OKI has the highest productivity of labor in rubber commodity, and the regency of OKUT has the highest productivity of labor in coffee commodity.
The economic structure measured by the contribution of the agricultural sector to the highest GRDP is 0.70 in the OKI Regency, while the lowest figure is 0.01 in the Musi Banyuasin Regency. This shows that the agricultural sector is superior to OKI Regency.
Factors affecting development inequality among the regencies and cities in South Sumatra Province based on the results of the regression specified in this study are presented in Table 2 below.
| Table 2 Linear Estimation After Weighting Matrix-Step One |
||||
| Variable | coefficient | Std Error. | the t-Statistics | Prob. |
| C | 0.235788 | 3.454677 | 0.068252 | 0.9459 |
| LQR | -0.032543 | 0.030048 | -1.083041 | 0.2851 |
| LQC | -0.117962 | 0.018130 | -6.506620 | 0.0000 |
| LQO | 0.164798 | 0.017779 | 9.269150 | 0.0000 |
| AHH | -0.274328 | 0.836100 | -0.328105 | 0.7445 |
| PTK | 0.001590 | 0.077026 | 0.020648 | 0.9836 |
| PTKR | -0.023896 | 0.017362 | -1.376342 | 0.1762 |
| PTKC | 0.086717 | 0.012964 | 6.689234 | 0.0000 |
| PTKO | -0.270869 | 0.039983 | -6.774571 | 0.0000 |
| STEA | -0.149630 | 0.029345 | -5.098989 | 0.0000 |
| Weighted Statistics | ||||
| R-squared | 0.976623 | Mean dependent var | -2.732393 | |
| Adjusted R-squared | 0.971492 | Until dependent var | 1.878133 | |
| S.E. of regression | 0.088597 | Sum squared resid | 0.321827 | |
| F-statistics | 190.3216 | Durbin-Watson stat | 1.323648 | |
| Prob (F-statistics) | 0.000000 | |||
Source: results of regression estimation, 2017.
These estimation results obtained based on the specified model can be used to describe the influence of the independent variables on the dependent variable in the model. The model used in this research meets the criteria quite well, because it meets the classic assumptions i.e. there is no hetero schedasticity, no autocorrelation, normality in error terms, and no multi co-linearity. The result of F-statistics is 190.3216 (α=0.01), means that at least one of the independent variables has significant effect against the inequalities of development in South Sumatra Province. Furthermore, adjusted R-squared indicates that variations of existing independent variables all together in the equation can explain variation in inequality of development as much as 97%, the rest is determined by variables outside of the model.
Based on the results of the estimation of the regression equation that has been done, the value of C=0.2358 shows without independent variables, then IW on South Sumatra Province is 0.2358. This means that imbalance of development among the regencies and cities in South Sumatra Province can be categorized as pretty low because it is still under 0.50.
The coefficients of LQR and LQC show a negative sign. This means that an increase in the index value of LQR and LQC will cause a decrease in development inequality between regencies in South Sumatra. However, LQR with a P-value of 0.2851 shows that LQR has no significant effect on the level of inequality. While P-values of LQC and LQO are 0.0000 each, and indicate that LQC and LQO affect the level of inequality. The LQR coefficient is -0.0325 which has no significant effect on income inequality shows that the development of leading rubber commodities will not have an impact or real contribution to the reduction in the level of income inequality between regencies and cities in South Sumatra Province. The LQC variable has a negative sign and is significant indicates that if there is an increase in the development of leading coffee commodities by 1%, the income inequality between regencies and cities will decrease by 0.1180%. However, the change in index of palm oil commodities (LQO) which has a positive sign and is significant indicates that the development of leading palm oil commodities by 1% will lead to an increase in income disparity between regencies and cities is as much as 0.1648%, and the other variables are considered constant.
The labor quality coefficient represented by life expectancy coefficinet and the education level coefficient of labor show the opposite signs. The Coefficient of Life Expectancy (AHH) is -0.2743 with the P-value 0.7445 shows that AHH does not significantly affect the level of inequality. This means that if other variables do not change or remain constant, then a 1% increase in life expectancy does not significantly affect the level of income inequality between regencies and cities in South Sumatra Province. The results of this study are in line with the results of research of Nurhuda (2013) in East Java Province.
On the contrary, Labor's education coefficient indicates the number of 0.0016, it means that one % increase in numbers of educated workers of secondary school and above will increase the inequality of income among the regencies and cities in South Sumatera Province of 0.0016%. This means the more labor to work in the plantation sector, the higher the income inequality to increase. This finding is the same with the results of research conducted by Martins & Pereira (2004) and Sullivan & Smeeding (1997). Nevertheless, this finding is statistically negligible because it does not have a real influence at the level of significance of 5%. This means that a lot of workers who work in the plantation sector will not affect the level of income inequality.
The labor productivity coefficients for rubber and palm oil commodities show the results with negative signs, while for the coffee commodities coefficient shows a positive sign. Coefficients of PTKC and PTKO which have P-values of 0.0000 indicate that the labor productivity of coffee and palm oil commodities affects the level of inequality. These results indicate that an increase in productivity of rubber plantations does not have an impact on reducing inequality of income in South Sumatra, while an increase in the productivity of palm oil plantation and an increase in the productivity of coffee plantation will affect the development inequality between regencies and cities in South Sumatra. The coefficient of labor productivity of palm oil commodity shows a negative number (rounded -0.2709). This means that a 1% increase in labor productivity of palm oil commodity will reduce income inequality between regencies and cities by 0.2709 %. Furthermore, for the Coffee Commodity, labor Productivity Coefficient (PTKC) shows a number of 0.0867, which means that if there is a 1% increase in labor productivity of coffee commodities, then there will be an increase in income or development inequality between regencies and cities in South Sumatra Province by 0.0867%. This is due to the increase in labor productivity of leading coffee commodities, generally carried out by person individually, not under the auspices of companies such as palm oil commodities, and little training is given to improve the skills and expertise of coffee plantation workers. Therefore, the development of productivity in coffee plantations is usually not accompanied by infrastructure development so that the economy in the region does not adhere to growth. It is different from the development of palm oil plantation productivity which is usually accompanied by infrastructure development in the area so that the economy grows and has an impact on increasing people's income.
Furthermore, the Economic Structure coefficient shows a negative number (rounded -0.1496) and is significant at the 5% level. That is, a 1% increase in the contribution of the agricultural sector to the Gross Regional Domestic Product will reduce the level of development inequality in regencies and cities in the province of South Sumatra by 0.1496%. This result is in line with the results of researches conducted by Yeniwati (2013), Rahmawaty (2014), and Angelia (2010). Since Economic structure is measured by the contribution of the agricultural sector to GRDP, it means that the development of the agricultural sector in which there are coffee and rubber plantation sub-sectors with negative effects, and oil palm sub-sector with a positive impact on regional economy can reduce the level of income inequality in South Sumatra.
The findings of this research are most of the people who work in rubber plantation oil and palm oil plantation only as tenants, hired workers and non-landowners. For coffee plantation, it becomes a people's own business with a small land area scale, which affects the productivity of its labor. An increase in labor productivity of coffee commodities does not reduce the income inequality of the regions, but an increase in labor productivity of rubber and palm oil commodities will reduce the income inequality of the regions. Although most workers do not own land only as workers in oil palm and rubber companies.
Conclusions And Suggestions
Income inequality between regencies and cities in South Sumatra Province was relatively low with the Williamson Indexes ranging from 0.10 to 0.31. The development of inequality patterns varied across regencies and cities, there were regions that showed fluctuations such as regencies of OKU, OKI, Lahat, Musi Banyuasin, Ogan Ilir, and city of Lubuk Linggau, remain constant such as regency of OKUT, Prabumulih City, Pagaralam City, decrease such as regencies of Muara Enim, Musi Rawas, and Banyuasin, and increase such as regency of OKUS.
Development of lading commodity of coffee can reduce development inequality between regencies and cities in South Sumatra, while the development of leading commodity of palm oil has an impact on increasing levels of development inequality between regencies/cities in South Sumatra. An increase in labor productivity of coffee has an impact on increasing income inequality, while an increase in the labor productivity of palm oil can reduce the level of income inequality between regencies and cities in South Sumatra. The development of the agricultural sector, especially the coffee and palm oil plantation sub-sectors, can reduce development inequality between regencies and cities in the province of South Sumatra.
Based on these conclusions it is recommended that special attention must be given to OKUS regency because in the development process there has been an increase in inequality, as well as OKI and Banyuasin regencies because the level of inequality is still highest compared to other regencies. The development of leading commodities of rubber and coffee and the development of the agricultural sector in general are still needed to reduce the level of inequality of development. An increase in worker productivity of rubber and palm oil plantations and improvements in public health are still needed because they can reduce development inequality between regencies and cities in the province of South Sumatra.
References
- Angelia, Y., & Hayati, B. (2010). Analysis of inequality in regional development in DKI Jakarta Province 1995-2008. Unpublished Doctoral Dissertation, Diponegoro University, Indonesia.
- Antoni. (2013). Productivity of labor from the perspective of Sosia.
- Atmajaya, J. (2014). Infrastructure contribution towards the economic growth of South Sumatra. Gadjah Mada University.
- BPS. (2011). Statistics Indonesia 2011.
- BPS. (2012). Statistics Indonesia 2012.
- BPS. (2013). South Sumatra in Numbers.
- BPS. (2015). South Sumatra in Numbers.
- BPS. (2016). Statistics Indonesia 2016.
- BPS. (2017). Statistical Areas of South Sumatra Province 2017.
- Datt, G., & Ravallion, M. (1992). Growth and redistribution components of changes in poverty measures: A decomposition with applications to Brazil and India in the 1980s. Journal of Development Economics, 38(2), 275-295.
- Dellis, A., Roesmeli., & Novita, S. (2013) Analysis of inter-regional income inequality in indonesia period 1990-2008. Retrieved from https://hanibalhamidi.files.wordpress.com/2013/06/kesenjangan-01-rusdi.pdf
- Dhyatmika, K.W., & Atmanti, H. D. (2013). Developmental inequality analysis of banten province after the expansion. Unpublished Doctoral Dissertation, Diponegoro University.
- Estate Agency of South Sumatra Province (2016). Plantation statistics south sumatra province.
- Ginting, A.M. (2014). Analysis of influence of development in Indonesia.
- Hadi, M.S. (2004). Comparison analysis of the competitiveness of the agricultural export products between Asian countries in the Free Trade Era of Afta. Agro Economic Journal, 22(1), 46-73.
- Hendayana, R. (2003). Application methods location quotient (LQ) in the determination of the National Commodities. Agricultural Informatics, 12, 658-675.
- Higgins, B. (2017). Regional development theories and their application. Routledge.
- Iyan, R. (2014). Analysis of the leading commodity agriculture sector in the region. Social Economic Development Journal, 4(11), 215-235.
- Jhingan, M.L. (2006). The economics of development and planning. Vrinda Publication (P) Ltd.
- Kuncoro, M. (2004). Autonomy & regional development. Erlangga.
- Kusdiana, D., & Wulan, C. (2007). Analysis of the leading competitiveness of export sector in West Java. Trikonomika Journal, Faculty of Economics, Unpas, 6(1).
- Kuznets, S. (1955). Economic growth and income inequality. The American Economic Review, 45(1), 1-28.
- Leigh, N.G., & Blakely, E.J. (2016). Planning local economic development: Theory and practice. Sage Publications.
- Martins, P.S., & Pereira, P.T. (2004). Does education reduce wage inequality? Quantile regression evidence from 16 countries. Labour Economics, 11(3), 355-371.
- Matsuyama, H., Mangindaan, R.E., & Yano, T. (1992). Protective effect of schizophyllan and scleroglucan against Streptococcus sp. infection in yellowtail (Seriola quinqueradiata). Aquaculture, 101(3-4), 197-203.
- Mubyarto. (1998). Rural development strategy. Gadjah Mada University.
- Muttaqim, H. (2014). Disparity analysis of inter-regional income in Aceh province with the Williamson injection index period of 2008-2011. Journal of Flight, 14(9).
- North, D.C. (1991). Institutions. Journal of Economic Perspectives, 5(1), 97-112.
- Nurhuda, R. (2013). Development inequality analysis (Study in East Java Province 2005-2011). Journal of Public Administration, 1(4), 110-119.
- Oktavia, H.F., Hanani, N., & Suhartini, S. (2016). The role of the agricultural sector in economic development in East Java Province (Input-Output Approach). Habitat, 27(2), 72-84.
- Priyambodo, K.D., Luthfi, A., & Santoso, E. (2015). Analysis of district and city income disparities in East Java Province. e-Journal of Business Economics and Accounting , 2(1), 28-36.
- Rachmawati, L. (2013). The effect of the understanding level of inflation in Surabaya city. Journal of Educational Technology Students, 1(3).
- Sjafrizal., & Elfindri. (2008). Regional economy: Theory and application. Baduose Media.
- Sullivan, D.H., & Smeeding, T.M. (1997). Educational attainment and earnings inequality in eight nations. LIS Working Paper Series.
- Syafa’at, N., & Friyatno, S. (2000). Analysis of the impact of the economic crisis on job opportunities and identification of the mainstay commodities of the agriculture sector in the Sulawesi Region: An input-output approach. Economics and Finance in Indonesia, 48, 369-392.
- Tambunan, T. (2012). Indonesia's economy, some important issues,(First Edition). Jakarta: Indonesia Ghalia.
- Tiebout, C.M. (1956). A pure theory of local expenditures. Journal of Political Economy, 64(5), 416-424.
- Todaro, M.P., & Smith, S.C. (2013). Economic development,(Eleventh Edition). New York: McGraw Hill.
- Wie, T.K. (1997). The development of the capabilities of the technology industry in Indonesia. The University Press, Jakarta: Indonesia,
- Williamson, J.G. (1965). Regional inequality and the process of national development: A description of the patterns. Economic Development and Cultural Change, 13(4), 1-84.
- Yeniwati. (2013). Interconnection of the economic intercovery in Sumatera. Retrieved from http://ejournal.unp.ac.id/index.php/ekonomi/article/view/2734/2332
- Yudhoyono, S.B., & Harniati. (2004). Poverty reduction in Indonesia: Why not simply economic growth. Bogor: Brighten Press.
- Yulianita, A. (2009). Analysis of leading sectors and government expenditures in ogan komering ilir district. Journal of Economics & Development Policy, 7(2), 70-85.
- Zhang, Y., Kong, H., Fang, Y., Nishinari, K., & Phillips, G.O. (2013). Schizophyllan: A review on its structure, properties, bioactivities and recent developments. Bioactive Carbohydrates and Dietary Fibre, 1(1), 53-71.
- Zuhdi, F., & Suharno, S. (2016). Analysis of competitiveness of Indonesian and Vietnam coffee export in Asian markets 5. Habitat, 26(3), 152-162.