Research Article: 2022 Vol: 26 Issue: 6
Transition to New Normal: Evidence from Quick Service Restaurant
Vidhya Pillai, Institute of Finance and International Management College
Nataraja N.S, Institute of Finance and International Management College
Priya Vinod, Jyothi Nivas College, Bangalore
Citation Information: Pillai, V., Nataraja, N.S., & Vinod, P. (2022). Transition to new normal: evidence from quick service restaurant. Academy of Marketing Studies Journal, 26(6),1-12.
Abstract
The unprecedented nature of covid -19 pandemic has put off a long-lasting impact on both consumers and the business ecosystem. It has also changed the consumption pattern of consumers of fast-food business with new digital platforms that has now been extensively used by many individuals specifically the young population of the country. It has been observed that the way the consumers were purchasing earlier has changed and the retailers are curious to know in what ways they can improve the overall customer experience and to be mindful to undergo structural changes. This study tries to focus on understanding the consumer sentiment and behaviours while purchasing from QSR’s during the pandemic. Appropriate statistical tools like chi square, logistic regression models were used to analyse the data. To find the pertinency of the factors, logistic regression approach was used. The findings of the research would help the restaurants to identify the weaknesses and revisit their existing business models to maintain significant and withstand future disruptions. Those companies who wants to outlive must shorten their ranges, innovate themselves, and alter promotion strategies to accommodate the changing consumer preferences. The study also proves that companies that wish to stay pertinent through the catastrophe and handle the future, must be bold about the intensity and stride of their own transformation.
Keywords
Consumers, Preference, QSR, Fast- food, Logistic regression.
Introduction
Quick service Restaurant (QSR) is otherwise termed as fast-food, and it is a spot where one gets marginal service with a variety of foods. This industry is considered as one of the worlds growing industry and it is the same with India too. In India this industry is growing tremendously because of new digital platforms like online food delivery players like Swiggy, Zomato and other players. Few years back these restaurants were well-known as fast food. It was believed to be unhealthy, so to attract customers the marketers have transformed the name to QSR so that they could showcase that the food served is healthy and with good quality service. The reason behind this increase is because of the growing middle-class people with decent disposable income, working women and aspirations to follow the western culture backed by internet services, wellness awareness and well-read and travelled people of the country Bhardwaj (2011).
Many of the studies conducted so far on QSR’s were on service dimension and satisfaction level and only few studies were focused to check the changing consumption pattern of the consumers. There is a huge gap as many of the studies did not shed light on the preference of the consumers Bryant & Dundes (2008). So, it was imperative to study as it will help the retailers who are in this field to better understand the consumer behaviour and the impact the new changes have brought on their preference level while ordering food from these QSR’s. Also, the study tries to understand whether the new habits cultivated among consumers are going to stay back even after pandemic D’Acunto, et al. (2020). So, understanding this new pattern of preference will help the retail owners who are in the field of food industry to strategize and handle the sales, competition, and overall customer engagement programmes. Above all, this study aims to give appropriate recommendation to food industry practitioners on how they can improve and enhance their efficiency during and post pandemic Carvalho et al. (2020).
Quick Service Restaurants In India
Covid pandemic has hit everyone and the QSR was no exception. In India QSR’s have been mostly seen in mega and mini-metros and this is triggered by habit of eating out without a special occasion and ease of access to multiple options. Youngsters in the age group of 14 onwards are mostly seen in these places due to the influence of western culture who likes to experiment with different tastes. For many these restaurants are life savers when they move to a new city till they find a place of settlement Chronopoulos et al. (2020). The QSR market is expected to reach INR ~827.63 billion by the financial year 2025. Among them, we have chain QSR and standalone QSR segments and the well-known branded players operating are Burger King, Jubilant Food Works Limited, Burman Hospitality, Jumbo king Foods and many more. Looking at the industry it is classified as organised and unorganised where the former one contributes to around 30 % and the latter accounts to nearly 70 percent which is an important component of the food industry of Indian. The main reason behind triumph of this industry is fast deliveries, reasonable pricing, new technologies for food ordering, payment options and mobile wallet Cohen (2020).
Statement of the Problem
As there are huge competition and because of the pandemic, retailers are little sceptical about changing preference. Apart from that, consumer today is now more demanding and is well versed with digital technology Goyal & Singh (2007). So, it is imperative to study and understand preference and the factors influencing them while purchasing from QSR’s. The study will throw light on how the consumers’ confidence can be brought back to eat out or order food from online fast-food retailers. Also, many researchers opined that the buying pattern and behaviour will change soon after the pandemic. It has become a crucial concern for many to have a clear-cut understanding of the collective social response to the epidemic Kara et al. (1997).
Brief Review of Literature
Ergin & Akbay, (2014) in their study on consumer preference in international and domestic fast food stated that gender has a huge impact on consumption whereas age has no impact. They studied with five variables like brand name, quality, cost, convenience, and consistency and revealed using regression analysis that among all these conveniences is the most important factor which influence the respondents.
According to Muller and Woods (1994) revealed the typical characteristics of fast-food type restaurants and mentioned that menu with limited dishes is one of them and further stated that low cost, technology driven processes and self-service are the major highlights of these type of restaurants Kotler & Armstrong (2012).
Ahmad et al. (2013) examined Malaysian fast-food preference and in their study, they revealed that there are three important aspects which are substantial towards the consumer’s purchase intension. According to them, in choosing between two outlets between casual dining and fast food, for them the overall surrounding, quality service and food aspects play an important role. Another study conducted by Kaynak et al., (2013) discussed about the seven attributes which are important while deciding and they are capacity of the seating arrangement, pricing, tasty, quickness of service, variety of food and hygiene. Results also indicated that regular buyers preferred location, delivery speed, price, service, and taste and for older one’s preference is cleanliness, friendly staff, and nutritional benefits.
According to Anand (2011), on the young consumers food choice revealed that taste, serializable, ambience and convenience are the major factors which impacted the customers. Cranfield (2020), in his study opined that factor such as gender, age, education, status of employmentetc must be studied as a part of demographic and social aspect to better understand the influence of pandemic on each sector Kumar, (2020) .
Seung-Hee, Baek et al. (2006) in their study mentioned that there are several attributes which youngsters takes into consider while opting for a restaurant and among them are quality, brand, service offered by staff and hygiene related factor Mckinsey (2020).
Joshi (2012) in his study examined the preference of consumers towards restaurants in the city called Dehradun using eight different variables like quality, cost, variety in the menu, cleanliness, location, ambience, and good taste. The findings revealed that people who went for dinner preferred quality and taste.
Habib et al. (2011) in their study examined the consumer preferences by taking various factors like quality, freshness, tasty food, safety, striking packaging, status of halal, health reason, quickness, fast cooking among fast food restaurant and further revealed that safety and food quality is the most important among the students.
Many studies based on digital marketing and social media stated that digital platforms play an important role in the costumers purchase decision. Value and quality and convenience too play an important role when it comes to influencing the purchase behaviour especially during the pandemic.
A study by Rezende and Avelar (2012) revealed that the major reason while people eat out is for variety and desire for convenience on many occasions. It further disclosed that the Brazilian customers with high income level and youngsters have more extensive consumption and have positive attitude towards having food from outside.
Conceptual Framework
Along with the normal factors like price, sales promotional activities, return and refund, availability in stock, and taste to find the consumers’ preference, in the current research, the researchers considered the other important factors to check the influence of them on perception during pandemic are hygiene, safety, value and quality, convenience, and new digital platforms. The significance of each one of them is tested using Chi-square test Figure 1.

Figure 1 Additional Factors Influencing Consumers
Research Design and Methodology
Objectives
• To study the consumer preference towards QSR based on the demographic profile of the customers
• To identify the mode of preference towards QSR during pandemic
• To study the factors affecting consumer preference towards QSR during the pandemic
Research design
The study used only primary data. The data was collected from 204 respondents with the help of convenience sampling. The questionnaire prepared for data collection was validated through both Reliability and Validity tests and it was found that it was strong due to consistency and the scale used in it.
Reliability, validity, and consistency test
Tests like Reliability and Validity was conducted with the designed questionnaire to check the quality of it and below is the results Table 1.
| Table 1 Cronbach ‘Alpha Value | ||
| Serial Number | Questionnaire | Cronbach’ Alpha Value |
| Based on customer respondents | 0.73 | |
The reliability test result value obtained was 0.730 which is well above the required value of 0.60. This indicates that the questionnaire is strong. The Convergent test value obtained was 0.710 which is above 0.50. The normality test shows that the significance values are below the 0.50 which is below the limit. Therefore, the study uses non-parametric test.
Selection of research variables
In the present research study, the variables are considered based on the previous literature and the accessibility of data for them. Variables are of both demographic and those which measures the consumers attitude, influential factors for their preferences. The Likert scale has been used on 1-to-5-point scale for this purpose. The respondents in the study are all types of people who are the decision makers regarding QSR.
Tools for analysis
Simple percentage, and chi square test was used for first objective of the study and later, two LR models have been estimated to study the next two objectives respectively. SPSS 20.0 was used to analyse the data
Logistic Regression
It is a logit model which analyses the association between categorical target variable and metric independent variables. The fitted logistic curve assesses the likelihood of occurrence of event of interest. Logistic regression models are classified as Binary logistic and Multinomial regression based on number of categories of response variable. In the binary logistic regression, the response variable will have only two categories i.e., dichotomous. Whereas, in multinomial logistic regression, the response variable will have more than two categories. In the present study binary logistic regression is used and there is no restriction on independent variables. They can be of continuous or categorical or both. The binary logistic regression will be in the form
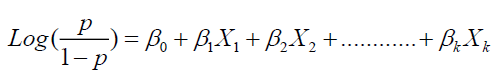
Where p= probability of the outcome of interest which depends on the input values of the independent variables.
β0, β1, β2 …… βk are parameters of the model.
Since logistic regression applies a non-linear log transformation of the linear regression, it
establishes the non-linear associations between response and a set of independent variables. The
function  indicates logarithm of the odds. It is the ratio of the two probabilities of
occurrence and non-occurrence of the event of interest.
indicates logarithm of the odds. It is the ratio of the two probabilities of
occurrence and non-occurrence of the event of interest.
In the logistic regression, the parameters are estimated by maximizing the likelihood function
The evaluation of the fitted logistic regression includes overall performance of the model, goodness of fit, significance of each parameter, outline, and accuracy of the classification. In the present study, SPSS is used for analysis of data.
Estimation of the Fitted Logistic Regression
The overall performance of the fitted model gives the robust relationship between response variable and a set of independent variables. By comparing the two fitted models with independent and without independent variables, an overall performance of the model will be assessed.
The null hypothesis for the overall fit of the model is H0: β1=β2= . . . =βk= 0 against the alternative hypothesis at least one of these parameters is not equal to zero. This hypothesis is tested through likelihood ratio test. The procedure is comparing the two deviances. one deviance is calculated with only intercept (β0) (-2 log likelihood of the null model) and other one is with all independent variables included (-2 log likelihood of the given model).
The likelihood of finding observation with assumption of no effect of independent variables on the outcome is known as likelihood of null model. Similarly, finding the observation by incorporating all independent variables in the model is known as likelihood of the given model. According to (Bewick, Cheek, and Ball, 2005), goodness of fit is nothing but the difference of these two values. It is denoted by χ2 statistic with k degrees of freedom.
This will measure the effect of independent on outcome of the dependent variable. the test used to describe this in logistic regression is Hosmer-Lemeshow likelihood ratio test. The HL test will assess the model population and if the examined proportion of events are like the predicted probabilities of occurrence in subgroups. This test is based on dividing the predicted probabilities into ten groups based on ranks which is percentile and then computing chi-square statistic that compares the predicted to observed frequencies in a 2 x 10 cross table and it will follow χ2distribution (asymptotically) with 8 degrees of freedom.
Analysis and Interpretation
Analysis carried out in two folds. Firstly, descriptive analysis and chi-square tests have been applied on demographic characteristics to understand the preference for QSR, secondly, two LR models have been estimated to identify the purchasing pattern from QSR and to find determinants which influences the preference behaviour Table 2.
| Table 2 Preference of Customers Towards QSR Based on Gender, Age, and Income | |||||||
| Category | Preferer | Non-preferer | Percent of Preferer | Pearson Chi-square | d. f. | Sig | |
| Male | 107 | 23 | 69.4 | 6.634 | |||
| Gender | Female | 47 | 27 | 30.6 | 1 | 0.01 | |
| Up to 25 | 91 | 33 | 59 | ||||
| Age | 26-35 | 41 | 9 | 27 | 8.875 | 3 | 0.031 |
| 36-50 | 17 | 8 | 11 | ||||
| Above 50 | 5 | 0 | 3 | ||||
| Monthly Income | Up to 10000 | 27 | 6 | 18 | |||
| 10001-30,000 | 28 | 12 | 18 | 10.961 | 4 | 0.027 | |
| 30001-40,000 | 61 | 17 | 40 | ||||
| 40,001-60000 | 30 | 15 | 19 | ||||
| 60001 and above | 8 | 0 | 5 | ||||
The respondent’s demography
In the above chi-square test results, the Pearson chi-square statistic is 8.875 and the p-value = 0.01 for the demographic variable gender. Therefore, at a significance level of 0.05, we conclude that the variable is statistically significant. This means customers’ perception towards QSR based on their Sex during the pandemic is significant. Table 4.1 also indicates 69.4 percent of men preferred QSR during pandemic.
For Age, as per the above chi-square test results, the Pearson chi-square statistic is 6.634 and the p-value = 0.031. Therefore, at a significance level of 0.05, we conclude that the variable is statistically significant. This means customers’ preference towards QSR based on their age during the pandemic is significant Table 3 also indicates 59 percent preferers are of age up to 25 years. This suggests that they are the most favourable opinion towards QSR.
| Table 3 Preference for QSR | |
| Variable | Description of the variable |
| X11 | Grab and go |
| X12 | packed service & food safety |
| X13 | Touchless kiosks and ordering systems |
| X14 | curb side pickup and drive thru |
In the above chi-square test results, the Pearson chi-square statistic is 10.961 and the p-value = 0.027 for the demographic variable Income. So, we can state that the variable is statistically significant. This means customers’ preference towards QSR based on their Income during the pandemic is significant. Table 4.1 also indicates 40 percent of respondents whose income is between 30000 - 40000 preferred QSR during pandemic.
LR Model to Identify the mode of Preference towards QSR
The first model is applied to understand the mode of preference for QSR which in turn increases the probability of customer prefers QSR. Initially customers are classified as preferer and non-preferer and coded as 1 and 0. The different variables (modes) considered to check the significance are
a) Performance based on Logistic Model and Goodness of Fit
In the above Table 4, for overall model evaluation, P < 0.05, therefore, H0 is rejected. This means one or more of the independent variables contributes to the prediction of the outcome.
| Table 4 Model Evaluation and Goodness-of-Fit Statistics | ||||
| Test | Category | X2 | d.f | P-value |
| Overall model evaluation | Likelihood Ratio test | 183.594 | 4 | 0.0001 |
| Goodness-of-fit test | Hosmer &Lemeshow | 9.753 | 8 | 0.203 |
In the above table, the P -value corresponding to Hosmer-Lemeshow test is 0.203 which is more than level of significance 0.05. This indicates the goodness-of-fit of the model. It tells that the data fits the model very well.
b) Significance of Individual Regression Coefficients
After checking the significance of the model, each independent variable has been checked using Wald statistic.
According to Table 5, the variables, Grab and go(x11), Prepacked service & food safety (x12), Touchless kiosks and ordering systems (x13), are significant. (P<0.05) this means these variables increases the likelihood of customer preferring QSR. the positive values of β1, β2, and β3 indicates that customers prefer QSR through Grab & go method, pre-packed service, and different ordering systems like Swiggy, Zomato etc during pandemic period.
| Table 5 Results of Tests on Individual Predictors | ||||||
| B | S.E. | Wald | df | Sig. | Exp(B) | |
| Grab and go | 2.129 | 0.466 | 20.854 | 1 | 0.001 | 8.406 |
| Prepacked service & food safety | 0.488 | 0.223 | 4.806 | 1 | 0.028 | 1.629 |
| Touchless kiosks and ordering systems | 1.226 | 0.416 | 8.674 | 1 | 0.003 | 3.407 |
| curb side pickup and drive thru | 0.079 | 0.351 | 0.05 | 1 | 0.823 | 1.082 |
| Constant | -10.752 | 2.124 | 25.634 | 1 | 0.001 | 0 |
Summary of the Model
In the above table 6, the R2 value of Nagelkere is 0.883 which tells that 83.3% of variation in the response variable i.e., outcome (preference for QSR) is due to the independent variables. in the current study, this value of 83.3 % is reasonably good Table 6.
| Table 6 Results of the Model Summary | ||
| Model Summary | ||
| -2 Log likelihood | Cox & Snell R Square | Nagelkerke R Square |
| 43.616 | 0.593 | 0.883 |
Accuracy of the Classification
According to Pend and So, 2002, the predictive accuracy of the LR model can be checked by the method of classification table.
The table 6 gives cross-classification of predicted values and observed values based on the defined cut-off value (probability value). In the present paper, the cut-of values are chosen as 0.5. all predicted values above 0.5 are classified as predicting an event (preferer), and all below 0.5 as not predicting the event (non- preferer)
The degree of agreement of predicted probabilities with observed values is shown in the table 7. The overall percentage of correct prediction is 97.1.
| Table 7 Table of Classification | ||||
| Classification Table | ||||
| Observed | Predicted | |||
| Preference of customers towards QSR | Percentage Correct | |||
| 0 | 1 | |||
| Preference of customers towards QSR | 0 | 46 | 4 | 92 |
| 1 | 2 | 152 | 98.7 | |
| Overall Percentage | 97.1 | |||
This indicates that in the present study, the independent variables i.e., mode of preferences for QSR can classify the respondents in to two categories preferer and non-preferer of QSR. The accuracy of 97.1% implies that the logistic regression model is very good in determining the mode of preference of respondents for QSR.
LR model to Study the Factors affecting the Preference Behaviour during the Pandemic
The second model is applied to find the determinants (factors) of preference for QSR during pandemic period. Initially customers are classified as preferer and non-preferer and coded as 1 and 0. The different variables (factors) considered to check the significance are:
Applicability of LR model has been ensured through four analyses like, overall model fit, significance of each factor, model summary and classification accuracy Table 8.
| Table 8 LR Model Study Factors | |
| Variable | Description of the variable |
| X21 | Price |
| X22 | Convenience |
| X23 | Safety & Quality |
| X24 | Hygiene |
| X25 | Availability |
| X26 | New digital platforms |
| X27 | Taste |
Logistic Model and Goodness of Fit Performance
In the above Table 9, for overall model evaluation, P = 0.000, therefore, H0 is rejected. This means one or more of the independent variables contributes to the prediction of the outcome.
| Table 9 Model Evaluation and Goodness-of-Fit | ||||
| Test | Category | X2 | d.f | P-value |
| Model evaluation | Likelihood Ratio test | 201.14 | 7 | 0.000 |
| Goodness-of-fit test | Hosmer & Lemeshow | 0.536 | 8 | 0.993 |
In the above table, the P -value corresponding to Hosmer-Lemeshow test is 0.993 which is more than level of significance 0.05. This indicates goodness-of-fit of the model. It shows that data fits the model so perfectly.
Significance of Individual Regression Coefficient
After checking the significance of this model, each independent variable has been checked using Wald statistic.
According to Table 10, the variables, Price(X21), Convenience (X22), Safety & quality (X23), availability(X25), and New digital platforms(X26) are significant (P<0.05). This means these variables increase the likelihood of customer preferring QSR. The positive values of coefficients of significant factors indicate they have positive influence on preference for QSR. The factors, availability, New digital platforms like Swiggy, Zomato etc., and Convenience have greater influence on QSR during pandemic period. However, interestingly, customers are not much worried about hygiene or taste of the food while preferring the QSR, since these two are insignificant factors.
| Table 10 Tests for Individual Predictors | ||||||
| Factor | B | S.E. | Wald | df | Sig. | Exp(B) |
| Price | 1.261 | 0.512 | 6.068 | 1 | 0.014 | 3.528 |
| Convenience | 1.521 | 0.641 | 5.64 | 1 | 0.018 | 4.579 |
| Safety and quality | 0.893 | 0.742 | 1.447 | 1 | 0.029 | 2.442 |
| Hygiene | -0.91 | 0.659 | 1.905 | 1 | 0.168 | 0.403 |
| Availability | 5.884 | 2.537 | 5.379 | 1 | 0.02 | 359.387 |
| New digital platforms | 4.392 | 2.105 | 4.352 | 1 | 0.037 | 0.012 |
| Taste | 0.79 | 0.504 | 2.462 | 1 | 0.117 | 0.454 |
| Constant | -7.684 | 2.882 | 7.111 | 1 | 0.008 | 0 |
Summary of the Model
In the above table 11, the R2 value of Nagelkere is 0.913 which tells that 91.3% of variation in the response variable i.e., outcome (preference for QSR) is due to the independent variables. in the current study, this value of 91.3 % is reasonably good.
| Table 11 Results of the Model Summary | ||
| -2 Log likelihood | Cox & Snell R Square | Nagelkerke R Square |
| 26.063 | 0.627 | 0.913 |
Accuracy of the Classification
According to Pend and So, 2002, the predictive accuracy of the LR model can be checked by the method of classification table. The table 12 gives cross-classification of predicted and observed values based on the specified limit (probability value). In this study, cut-of values are chosen as 0.5. All predicted values which are above the value 0.5 are categorized as Preferer, and below 0.5 is considered as non-preferred.
| Table 12 Table of Classification | ||||
| Observed | Predicted | |||
| Preference towards QSR | Percentage Correct | |||
| 0 | 1 | |||
| Preference towards QSR | 0 | 44 | 6 | 88.0 |
| 1 | 7 | 147 | 95.45 | |
| Overall Percentage | 91.72 | |||
The degree of agreement of predicted probabilities with observed values is shown in the table 12. The overall percentage of correct prediction is 91.72
This indicates that in the present study, the independent variables i.e., mode of preferences of consumers for QSR can be classified as two categories such as preferer and non-preferers. The accuracy of 91.72% implies that the logistic regression model is very good in determining the factors for preference of respondents towards QSR.
Discussion and Findings
Ccustomers preference towards QSR based on Demographic characteristics proved that Age, Monthly income, and Sex, have impact on the customers while buying through QSR. The findings are far and more consistent with what Cranfield (2020) mentioned.
We may fail to understand the influence of pandemic on each sector if we ignore socio demographic factors. The study proves that age, sex, education, employment status are all very important factor that cannot be ignored, so the study endorses the results of Rezende and Avelar (2012) and Rauf A. et al. (2012) mentioned regarding age and income.
The above findings clearly indicates that the preference for QSR during pandemic was very much and the major factors are safety & quality, price, availability, convenience, and use of new digital platforms. The study discloses a positive attitude of consumers towards the QSR. The Sex, age, and income of individuals are also significant in buying food through QSR.
However, because of sample size and convenience sample technique adopted in this study, it is difficult to estimate the exact demand for these. The study also reveals the pattern of preference for QSR. The results would help the Indian food companies to identify and establish market space and possibly global expansion. As demographic characters help in understanding the preferences of choice, the companies can focus on the right segments and can develop different tactics to make sure customers avail their products easily and comfortably. Because of the contribution of media, both print and electronic in bringing the awareness about QSR now a days, and high accuracy in the prediction, model can be utilized by companies for classification and bring appropriate strategies to increase the usage of QSR. To be successful, the restaurants must be truthful and transparent with consumers. They must keep the consumers informed with relevant information. To increase the footfalls certain packaging with tamper-proof and labelling which conveys about health-related information and hygiene procedures may help QSR’s. For loyalty, they may have to focus on providing relentless honest messages with customers and ease the pace of transactions, the food retailers must invest on smart menu boards and mobile application ordering systems as these technologies are going to be the future.
Conclusion
Given the existing situation with multiple waves of pandemic, it is obvious that there is a need for more studies in this field. A study on QSR consumer decision making process or impact of adaptation of technology, customer experience and satisfaction can help those companies who are in the transition period. Further studies on panic, impulse buying and trends that shape the buying behaviour also would help the marketers to rethink and take appropriate measures to meet the ever-changing needs of the consumers. Also, this study has taken only few independent variables; so future researchers may use different variables to explore more on QSR buying behaviour.
References
Anand, R. (2011). A study of determinants impacting consumers food choice with reference to the fast-food consumption in India. Society and Business Review.Vol.6, No.2, pp 176-187
Indexed at, Google scholar, Cross ref
Bhardwaj, R. (2011). Perception about the attributes of selected fast food retailers and their impact on consumer satisfaction and sales. Management Convergence, 1(2), 83-102.
Bryant, R., & Dundes, L. (2008). Fast food perceptions: A pilot study of college students in Spain and the United States. Appetite, 51(2), 327-330.
Indexed at, Google scholar, Cross ref
D’Acunto, F., Rauter, T., Scheuch, C. K., & Weber, M. (2020). Perceived precautionary savings motives: Evidence from fintech (No. w26817). National Bureau of Economic Research.
Carvalho, V., Garc?a, J. R., Hansen, S., Ortiz, A., Rodrigo, T., Mora, J. V. R., & Ruiz, P. (2020). Tracking the COVID-19 crisis through the lens of 1.4 billion transactions. VoxEU. org, 27, 9696-9698.
Chronopoulos, D. K., Lukas, M., & Wilson, J. O. (2020). Consumer spending responses to the COVID-19 pandemic: an assessment of Great Britain. Available at SSRN 3586723.
Indexed at, Google scholar, Cross ref
Cohen, M. J. (2020). Does the COVID-19 outbreak mark the onset of a sustainable consumption transition?. Sustainability: Science, Practice and Policy, 16(1), 1-3.
Goyal, A., & Singh, N. P. (2007). Consumer perception about fast food in India: an exploratory study. British food journal.
Kara, A., Kaynak, E., & Kucukemiroglu, O. (1997). Marketing strategies for fast-food restaurants: a customer view. British Food Journal, 99(9), 318-324.
Kotler, P., & Armstrong, G. (2012). Principles of marketing 14th edition. New Jearsey: Pearson Education Inc, 67.
Kumar, A. M. (2020). Potential Impact of Covid19 on the Indian Economy. KPMG in India analysis 2020.
Mckinsey . (2020). Global surveys of consumer sentiment during the coronavirus crisis.
Muller, C. C., & Woods, R. H. (1994). An expanded restaurant typology. Cornell Hotel and Restaurant Administration Quarterly, 35(3), 27-37.
Indexed at, Google scholar, Cross ref
Rauf, A. A., & Butt, I. (2012). Consumer perceptions of foreign fast food restaurants in an emerging market. International Journal of Leisure and Tourism Marketing, 3(1), 40-70.
de Rezende, D. C., & de Avelar, A. E. S. (2012). Factors that influence the consumption of food outside the home in Brazil. International Journal of Consumer Studies, 36(3), 300-306.
Indexed at, Google scholar, Cross ref
Tiwari, P., & Verma, H. (2008). Consumer Perception About Fast Food in India: An Empirical Study of Dehradun City. ICFAI Journal of Consumer Behavior, 3(4).
Walker, J. R., & Lundberg, D. E. (2007). Study Guide to Accompany The Restaurant: From Concept to Operation, 5e. John Wiley & Sons.
Yang, C. L., Khoo-Lattimore, C., & Lai, M. Y. (2014). Eat to live or live to eat? Mapping food and eating perception of Malaysian Chinese. Journal of Hospitality Marketing & Management, 23(6), 579-600.
Indexed at, Google scholar, Cross ref
Received: 05-Jul-2022, Manuscript No. AMSJ-22-12302; Editor assigned: 08-Jul-2022, PreQC No. AMSJ-22-12302(PQ); Reviewed: 16- Jul-2022, QC No. AMSJ-22-12302; Revised: 20-Aug-2022, Manuscript No. AMSJ-22-12302(R); Published: 06-Sep-2022