Research Article: 2021 Vol: 25 Issue: 6
Understanding Financial Inclusion In the Brics
Farid Ahmed, Research Scholar, Shri Mata Vaishno Devi University, Katra
Roop Lal Sharma, Assistant Professor, Shri Mata Vaishno Devi University, Katra
R. Gopinathan, Assistant Professor, Shri Mata Vaishno Devi University, Katra
Citation: Ahmed., F. Gupta., S., Sharma, R.L., & Gopinathan., R. (2021). Understanding financial inclusion in the brics. Academy of Marketing Studies Journal, 25(6), 1-10.
Abstract
Keywords
BRICS; Determinants; Financial Inclusion.
Introductions
Financial inclusion understood as the accesses to and use of financial services, allows individuals to store money in a safe place, access to credit, and manage financial risk. It improves the quantity, quality, and efficiency of financial services. Access to and use of basic financial services such as credit, saving, insurance, and risk management can facilitate sustained growth and productivity. Financial inclusion is an important tool to increase women's empowerment and enhances financial stability. The financial inclusion policies have played an important role in the development of the BRICS countries1. As far as the BRICS2 countries are concerned, financial inclusion has received a renewed focus in recent years. In India, for example, the government in the year 2014 launched a financial inclusion scheme popularly known as the “Pradhan Mantri Jan Dhan Yojana (PMJDY)”. Under this scheme, a large number of no-frills accounts were opened. In Brazil, financial inclusion has received impetus through improvement in distribution channels, adoption of social target programs linked to formal accounts and adoption of financial services by low-income groups.
Mzansi accounts, one more success story of financial inclusion in South Africa is a low-cost national banking account scheme to enhance financial inclusion. Likewise, same policies have been introduced in other BRICS countries.
Despite all these measures, the BRICS countries still present a dismal picture of financial inclusion in terms of usage of accounts. According to the Global Findex Report 2017 [Henceforth GFR (2017)], a vast majority of the population remains financially excluded in the BRICS countries. The total share of adults with ownership of formal accounts according to GFR (2017) stands at 70% in Brazil, 76% in Russian Federation, 80% in India, 80% in China, and 69% in South Africa. The percentage of adults (above 15 years of age) that have saved in the past 12 months has increased from 10% in 2011 to only 14% in 2017 in Brazil, 11% in 2011 to 14% in 2017 in Russia, 12% in 2011 to only 20% in 2017 in India, 32% in 2011 to 35% in 2017 in China.
Financial inclusion in the BRICS countries, therefore, deserves apt attention. A significant body of literature over the years has accumulated on the research related to financial inclusion. To the best of our knowledge, no study uses the Global Findex Database 2017 to analyse financial inclusion in the BRICS. This study, therefore, endeavours to shed some light on financial inclusion in the BRICS. In particular, we intend to understand the determinants of financial inclusion in the BRICS using different proxies for financial inclusion. We have done several extensions to the studies conducted using Findex 2011 and Findex 2014 datasets for the countries other than the BRICS. Specifically, we mention those refinements in the Results and Discussion section.
The remainder part of this paper is structured as follows. Section 2 describes the stylized facts about financial inclusion in the BRICS. Section 3 literature review is presented. Section 4 is devoted to the study of Data and Methodology. In section 5 the results are drawn and discussed thoroughly. The paper concludes with section 6.
Stylized Facts about Financial Inclusion in BRICS
Ownership of Formal Accounts By Gender, Age, Education And Income
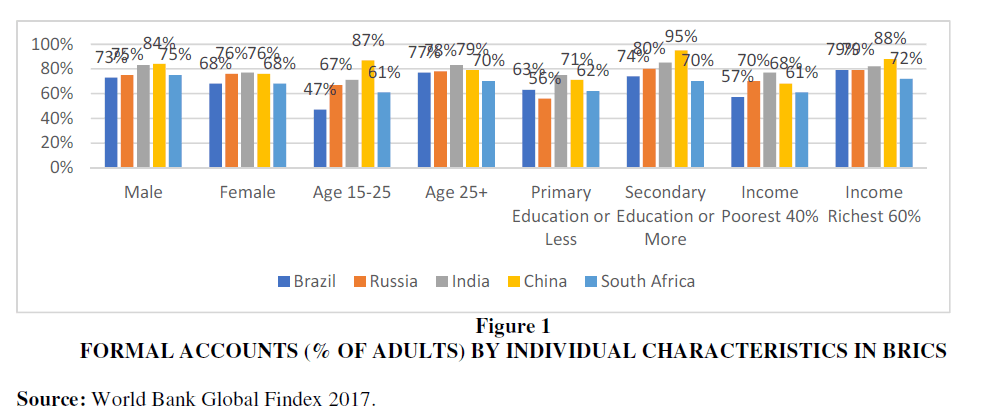
Figure 1 shows the ownership of formal accounts by gender, age, education and income. In China, according to GFR (2017), 84% male population reported ownership of accounts, followed by India, South Africa, Russia, and Brazil respectively. Similarly, the female population to have reported the ownership of accounts is 77% in India followed by 76% in Russia and China and 68% in Brazil and South Africa. Probably led by the flagship targeted financial inclusion program of the Indian government in 2014, the account owner for both males and females is highest in India. It can also be seen that the percentage ownership of formal accounts by young adults (age 15-25) is highest in China, followed by India, Russia, South Africa and Brazil. Similarly, the percentage ownership of formal accounts by adults (age 25 or above) is 83% in India followed by 79% in China, 78% in Russia, 77% in Brazil and 70% in South Africa
Figure 1: Formal Accounts (% of Adults) by Individual Characteristics in BRICS
Source: World Bank Global Findex 2017.
Figure 1 Ownership of Formal Accounts (%of Adults) By Individual Characteristics in BRICS Countries
Savings behaviour by gender, age, education and income
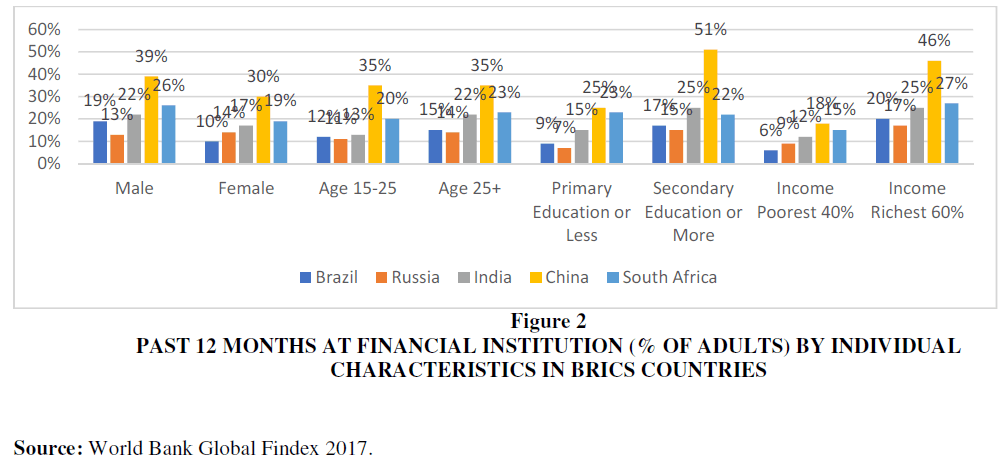
Figure 2 shows the saving in the past year at a financial institution by gender, age, education and income. In China, according to GFR (2017), 39% male population reported having saved money in the past year, followed by South Africa, India, Brazil and Russia respectively. Similarly, the female population to have reported the saving money in past 12 months is 30% in China followed by 19% in South Africa, 17% in India, 14% in Russia and 10% in Brazil. The saving for both males and females is highest in China among other BRICS countries.
Figure 2: Past 12 Months at Financial Institution (% of Adults) by Individual Characteristics in BRICS Countries
Source: World Bank Global Findex 2017.
Figure 2 Saved in the Past 12 Months at Financial Institution (% of Adults) By Individual Characteristics in BRICS Countries
Brazil and 7% in Russia. Similarly, the savings by secondary or more educated adults is highest in China, followed by India, South Africa, Brazil and Russia respectively. In general adults with secondary or more education save more. Finally, it can be seen that the savings by the poorest 40% of people are highest in China followed by South Africa, India, Russia and Brazil respectively. Savings by the richest 60% almost follow the same pattern.
Borrowing Behaviour by Gender, Age, Education and Income
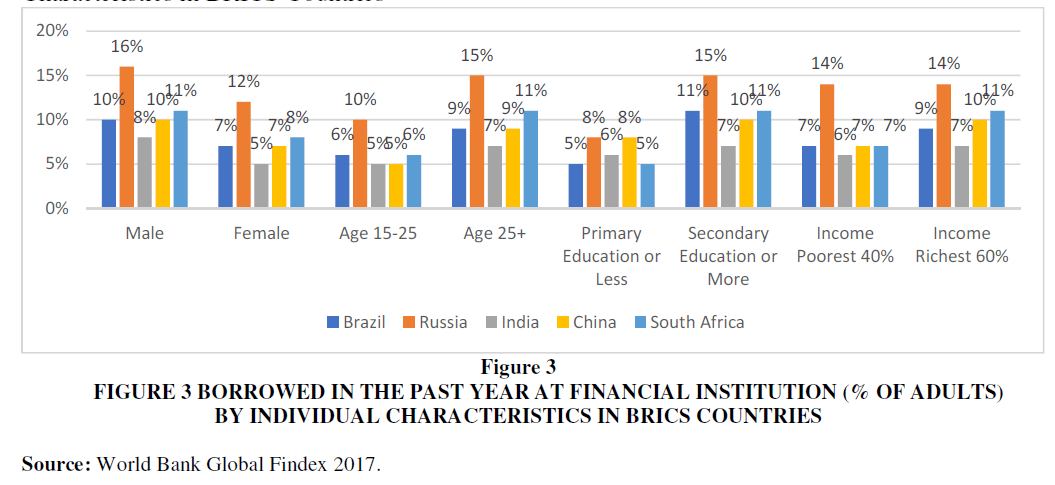
Figure 4 shows the borrowing behaviour by gender, age, education and income. In Russia, according to GFR (2017), 16% male population reported having institutionally borrowed money in the past year, followed by South Africa, Brazil, China and India, respectively.
Figure 3 Borrowed in the Past Year at Financial Institution (% of Adults) By Individual Characteristics in BRICS Countries
Figure 3: Borrowed in the Past Year at Financial Institution (% of Adults) by Individual Characteristics in BRICS Countries
Similarly, the female population to have reported borrowings is 12% in Russia followed by 8% in South Africa, 7% in China and Brazil and 5% in India. The borrowing for both males and females is highest in Russia among other BRICS countries.
Ownership of Debit Card by Gender, Age, Education and Income
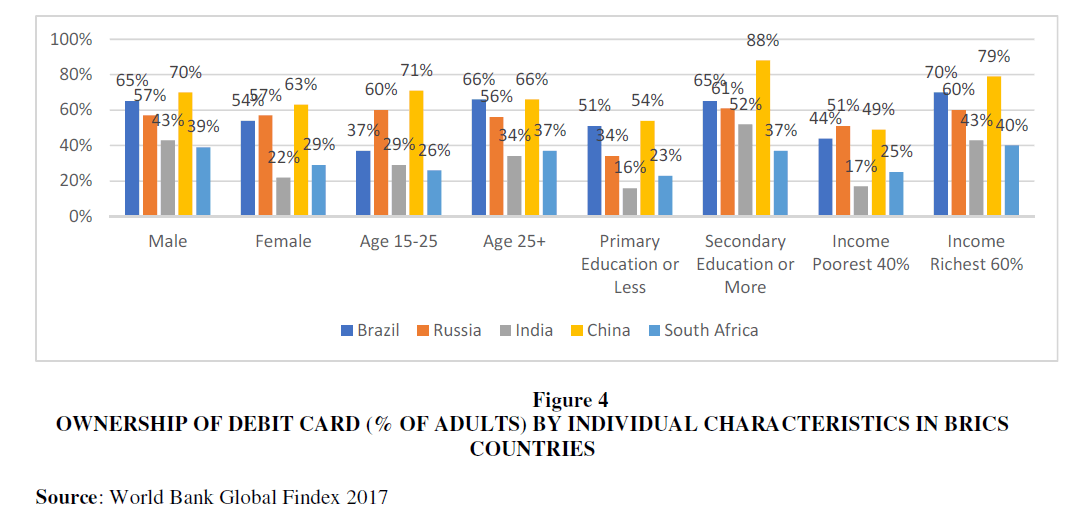
In Figure 4, the ownership of the debit card by gender, age, education and income is shown. In China, according to GFR (2017), 70% male population reported ownership of the debit card, followed by Brazil, Russia, India and South Africa respectively. Similarly, the female population to have reported the ownership of debit cards is 63% in China followed by 57% in Russia, 54% in Brazil, 29% in South Africa and 22% in India. The ownership of debit cards for both males and females is highest in China among other BRICS nations.
Figure 4: Ownership of Debit card (% of Adults) By Individual Characteristics in BRICS Countries
Source: World Bank Global Findex 2017
Finally, we see that the percentage ownership of the debit card by adults belonging to the poorest 40% income group is highest in Russia, followed by China, Brazil, South Africa, and India respectively.
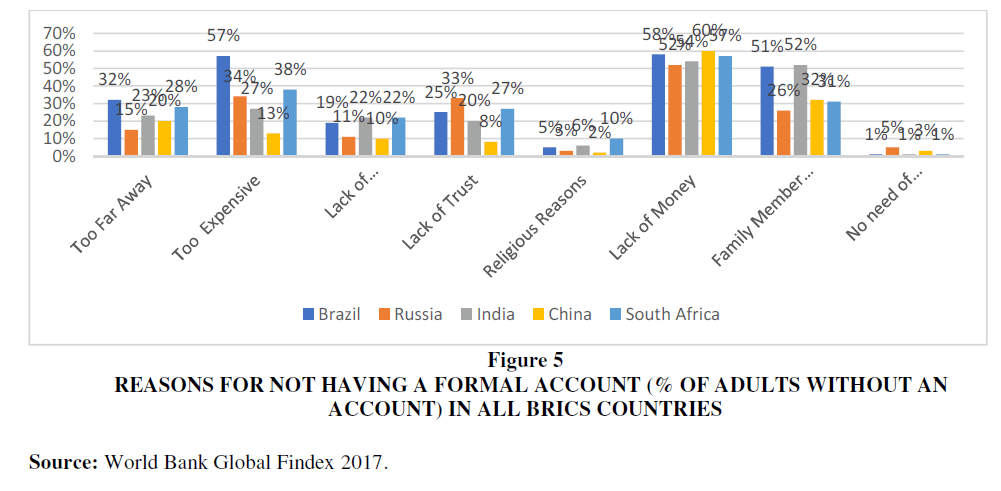
Reasons For Not Having A Formal Account
Figure 5 shows the reasons given by respondents for not having an account at the formal financial institutions in BRICS countries. Respondents offer different reasons for not having an account. In Brazil, 32% of respondents’ report reasons for not having financial accounts as financial institutions being “too far away” followed by 28% in South Africa, 23% in India,
Figure 5: Reasons for Not Having a Formal Account (% of Adults without an Account) in All BRICS Countries
Source: World Bank Global Findex 2017.
20% in China and 15% in Russia. In Brazil, 57% of the population reported “high cost/too expensive” as the reason for not having an account followed by 38% in South Africa, 34% in Russia, 27% in India and 13% in China.
The seventh, yet important, reason reported by adults for not having an account is the “family member has an account”. This is highest (52%) for India followed by 51% in Brazil, 32% in China, 31% in South Africa and 26% in Russia. In India, most of the people follow a traditional customary to hold a single account per family which leads to a lesser number of accounts held by adults. The last reason for not having a formal account “no need for financial services” again seems to have a lower influence on having formal accounts.
Review of Literature
A voluminous body of literature has been devoted to study financial inclusion in different countries. Nevertheless, there is a scant body of literature that uses Global Findex databases to analyse financial inclusion. A huge body of literature has been devoted to study financial inclusion in different countries. For example, the study conducted by Allen et al., (2012) by using the 2011 World Bank Global Findex Database found that the probability of owning an account and saving at a formal financial institution is higher for richer, more educated, older, urban, employed individuals. While Demirguc-Kunt and Klapper (2012a) have given the worldwide statistics about financial inclusion with the 2011 Global Findex Database, Demirguc-Kunt and Klapper (2012b) by using the 2011 Global Findex Database has studied the financial inclusion in Africa. The results show that in Africa ownership of formal accounts at a formal financial institution is very low. Also, most of the adults in Africa use informal methods for saving and borrowing. Demirguc-Kunt et al. (2013) investigated the use of financial services in 98 developing countries. Using the 2011 Global Findex Database, they analysed the impact of individual characteristics like income, education, employment status, rural residency, age, and gender on financial inclusion. They found that income, employment, and education have a positive impact on financial inclusion. Also, their results show that in some countries where women face legal restrictions are less likely to own bank account. Fungáčová and Weill (2015) by using the Global Findex Database 2014 analysed the financial inclusion in China. They found that the probability of owning an account at a formal financial institution is higher for richer, educated, and older men. They also found that income and education have a positive impact on financial inclusion. Using the 2014 World Bank Global Findex Database Zins and Weill (2016) studied financial inclusion in 37 African countries. Their results have shown that being a man, richer, more educated and older people favour financial inclusion with the relatively more impact of education and income. Shaikh et al., (2017) studied the role of Islamic banking on financial inclusion using the Global Financial Development Report 2014. Their estimates showed that less than 10% of the poor people are under the purview of microfinance. Demirguc-Kunt et al. (2018) measured financial inclusion at the global level. The results show that 69 percent of adults globally have an account at formal financial institutions. It also found that 94% of adults in high-income countries and 63% in developing countries have formal accounts respectively. Dar and Ahmed (2020) study the determinants of various measures of financial inclusion in India. The study finds that being a woman, educated and rich favours financial inclusion in India. Shihadeh (2018) study revealed that high cost and lack of money are the most important barriers to financial inclusion in MENAP countries. Khmous and Besim (2020) explored the impact of Islamic banking shares on financial inclusion in 14 MENA countries. Their study finds that female is negatively associated with most of the barriers to financial inclusion. While education is positively associated with most of the barriers to financial inclusion. It means educated individuals reduced the probability of barriers to financial inclusion in MENA countries.
Demirguc-Kunt et al., (2013) studies indicate that violence against women and early marriages explain the differences in account ownership among genders. While education and higher income significantly reduced the gender gap in account ownership, formal saving, and borrowing. Stronger political stability and legal rights also promote financial inclusion Allen et al. (2016). Using the 1990-2013 World Development Indicator (WDI) and Financial Access Survey (FAS) data, Kim et al. (2017) studied the nexus between financial inclusion and economic growth in the Organization of Islamic Cooperation (OIC) countries. They found that financial inclusion has a positive impact on economic growth.
The studies related to financial inclusion in the BRICS are limited and don’t focus on the determinants and impediments. There are hardly any studies that entirely focus on either determinants or barriers to financial inclusion in the BRICS countries.
Data and Methodology
We have collected the data from the World Bank’s Global Findex Database 2017 released in October 2018. The national representative survey covers more than 150,000 adults in over 140 countries around the world. The sample size is 1000 for Brazil, 1999 for Russian Federation, 3000 for India, 3627 for China and 1000 for South Africa. The targeted population is aged 15 years and above. The Global Findex Database provides a large number of financial inclusion indicators such as ownership of a formal account, use of account for formal saving, use of account for formal credit, ownership of debit card and the use of debit cards. Additionally, it also provides micro-level information of four individual characteristics; income, age, education and gender. Initially, we intend to understand the determinants of financial inclusion. To do that, we use the Probit model to estimate Equation (1). The dependent variable here represents the five different measures of financial inclusion and the independent variables are gender, age, income and education (Table 1). We estimate the following equation.
| Table 1 Descriptive Statistics of the Independent Variables used in the Estimation |
|||
| Definition | Observations | Mean | |
|---|---|---|---|
| Female | Dummy variable equal to one of the individuals is a woman, zero otherwise | 10,626 | 0.5594768 |
| Age | Age in numbers | 10,606 | 43.6732 |
| Income -Poorest 20% | Dummy variable equal to one if income is in the first quintile, zero otherwise | 10,626 | 0.1976285 |
| Income -Second 20% | Dummy variable equal to one if income is in the second quintile, zero otherwise | 10,626 | 0.1914173 |
| Income -Third 20% | Dummy variable equal to one if income is in the third quintile, zero otherwise | 10,626 | 0.19377 |
| Income -Fourth 20% | Dummy variable equal to one if income is in the fourth quintile, zero otherwise | 10,626 | 0.2033691 |
| Income- Richest 20% | Dummy variable equal to one if income is in the fifth quintile, zero otherwise | 10,626 | 0.2138152 |
| Primary Education | Dummy variable equal to one of the individuals has completed primary school or less, zero otherwise | 10,576 | 0.5081316 |
| Secondary Education | Dummy variable equal to one if the individual has completed secondary education, zero otherwise | 10,576 | 0.3930598 |
| Tertiary Education | Dummy variable equal to one if the individual has completed tertiary education or more, zero otherwise | 10,576 | 0.0982918 |
Data Source: World Bank Global Findex database

Where FI is the proxy for financial inclusion represented by different financial inclusion indicators. Following Zins and Weill (2016) we use three indicators; viz; ownership of a formal account, ownership of formal saving, ownership of formal credit, ownership and use of the debit card as a proxy of financial inclusion. In our study, we have thus used five different measures of financial inclusion. In the case of independent variables, four characteristics of individuals such as Gender (Female is equal to one zero otherwise) have been used. We have five different income groups, use four dummies variables (poorest 20%, second 20%, third 20%, fourth 20%) and omitted the richest 20% income quintiles. As far as education is concerned, we have primary, secondary and tertiary education in which we have only dummies of secondary and tertiary education used for our estimation.
Results and Discussion
We present the results of our analysis in this section. To analyse the determinants of financial inclusion we estimate the equation (1). Five different measure of financial inclusion is taken as dependent variables unlike only three used in Fungacova and Weill (2015) and Zins and Weill (2016). This study is therefore an important extension in this direction. This analysis extends the previous work by incorporating two more measures of financial inclusion viz; Ownership of debit cards and Use of debit cards. The total number of financial inclusion measures are ownership of a formal account, use of account for formal saving, use of account for formal credit, Ownership of debit card and Use of debit card. The independent variables are Gender (Male or Female), Age (Years), Income (divided into five different quintiles) and Education (Primary, Secondary and Tertiary). To introduce non-linearity in age we add the square of age as an extra dependent variable. Except for age, all the variables are dummies. The choice of independent variables is guided by several considerations. First, the World Bank’s Global Findex report 2017 reports the data of all these variables. Second, a scant body of literature that studies financial inclusion in different countries uses all these variables as the determinants of financial inclusion [See for example; Allen et al, 2012; Fungacova and Weill 2015 and Zins and Weill 2016]. Our choice of including more explanatory variables is thus limited, given that the World Bank’s Global Findex reports only these variables as the determinants of financial inclusion. The results of the Probit estimation are shown in Table 2. It can be seen that variables are significant with varying signs. Gender (female), for example, is significantly negative, which means women are less likely to have formal accounts than their male counterparts. While age is positive and significant, squared age is negatively significant. The likelihood of having accounts increases with age, however, decreases when people become too old. All the income quantiles are significant, meaning, income has a significant impact on the use of formal accounts. Since the coefficient is negative and decreases with the higher income brackets, we can infer that people with higher incomes are likely to own the accounts. The same results are true for education as well. Education has a significant impact on the ownership of accounts and higher educated are more likely to have the ownership of accounts. These results hold for the other measures of financial inclusion like Formal credit and the Ownership of debit cards. The results are slightly different when the dependent variable (Measure of financial inclusion) is Formal Savings and Use of debit cards. Age and Secondary education are insignificant determinants of Formal savings. In the case of the use of debit cards squared age is insignificant, meaning, older people don’t use debit cards.
| Table 2 Determinants of Financial Inclusion in the BRICS Countries |
|||||
| Variables | Formal accounts | Formal saving | Formal Credit | Ownership of debit card | Used of debit card |
|---|---|---|---|---|---|
| Female | -0.0467*** | -0.0555*** | -0.0268*** | -0.0519*** | 0.0442*** |
| (0.00825) | (0.00988) | (0.00678) | (0.0103) | (0.0135) | |
| Age | 0.00985*** | 0.00226 | 0.00872*** | 0.0153*** | 0.000351 |
| (0.00121) | (0.00157) | (0.00124) | (0.00161) | (0.00243) | |
| Age2 | -0.000109*** | -2.61e-05 | -9.88e-05*** | -0.000164*** | -5.89e-05** |
| (1.26e-05) | (1.68e-05) | (1.37e-05) | (1.70e-05) | (2.60e-05) | |
| Income – Poorest 20% | -0.160*** (0.0132) |
-0.268*** (0.0165) |
-0.0214* (0.0111) |
-0.202*** (0.0164) |
-0.175*** (0.0221) |
| Income – Second Poorest 20% | -0.123*** (0.0134) |
-0.194*** (0.0154) |
-0.0201* (0.0107) |
-0.185*** (0.0161) |
-0.130*** (0.0217) |
| Income – Third Poorest 20% | -0.0807*** (0.0135) |
-0.125*** (0.0145) |
-0.0293*** (0.0103) |
-0.121*** (0.0160) |
-0.0736*** (0.0197) |
| Income Fourth Poorest 20% | -0.0452*** (0.0137) |
-0.0527*** (0.0137) |
-0.0150 (0.0137) |
-0.0617*** (0.0159) |
-0.0383** (0.0189) |
| Secondary Education | 0.0795*** (0.00903) |
0.00528 (0.0111) |
0.0539*** (0.00782) |
0.164*** (0.0110) |
0.217*** (0.0138) |
| Tertiary Education | 0.198*** (0.0172) |
0.0626*** (0.0161) |
0.0808*** (0.0107) |
0.259*** (0.0182) |
0.365*** (0.0212) |
| Observations Pseudo R2 Log likelihood |
10,562 0.0512 -5613.7449 |
7,823 0.0481 -4428.3618 |
7,892 0.0349 -2532.3498 |
7,869 0.0785 -4741.2053 |
4,518 0.1336 -2669.4313 |
On top of the columns are the dependent variables. The first column shows the independent variables. The estimated coefficients are the marginal effects and numbers in parentheses indicate the Robust standard errors. ***, **, * denote the significance level at 1%, 5% and 10% levels respectively.
Barring the use of Debit cards as the measure of financial inclusion, women are less likely to be financially included in the BRICS countries. When compared with previous studies we find that results are mostly similar. Our results simply authenticate studies like Fungacova and Weill (2015) and Zins and Weill (2016).
Conclusion
Financial inclusion in the BRICS has been the primary focus of the respective governments. Yet, gauzed by different measures, financial inclusion in terms of savings and use of accounts for borrowing remains low in these countries. Understanding financial inclusion in the BRICS countries is thus important. This study was conducted to understand financial inclusion in the BRICS using the latest data from GFR (2017) released in 2018. The results drawn provided several insights into financial inclusion in the BRICS. While the account ownership has increased substantially over the years in the BRICS, the use of accounts for savings and borrowings hasn’t picked up. We also found that being male, richer, more educated and older favours financial inclusion. Females are less likely to be financially included in the BRICS. It can also be seen that barriers to financial inclusion change with individual characteristics. In general, BRICS economies should focus on financial education-promoting policies to enhance financial inclusion. Also, the increase in growth in the BRICS would naturally push up financial inclusion.
References
- Allen, F., Demirguc-Kunt, A., Klapper, L., Peria, M, S, M. (2012), “The foundations of financial inclusion: Understanding ownership and use of formal accounts.”Journal of Financial Intermediation. Doi: 10.1016/j.jfi.2015.12.003
- Asli, D. K., Klapper, Leora, F. (2013), “Financial Inclusion and Legal Discrimination against Women: Evidence from Developing Countries.” WorldBank Policy Research Working Paper, 6416.
- Dar, A.B., Ahmed, F. (2020), “Financial inclusion determinants and impediments in India: insights from the global financial inclusion index", Journal of Financial Economic Policy,. doi.org/10.1108/JFEP-11-2019-0227.
- Demirgüç-Kunt A., Klapper, L. (2012b), “Financial inclusion in Africa. Policy Research Working Paper”. The World Bank Development Research Group Finance and Private Sector Development Team, 1-18.
- Demirgüç-Kunt, A., Klapper, L. (2012a), “Measuring financial inclusion”. Brookings Papers on Economic Activity, Spring, 279-340.
- Demirguc-Kunt, A., Klapper, L., Singer, D., Ansar, S., Hess, J. (2018), “The Global Findex Database 2017: Measuring Financial Inclusion and the Fintech Revolution”. The World Bank.
- Fungáčová, Z., Weill, L. (2015), “Understanding financial inclusion in China”. China Economic Review, 34, 196-206.
- Kim, D. W., Yu, J. S., Hassan, M. K. (2018), “Financial inclusion and economic growth in OIC countries”. Research in International Business and Finance, 43, 1-14.
- Khmous, D. F., & Besim, M. (2020). Impact of Islamic banking share on financial inclusion: evidence from MENA. International Journal of Islamic and Middle Eastern Finance and Management. Vol. 13(4), pages 655-673, July.
- Shaikh, S. A., Ismail, M. A., Shafiai, M. H. M., Ismail, A. G., Shahimi, S. (2017), “Role of Islamic Banking in Financial Inclusion: Prospects and Performance”. In Islamic Banking (pp. 33-49). Palgrave Macmillan, Cham.
- Shihadeh, F. H. (2018). How individual’s characteristics influence financial inclusion: evidence from MENAP. International Journal of Islamic and Middle Eastern Finance and Management. vol. 11(4), pp. 553-574.
- Zins, A., Weill, L. (2016), “The determinants of financial inclusion in Africa”. Review of Development Finance, 6(1), 46-57.
