Research Article: 2019 Vol: 20 Issue: 2
Which are More Vulnerable to the Oil Price Volatility Emerging or Developed Countries Stock Markets
Algia Hammami, University of Sfax
Ameni Ghenimi, University of Tunis
Abdelfatteh Bouri, University of Sfax
Abstract
In this work, our objective is to study the transmission of volatility between oil and stock markets in the developed countries (USA, Germany, Italy, France and Japan) and the emerging ones (Thailand, Brazil, and Argentina) for the period 1998-2015. Our methodology consists of analyzing the monthly data using GARCH-BEKK model, to capture the effect of volatility the oil price on the different stock markets. The empirical results in the emerging countries indicate that the relationships are unidirectional from the stock market to the oil market. For the developed countries, we find that the transmission of volatility is unidirectional from the oil market to the stock market. In the USA and Italy, no transmission was found between oil prices and stock market. The transmission is bidirectional only in Thailand. Regarding the shock transmission, it can be said that the emerging countries are affected by the oil price shocks at the same level as the developed countries. However, for the effect of transmission of volatility, there is a great difference between these two types’ countries. The GARCH-BEKK model is more effective than the other versions to minimize the risk of the oil-stock portfolio
Keywords
Volatility Transmission, Oil Prices, Stock Markets, Multivariate GARCH.
Introduction
Crude oil is one of the most important products. Today, oil price fluctuations are responsible for the economic recession due to the decline of productivity, inflation, and growth. This means that the increased risk and uncertainty have a negative impact on the share prices and therefore reduced the wealth and investment.
Empirically, several studies have been developed to analyze the impact of oil prices on the stock returns in the developed countries, such as O'Neil et al. (2008) for USA, UK and France, Park & Ratti (2008) for the USA and 12 European countries that are net importers of oil, Reboredo & Rivera-Castro (2013) for the S & P 500 and Dow Jones Stoxx.
Today, emerging countries become more vulnerable to volatile oil prices. In fact, most studies dealt with Russia, Brazil, South Africa, the Asian countries (China, India) and the countries of GGG. The findings of these studies show that these emerging countries are likely to be more affected by the volatility of oil prices than developed countries. Similarly, the available statistics on the growth rate confirms these conclusions.
The vulnerability of a country to a rise of oil prices can be measured by the import-volume of oil. According to the Energy Information Administration (EIA), the United States are the largest importer of oil. In 2014, they become the largest consumer of oil in the world. They greatly differ from the other OCDE members whose consumption decreased for nearly ten years under the effect of the economic downturn and energy efficiency policies. The Japanese economy is highly industrialized and relies heavily on oil as an energy source. As a consequence, it is the second largest oil importer after the United States with about 5, 3% of the total consumption of the world’s oil. According to International Energy Agency report in 2009, the oil imports in Japan stood at 3.408 mbd. On the other hand, and according the Organization for Economic Co-operation and Development (OECD),the growth of oil import is no longer supported by the developed countries, but supported by some emerging countries such as Brazil and Thailand. According to the scenario of the International Energy Agency (IEA), the annual rate of imported oil in Thailand was on average 793,900 (thousand barrels per day) in 2011, while the same rate for Brazil and Argentina was only 343 and 28 (thousand barrels per day). Thailand is becoming increasingly dependent on the changes of oil prices compared to other countries.
We cannot study the relation between oil prices and the stock market in the emerging and developed countries without making a distinction between the stock markets of each region. As stated earlier, the emerging markets tend to have higher growth than the developed ones. Owing to their higher potential growth, the emerging markets also have a higher risk. In fact, the emerging markets share the same risk categories as the developed ones, but risk levels tend to be heightened. In addition, the share list on the emerging market exchanges can be more volatile and less liquid than those of the developed counterparts. The feelings of investors with regard to volatility can quickly shift with changes in the global growth forecasts, which make the performance of upward or downward. Besides, most emerging economies have gone through financial reforms and their markets have become more competitive and open.
At the level of imports of oil, the developed markets are considered more vulnerable than the emerging markets. On the other hand, most of the emerging countries have a high level of economic development with a rapid industrialization. This information does not enable us to identify the nature of the relationship between the stock market and the oil market. For this reason, this paper is based on the work of Gomes & Chaibi (2013); Oskooe (2011); Arouri et al. (2011) to analyze the transmission of shocks in the financial markets and oil prices in the emerging countries (Argentina, Thailand, and Brazil) and the developed ones (USA, Germany, Italy, France and Japan) between 31 January 1998 and 31 December 2015.
In order to answer this question, we use the recent economic analysis based on the VAR model (1) -GARCH-BEKK (1.1) bi varied. This model has the advantage of studying the effects cross interdependence and volatility transmission between the representative series of the stock indices in the emerging and developed countries and the WTI crude oil index.
Our paper includes two complementary sections. In Section 1, we will briefly describe a review of the empirical literature on the impact of oil prices on the stock exchanges on which our empirical study is based. In the second section; we analyze the transmission of volatility between oil prices and stock markets. Within the empirical part, firstly, we are interested in an overview of the varying measures. Second, we try to check all of the above assumptions by using a sample of indices of developed and emerging countries.
Literature Review
The relationship between oil prices and stock market activity has been investigated by many scientists in the last decades. The literature review is threefold. First, the literature that deals relationship between oil prices and stock markets by using the international multifactor model. Second, the literature about the relationship between oil prices and the stock market by using VECM and VAR. Third, the literature review, which uses the GARCH method. The three studies found different results. Therefore, this section is divided into three main subsections according to the estimation method used.
Oil price and Stock Market Index by Using the APT Model
There are several studies have used the higher order conditional moments to analyze the relationship between oil prices and stock markets, such authors as Basher & Sadorksy (2006); Sadorksy (1999); Park & Ratti (2008); Conrad et al. (2014); Maghyereh et al. (2016). All these studies analyzed the relationship between oil price risk and stock markets in a CAPM framework.
Sadorksy (2001) investigated the reaction of the Canadian oil and gas industry equity returns to oil price movements using an international multifactor model. His findings suggest that the Canadian stock returns vary with the oil price increase.
In the same way, Basher & Sadorksy (2006) examined the reaction of the stock market returns to oil price risk using an international multifactor model that took into account conditional and unconditional risk factors like, market risk, oil price risk, exchange rate risk and three higher moments, such as total risk, skewness, and kurtosis. The results of the investigation revealed strong evidence of reaction of the stock market to oil price risk.
In (2013), Dimitrios Asteriou & Yuliya Bashmakova studied the relationship between oil price risk and stock market returns for the emerging capital markets of the Central and Eastern European Countries by using the international multi-factor model. A panel data approach was employed for the period between 22 October 1999 and 23 August 2007. Their findings suggest that oil price beta is negative and statistically significant, suggesting that oil price is indeed an important factor in determining the stock returns. No significant non-linear dependency was found between the market risk and the stock market returns or between oil price risk returns. Regarding the conditional models, the results showed a positive reaction of the emerging stock market returns to upward movements of the market returns. Typically, the reaction of the stock market returns to fluctuations of the oil market is also negative, but more significant when oil prices are low.
Oil Price and Stock Market Index by Using VAR and VECM Models
Jones & Kaul (1996) investigated the short-term response of the stock markets to the oil price shocks by using quarterly data. Using a multivariate VAR model, their results showed that oil prices play an important role in shaping the stock market returns in the United States and Canada. For the other two countries (the UK and Japan), the impact of oil was lower.
Sadorksy (1999) showed that oil prices and their volatility play a more important role than the interest rate in explaining the USA stock market index. He found an asymmetrical relationship between the evolution of oil price and the S& P 500 index. Similarly, the impulse response functions of the VAR model confirm this result.
Park & Ratti (2008) analyzed the impact of oil prices and their volatility on the stock market returns in the United States and in 13 European industrialized countries. Using the same methodology as Sadorksy, they showed that oil price shocks have a statistically significant effect on the stock market returns. In addition, the observed effects vary across countries. For most EU countries, increasing volatility reduces asset returns in a contemporary way or with a one month lag.
Using co-integration techniques, Miller & Ratti (2009) showed the existence of different regimes in the long-term relationship between oil and the stock market in the OECD countries over the 1971-2008 periods.
For instance, the economic situation in Nigeria is more affected by a series of instabilities due to a significant change of the international crude oil price and to the economy's over reliance on the oil sector. Akomolafe & Jonathan (2014) investigate the relationship between the industrial stock returns and fluctuation of oil price by using Cointegration and Vector Error Correction. The variables are composed of stock market returns for the selected industries (construction, industries, oil, gas, and banking), world oil price and Nigerian stock market all-share index. The result of VECM model indicated that the banking sector responds to change of oil price.
Oil Price and Stock Market Index by Using GARCH Method
In this subsection, we present a literature review that has analyzed volatility transmission between oil prices and stock markets by using the GARCH model.
These recent studies are distributed on three empirical categories. Some found a unidirectional transmission, other found a bidirectional transmission, and the remaining get dealt with transmission volatility between the two markets, which was found to be absent.
Among the results found about unidirectional volatility transmission, there is the one by Aloui et al. (2008), which considered the relationship between oil price and six major financial markets of the world. Such as, France, USA, Germany, Japan, Canada and UK). These authors used two indicators for the oil price (Brent and WTI). Their results showed a positive transmission of the volatility of the stock market index to the WTI, while in the USA the direction is in the reverse sense.
In the same way, Malik & Ewing (2009) analyzed the volatility transmission between oil prices and stock market indices from 1992 to 2008. They considered five different sector indices of one country (United States) such as consumer, industrial, financial, technology and health sectors. Their results found a transmission of volatility from industrial, consumer and financial sectors to the oil price. The direction of transmission is in reverse for volatilities of technology and healthcare sectors. Shaharudin et al. (2009) also focused on the relation between oil price and the stock price of oil and gas companies in India, UK, and the USA from 2003 to 2008 by using a GJR- GARCH model. Their findings showed a volatility transmission in these three countries, going from oil price to the stock price.
Some other researchers, for example, Arouri et al. (2011) and Chaibi & Gomes (2013) found unidirectional and bidirectional transmissions. Arouri et al. (2011) examined the relationship between oil price and seven European and American stock market sector indices from 1998 to 2009 using VAR-GARCH model. They found a unidirectional volatility transmission; going from oil price to industrial sector indicators in Europe, while in the USA, the transmission is bidirectional. In addition, the sense of direction of this transmission varies according to sectors due to the factors specific to each sector.
In the same way, Chaibi & Gomes (2013) examined the relationship between oil price and the national index of 21 emerging countries from 2008 to 2013. They found a significant transmission of volatility between oil price and financial markets. As for the direction, it is more often from the oil price to financial markets than the reverse. A bidirectional transmission was detected in some emerging countries, such as Oman, Jordan, Kazakhstan, United Arab Emirates and Kuwait.
To the best of our knowledge, the only empirical study that dealt with bidirectional transmission findings is the one conducted by Awartani & Maghyereh (2013) who examined the dynamic volatility spillover between oil and equities in the GCC countries from 2004 to 2012. Their results indicated that there is a bidirectional and asymmetric transmission.
Regarding the absence of volatility transmission between oil prices and stock market returns. Oskooe (2011) found that there is no transmission between these two variables in Iran. On the basis of this result, non-transmission implies a sustainable long-term performance of the Iranian market and also a vulnerability to external shocks, such as the oil shocks.
Nevertheless, most of the studies mentioned above focused mainly on the developed economies and GCC countries. However, little attention has been paid to the emerging countries. It is in this sense that the issue of the transmission of volatility between the oil market and the stock market of emerging and developed countries is important to foreign investors and international portfolio managers.
The main hypothesis that will be empirically tested in this paper is the following:
The volatility of oil prices has a significant transmission on the volatility of the stock markets of the developed countries (USA, Germany, France, Italy and Japan) where oil prices have been relatively more volatile than they are in the stock returns of the emerging countries (Argentina, Brazil and Thailand) where oil prices are stable.
Methodology
First, we present the data that we consider in the analysis. Next, we examine the VARBEKK- GARCH.
Data and Reprocessing
The data used in this paper are monthly from 1998 M1 to 2015M12 in the United States, Germany, France, Brazil and Argentina, from 2001 M1 to 2015M12 for Japan and from 2003 M1 to 2015M12 for Italy and Thailand. The variables included in the model are, the real price of oil (WTI) and the stock indices, namely, the CAC 40 (France), the S & P 500 ((United States ), Nikkei 225 (Japan), DAX 30 (Germany), FTSE MIB (Italy), Merval (Argentina), Bovespa (Brazil) and FTSE SET All-Share index ((Thailand). All data were collected from Datastream.
The series stock index returns in each country are calculated from the series of the close of each price index, according to the following formula:
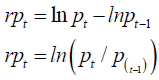
Where:
rpt: : The stock return, at time t,
pt: : The closing price of the stock market index, at time t,
pt-1: The closing price of the stock market index, at time t-1.
When the stock market returns are calculated, we have divided by inflation (calculated as the log difference in the consumer price index in each country).
An important issue was raised in the existing empirical literature, namely, the difficulty of measuring the oil price variable. However, the policies that can influence the evolution of oil prices are changes of exchange rates, the taxation of energy prices, price control and fluctuations in the price index of each country. For this reason, some economists used the nominal world crude oil price (Hamilton 1996; Gisser & Goodwin 1986). Others used the global real price expressed in the US dollar (Hooker 1999; Burbidge & Harrison 1984), and finally some others used the real price of crude oil expressed in the US dollar and local currency of each country (Cunado & Gracia; 2005 & Rodriguez; Sanchez 2005).
Therefore, to take into account different policies that influence the price of oil, we will measure the oil price variable in national currency. The price of crude oil used in our paper is the WTI price. To obtain and exchange the world oil price into national currency, we multiplied it by the exchange rate of each country against the US dollar. Consequently, we deflated the values obtained by the consumer price index of each country. Finally, we apply the log difference for each series to get real returns of WTI, according to the following formula:
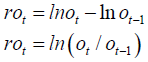
Where:
rot: The return of oil prices, at time t
ot: The closing price of WTI index, at time t
ot-1: The closing price of WTI index, at time t-1
Model Expressions (Baba Engel Kroner Kraft (BEKK) Model
The GARCH received particular interest in almost all previous studies that address the volatility modeling and forecasting commodity prices. When the goal is to study the interdependence and volatility transmission mechanisms between different time series, the parameters on several variables such as CCC-MGARCH model (Bollerslev 1990), BEKKGARCH (Baba et al. 1990) and model DCC- MGARCH (Engle 2002) are more relevant than the plain variety of models. Empirical results of Hassan & Malik (2007) confirm the superiority of these models.
In our paper, we apply the VAR-GARCH -BEKK (1,1) model. In its general specification, choosing a BEKK representation can be explained by the fact that this representation reduces the number of parameters to be estimated. Also, this model guarantees by construction that the variance covariance matrices Ht in the system are positive definite. In addition, the application of Baba Engle Kroner Kraft (BEKK) model introduced by (Baba et al.) allows us to answer the following questions. The volatility of a oil market leading the volatility of a stock market, and vice versa? Does a shock on a oil market increase the volatility of stock market, and vice versa? Is the impact the same for negative and positive shocks of the same amplitude?
The reliability of the system is defined as follows:
Where:
The general form of Ht according to the representation of the GARCH-BEKK is given by:
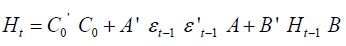
Where:
Co, A and B are (N*N) matrices but Co is a lower triangular matrix.
To have a clear and accurate picture of the conditional variance-covariance matrix equation, we develop the following basic equation. In addition, the general BEKK model in the case of N=2, is defined as follows:
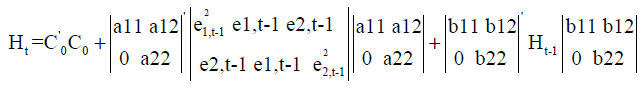
More precisely:
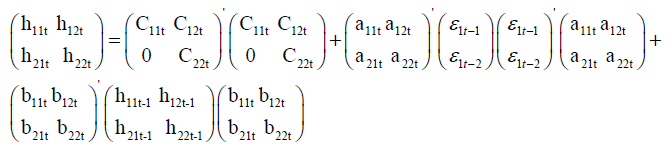
We focus on the h11t and h22t equations, which describe respectively the conditional variance of the oil prices and the stock market index. The h11t and h22t equations show how the shocks and volatility have transmitted over time. Indeed, the equations of the variance and the covariance of the system are the following.
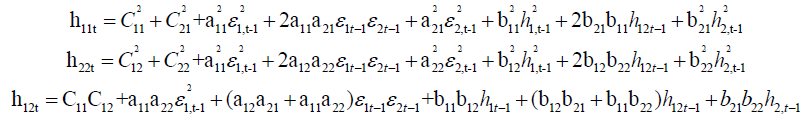
Where:
ε1t-1 and ε2t-1 in each equation represents the effect of the unexpected changes or the shocks from the oil prices and the stock market index in period t-1.
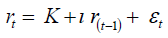
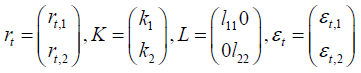
The equations of the mean of the system as follows:
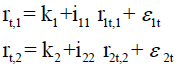
Empirical Results
We estimated the volatility transmission between crude oil price and the stock market in the emerging and developed countries. These estimation results are presented step by step as follows (Table 1).
| Table 1 The Number of the Parameters Estimated in the BEKK Model | |
| Parameters | Interpretation |
 |
coefficients measure the interaction between the past and the current returns of the WTI index and the stock market index. |
 |
Impact the oil price shock on the oil price volatility. |
 |
Impact of the stock market index shock on the oil price volatility. |
 |
Impact the oil price shock on the stock market index volatility. |
 |
Impact the stock market index shock on the stock market index volatility. |
 |
Volatility persistence of the oil price over time. |
 |
Volatility transmission from the stock market index to the oil price. |
 |
Volatility transmission from the oil price to the stock market index. |
 |
Volatility persistence of the stock market index over time. |
• If, l11 is significant, means that the past returns of WTI index affect the current yields.
• If, l22 is significant, means that the past returns in the stock market affect the current yields.
• If, α12 is significant, means that the conditional variance of the market 2 is affected by past shocks from the market 1.
• If, α21 is significant, means that the conditional variance of the market 1 is affected by past shocks from the market 2.
The unit root tests are used to detect the presence of unit roots in a series. Three-unit root tests are used, namely the augmented Dickey-Fuller (ADF), Phillips-Perron (PP) and the KPSS.
In our study, we used the augmented Dickey-Fuller test (ADF) because it is easy to implement on the RATS statistical software that we used. It consists in checking the null hypothesis
H0 (non-stationarity) against the alternative hypothesis
H1 (stationarity). The decision is made by comparing the absolute value of the t-statistic to the critical value:
• If, critical value<t-statistic, then we accept the null hypothesis of non-stationarity of the variables considered.
• If, t-statistic <critical value, the null hypothesis of non-stationarity is rejected.
From Table 2, the ADF test shows that all the variables are stationary with the absolute value of the t-statistic exceed the critical value, which means that the series of the stock index and the WTI oil prices in each country are stationary. Consequently, the null hypothesis of no unit root is not accepted and therefore all the series of returns are stationary.
| Table 2 Unit Root Test of Monthly Stock Market Index and Spot West Texas Intermediate | ||
| Indices | Stationarity of the return series | Critical value |
| WTI | -8.2772 | -3.4100 |
| Developed countries | ||
| S&P 500 | -10.6102** | -3.4100 |
| Nikkei 225 | -9.5672** | -3.4100 |
| CAC 40 | -10.104** | -3.4100 |
| DAX | -10.1421** | -3.4100 |
| FTSE MIB | -11.4025** | -3.4100 |
| Emerging countries | ||
| Bovespa | -10.2166** | -3.4100 |
| Merval | -10.9912** | -3.4100 |
| FTSE SET All-Share | -9.6803** | -3.4100 |
For the developed countries, Germany and France have the highest return at 0.0024 and 0.0024 respectively. Italy has the lowest monthly returns of -0.0042. Regarding volatility, which is measured by the standard deviation, the highest standard deviation (volatility in the stock returns) is found in Italy and Germany at 0.0096 and 0.0095, respectively. These values indicate the large fluctuations in stock market return in both countries during the period of our study (Table 3).
| Table 3 Descriptive Statistics of Monthly Stock Market Index | |||||||
| Indices | Mean | Std-Dev | Skew | Kurt | JB | ARCH(2) | ARCH(1) |
| Developed countries | |||||||
| S&P 500 | 0.0015 | 0.0074 | -0.7477 | 1.2759 | 34.783 | 10.366 (0.052)* |
11.96 (0.06)* |
| Nikkei 225 | -0.0038 | 0.0092 | -0.8481 | 2.5482 | 84.339 | 10.258 (0.054 )* |
12.66 (0.04)** |
| CAC 40 | 0.0024 | 0.0094 | -0.6843 | 1.4392 | 35.501 | 14.385 (0.054)* |
15.44 (0.05)** |
| DAX | 0.0024 | 0.0095 | -0.6747 | 1.4309 | 34.818 | 13.025 (0.03) ** |
11.25 (0.05) ** |
| FTSE MIB | -0.0042 | 0.0096 | -0.7661 | 1.5880 | 43.828 | 11.254 (0.06)* |
12. 35 (0.06)* |
| Emerging countries | |||||||
| Bovespa | 0.0038 | 0.0105 | 0.6714 | 6.6163 | 410.213 | 11.365 (0.074)* |
14.26 (0.06)* |
| Merval | 0.0134 | 0.0112 | 0.9391 | 7.5995 | 551.529 | 11,369 (0.05 )* |
15.36 (0.03)** |
| FTSE SET All-Share | 0.0001 | 0.0077 | -0.7274 | 1.1727 | 31.427 | 14.358 (0.056)* |
12.47 (0.05) ** |
For the emerging markets, the lowest return is attributed to the Stock Market of Thailand with a value of 0.0001, while the highest is recorded in Argentina with a value of 0.0134. In terms of standard deviation, the stock market of Thailand has the lowest risk with a value of 0.0077, while the highest is observed in the stock market in Argentina with a value of 0.0112.
The skewness coefficients are negative in almost all the countries except Brazil. This indicates that the distributions are skewed to the left. The kurtosis coefficient is Greater than 3 only in two countries (Brazil and Argentina). The excess kurtosis indicates that all the performance series are leptokurtic. The Jarque-Bera normality test strongly rejects the null hypothesis of normality for all the series considered without exception.
The last two columns of Table 4 show the presence of an ARCH effect for all the considered series. In other words, the hypothesis of no ARCH effects is rejected for all the series. Hence arises, the importance of employing a GARCH modeling approach to examine volatility transmission between oil and stock markets in developed and emerging countries.
| Table 4 Correlation Between the Series Returns | |||||||||
| WTI | Bovespa | Merval | FTSE SET | S&P 500 | CAC 40 | DAX | FTSE MIB | Nikkei 225 | |
| WTI | 1.000 | ||||||||
| Bovespa | 0.284*** | 1.000 | |||||||
| Merval | 0.287*** | 0.472*** | 1.000 | ||||||
| FTSE SET | 0.357*** | 0.514** | 0.417*** | 1.0000 | |||||
| S&P 500 | 0.361*** | 0.650*** | 0.402*** | 0.522*** | 1.000 | ||||
| CAC 40 | 0.456 *** | 0.597*** | 0.263 *** | 0.363*** | 0.806*** | 1.000 | |||
| DAX | 0.412*** | 0.586*** | 0.323*** | 0.397*** | 0.796*** | 0.915*** | 1.000 | ||
| FTSE MIB | 0.351 *** | 0.441*** | 0.285*** | 0.379*** | 0.476*** | 0.596*** | 0.492*** | 1.000 | |
| Nikkei 225 | 0.314*** | 0.479*** | 0.392*** | 0.479*** | 0.646*** | 0.632*** | 0.604*** | 0.457*** | 1.000 |
The results of the correlation matrix show that the stocks return in the developed countries are positively correlated with the oil prices returns. This means that the stock returns in these countries and the oil price returns are moving in the same direction at the same rate and interpret new information in the same way. In addition, France showed the highest correlation of 0, 4758 with changes in oil prices. This indicated that France is one of the world’s biggest oil consumers. According to the statistics of the U.S., Energy Information Administration, the oil consumption in France rose sharply at 1,792,000 (bbi/day) on 2011.
For more emerging markets, the correlation coefficients between stock returns and oil price variations are lower than in the developed markets. This means that, despite economic growth in the emerging countries, developed countries such as (Germany, Italy, France, Japan and USA) are still the greater oil consumers, more than (Brazil, Argentina, and Thailand) in 2010.
Moreover, according to the results presented in Table 5, we note that the Brazilian and the Argentina markets have a lower correlation with changes in oil prices.
| Table 5 Correlation Between the Squared Monthly Returns | |||||||||
| WTI | Bovespa | Merval | FTSE SET | S&P 500 | CAC 40 | DAX | FTSE MIB | Nikkei 225 | |
| WTI | 1.000 | ||||||||
| Bovespa | 0.261*** | 1.000 | |||||||
| Merval | 0.287 *** | 0.646*** | 1.000 | ||||||
| FTSE SET | 0.341 *** | 0.364*** | 0.352 | 1.000 | |||||
| S&P 500 | 0.327 *** | 0.612*** | 0.426*** | 0.466*** | 1.000 | ||||
| CAC 40 | 0.475*** | 0.415 | 0.335 | 0.327 | 0.69*** | 1.000 | |||
| DAX | 0.371*** | 0.426*** | 0.229*** | 0.239*** | 0.593*** | 0.860*** | 1.0000 | ||
| FTSE MIB | 0.362 *** | 0.124 | 0.003 | 0.089 | 0.022 | 0.038 | 0.021 | 1.000 | |
| Nikkei 225 | 0.384*** | 0.653*** | 0.533*** | 0.782*** | 0.719*** | 0.424*** | 0.260*** | 0.080 | 1.000 |
The cross correlation, ρ (rt,o, rt-k,sm) measure the dependence between the current oil market returns and the past stock market returns (t-k). To measure the dependence between the past oil market returns and the current of stock market returns, the equation of the cross correlation becomes, ρ (rt-,k,o, rt,sm) (Table 6).
| Table 6 Cross-Correlations Between Crude Oil and Stock Markets With Q Varying From -6 to 6 | ||||||||
| Developed countries | Emerging countries | |||||||
 |
S&P500 | Nikkei 225 | CAC 40 | DAX | FTSE MIB | Bovespa | Merval | FTSE SET All-Share |
| -6 | 0.4251 (0.000)*** |
0.3496 (0.0002)* |
0.2011 (0.0369)** |
0.2074 (0.0313)** |
0.2185 (0.0231)** |
0.0915 -0.3463 |
0.7101 (0.000)*** |
0.1604 (0.0973)* |
| -5 | 0.2751 (0.003 )*** |
0.6321 (0.0030)* |
0.3011 (0.0015)** |
0.1534 -0.1129 |
0.2244 (0.0195)* |
0.0506 -0.6027 |
0.0763 -0.4327 |
0.2071 (0.0315)** |
| -4 | 0.2217 (0.0123 )** |
0.4712 (0.042)** |
0.3347 -0.23 |
0.7658 (0.000)*** |
0.2099 (0.0292)** |
0.2612 (0.0063)*** |
-0.0085 -0.9302 |
0.6192 (0.0000)** |
| -3 | 0.4021 (0.0023)*** |
0.5412 -0.1425 |
0.3647 (0.002)** |
0.4715 -0.4123 |
0.1843 (0.0562)* |
0.5119 (0.0000)*** |
0.0886 -0.3618 |
0.4225 (0.000 )** |
| -2 | 0.6354 (0.0311)** |
0.4128 (0.0521)* |
0.5418 (0.0002)** |
0.2514 (0.0054)** |
0.1425 (0.0045)** |
0.0012 -0.9903 |
0.2313 (0.0160)** |
0.0507 -0.6024 |
| -1 | 0.2517 -0.147 |
0.3251 (0.0214)* |
0.3517 (0.0154)** |
0.5147 (0.0033)** |
0.3714 -0.1402 |
0.3514 -0.1234 |
0.0614 0.5281) |
0.1087 -0.2626 |
| 0 | 0.3517 -0.1472 |
0.3628 -0.1245 |
0.2517 (0.002)*** |
0.4172 -0.1425 |
0.3624 (0.0023)* |
0.3514 -0.5214 |
0.3521 -0.1247 |
0.1351 -0.1633 |
| 1 | 0.6781 (0.002)*** |
0.5264 (0.0237 )* |
0.6282 (0.0432)** |
0.5783 (0.032)** |
0.6232 (0.0314)* |
0.4261 (0.0351)** |
0.3785 (0.0471)** |
0.3592 (0.0521)** |
| 2 | 0.1725 (0.001)*** |
0.3241 (0.0214 )* |
0.4172 (0.001)** |
0.3471 (0.0214)** |
0.1507 -0.1247 |
0.3217 -0.2215 |
0.3514 (0.0012)** |
0.5214 -0.1547 |
| 3 | 0.1472 (0.0152)** |
0.2517 (0.0142 )* |
0.2347 (0.0036)* |
0.5416 (0.0005)* |
0.4185 (0.001)** |
0.3347 -0.1325 |
0.281 -0.1185 |
0.6547 (0.0018)** |
| 4 | 0.3215 (0.0311 )** |
0.4712 (0.0214 )** |
0.2347 -0.1247 |
0.2641 -0.1245 |
0.5627 (0.001)*** |
0.3625 -0.3314 |
0.2315 (0.0010)*** |
0.2851 -0.3214 |
| 5 | 0.1725 -0.3514 |
0.2351 (0.0023 )*** |
0.5326 (0.005 )*** |
0.1247 -0.1472 |
0.3324 -0.3625 |
0.2354 -0.4752 |
0.2314 -0.3015 |
0.1472 (0.00 )*** |
| 6 | 0.5214 (0.001 )*** |
0.3251 (0.0154)** |
0.4521 (0.005 )*** |
0.4478 (0.2314 |
0.3265 0.4102 ) |
0.4712 (0.001 )*** | 0.3245 (0.0141)** | 0.1452 (0.0154 )** |
In Table 7, we studied the cross-correlations between WTI crude oil and the stock market of five developed countries and three emerging countries. Our empirical results showed a significant cross-correlation with different degrees in most countries. This result reflects an important link between energy and financial markets. Moreover, we note that the correlations are more significant for k=6 than k=1. This suggests that the two correlated series are persistent or long-range dependence.
| Table 7 Estimates of Bivariate VAR (1)-Garch-Bekk (1.1) Model for Oil and Stock Market in the Emerging Countries | |||
| Variables | Bovespa | Merval | FTSE SET All-Share index |
| Conditional Mean Equation | |||
| l11 | 0.0125 (0.064)* |
0.018 (0.003)*** |
0.0032 (0.5699) |
| l22 | 0.0104 (0.041)** |
0.0250 (0.000)*** |
0.0122 (0.0094)*** |
| Conditional Variance Equation | |||
| α11 | 0.5488 (0.000)*** |
0.2232 (0.054) * |
0.3208 (0.000)*** |
| α21 | 0.5762 (0.000)*** |
0.1896 (0.008)*** |
0.3381 (0.001)*** |
| α12 | 0.0664 (0.439) |
0.348 (0.004)*** |
0.1865 (0.048)** |
| α22 | 0.2928 (0.001)*** |
0.7157 (0.000)*** |
0.4134 (0.000)*** |
| b11 | 0.1480 (0.489) |
0.5635 (0.000)*** |
0.6087 (0.000)*** |
| b21 | -0.397 (0.003) *** |
0.3778 (0.012)** |
-0.4245 (0.000)*** |
| b12 | -0.1387 (0.327) |
-0.1089 (0.731) |
0.39003 (0.000)*** |
| b22 | 0.9063 (0.000) *** |
0.0833 (0.706) |
0.7360 (0.000)*** |
| Q1(12) | 24.325 (0.025)** |
23.547 (0.047)** |
26.574 (0.054)* |
| Q2(12) | 29.874 (0.025)** |
31.254 (0.041)** |
25.364 (0.054)* |
 |
26.375 (0.042)** |
24.385 (0.042)** |
25.674 (0.048)** |
 |
24.675 (0.056)** |
25.341 (0.042)** |
27.369 (0.036)** |
and are Ljung-Box tests for autocorrelations of order 12 applied to squared standardized residuals.With regard to the sign, the correlation is positive for all the considered countries without distinction and for all the delayed periods. This result is consistent with the findings of Yang et al. (2016) who found positive cross correlations between crude oil market and Chinese ten sector stock markets by applying the (MF-DCCA) model.
Concerning the question of the cross-correlation between oil prices and the stock markets of the developed countries, the United States recorded a strong correlation followed by Japan and France for an order k between -6 and 6. This indicates that the past returns in a market are important in explaining and determining the currents returns of another market. Indeed, each market is easily affected by large and small fluctuations in other markets.
Concerning the question of the cross-correlation between oil prices and the emerging stock markets, the results indicate a strong cross- correlation in Thailand. The significant coefficients are on the order k<0. For example.0, 6192% of the current stock market returns can be determined by the returns of the oil market of month t-4. The low correlation coefficients were obtained for Argentina and Brazil. This means that the past returns in a market are not important in explaining and determining the current returns of other markets.
According to the Ljung-Box test, the null hypothesis of no autocorrelation in the series of emerging market returns is rejected. More particularly, the autocorrelation coefficients, of order twelve, applied to raw return series,  are significant in most cases at the 5% level. Indeed, this statistical significance of the coefficients of autocorrelations showed the existence of a linear and nonlinear dependence for oil and stock returns of all the considered emerging countries, which thus supports our decision to use GARCH models to examine the volatility transmission between oil and stock markets.
In the results from the conditional mean equation, we note that the stock market returns at time t are significantly affected by the past returns of the stock market at time t-1 in two countries (Brazil and Argentina), as indicated by the significant coefficients l11. As expected, the highest elasticity of the current changes (shock and volatility) of the stock market by the past changes (shock and volatility) of the stock market is obtained in Argentina with a coefficient of 0.2. Conversely, the current change in the oil markets is not significantly associated with the lagged returns, except in two countries (Brazil and Argentina) where we see a positive effect.
Concerning the transmission of shocks, we note that the coefficients (α12) are statistically significant in two countries (Thailand and Brazil), indicating that the past shocks in the oil market can influence the stock market volatility. On the other hand, the past shocks in the stock market can influence the oil market volatility in most of the considered countries without distinction, as indicated by the significant coefficients (α21).
The (b11 and b22 ) coefficients showed the existence of a significant volatility persistence of the oil and stock market index over time. For both variables, the persistence is positive.
Subsequently, we consider the effect of volatility transmission between oil markets and stock markets of the considered emerging countries. On the one hand, the b22 coefficients are significant at different levels. This means that the volatility of past stock returns significantly affects the current volatility of the oil market in the three emerging countries. On the other hand, b12 coefficients indicate that the volatility of past oil price has a significant impact on the stock volatility in Thailand. The transmission of volatility in this country is positive from the oil prices to the stock market and negative in the opposite direction. In Thailand, we see that an increase of 1% in the volatility of the oil prices leads to a significant increase of the stock market index for 0, 39%. We also remark that an increase of 1% in the volatility index leads to a significant reduction of the oil price volatility to 0. 42%. A possible reason for this result is that Thailand is the second largest net oil importer in Southeast Asia behind Singapore. This can be due to the volatility of oil prices. The bidirectional transmission of volatility between oil price and the stock market index in Thailand is consistent with the study of Awartani & Maghyereh (2013) who studied the volatility spillover between oil prices and stock markets in the Gulf Cooperation Council (GCC) during the 2004-2012 periods.
We also note that there is no direct transmission from the volatility of oil price to a stock market index in two countries; Argentina and Brazil. The lack of volatility transmission for these two countries can be explained by the absence of oil companies. Indeed, these markets are largely dominated by the banking and service industries. This unidirectional transmission is consistent with the results of Aloui et al. (2008) (for Canada). The results above are absolutely in line with Figure 1, which indicates the direction and the sign of impact.

Figure 1 Types of Transmissions of the Volatility in Emerging Countries
As in the case of the emerging countries, the coefficients of the Ljung-Box test statistics for autocorrelations of order 12 ( ) are significant in most returns. These coefficients made us to reject the null hypothesis of no autocorrelations. This shows the existence of a linear and nonlinear dependence for oil and stock returns of all the considered developed countries.
Regarding the estimation of the conditional mean equation, the coefficients (l22) suggest that the past stock market returns may be used to predict the current stock market returns in two countries (USA and Germany). Conversely, the coefficients (l11) are significant only in the United States, indicating that the conditional variance of the oil markets is found to be less affected by oil price shocks.
The coefficients (α12 ) measure the impact of the past shocks from the oil market on the volatility of the stock market. These coefficients are statistically significant for all the considered developed countries, except Germany, indicating that the past shocks of the oil market may influence the volatility of the stock markets in those countries. This result highlights the possibility of the short-term of oil price fluctuations. Therefore, the coefficients (α21) are significant and indicate that the conditional variance of the oil markets is affected by past shocks from the oil market in France, Germany and the United States.
From these results, we can conclude that the shock to oil market has a significant effect on the volatility of the stock markets of all the countries considered. However, a shock in the stock market has no effect on the volatility of the oil market with the exception of France, Germany and United States.
Subsequently, we consider the effect of the volatility transmission between the oil markets and the stock markets of the developed countries considered.
Regarding the volatility spillover, the coefficients (b12) are not significant in all the studied countries (France, USA, Japan and Italy). This indicates that the strong (weak) changes in the oil prices are not followed by other strong (weak) variations of the stock market returns. On the other hand, the coefficients (b21) are significant in three countries (Germany, Japan and France) with a negative effect on Germany and positive effect on Japan and the France. This implies the existence of a significant unidirectional transmission from the oil market to the stock market index only in three countries (Germany, Japan and Italy). These results indicate the evidence of the short- term forecast of the evolution of oil prices over time and confirm the conclusion of some recent studies showing that the hypothesis of the informational efficiency of the weak form of the international oil markets cannot be accepted (Elder & Serletis, 2008; Arouri et al., 2010). However, the absence of volatility transmission in the United States and Italy can be explained by the presence of effective hedging strategies against the influence of oil price fluctuations (see Malik & Ewing, 2009).
Given the above, the results of Table 8 have been confirmed by Figure 2, which indicates the direction and the sign of impact between the two variables (the oil markets and the stock markets of the developed countries considered).
| Table 8 Estimates of Bivariate VAR (1)-Garch-Bekk (1.1) Model for Oil and Stock Market in Developed Countries | |||||
| Variables | S&P 500 | Nikkei 225 | CAC 40 | DAX | FTSE MIB |
| Conditional mean equation | |||||
| l11 | 0.0116 (0.0377) |
0.0047 (0.3885) |
0.00715 (0.2690) |
0.007 (0.27010) |
0.0022 (0.7292) |
| l22 | 0.00725 (0.007)*** |
0.00284 (0.451)) |
0.0043 (0.21465) |
0.0110 (0.0051*** |
0.0036 (0.2691) |
| Conditional variance equation | |||||
| α11 | 0.4659 (0.000)*** |
0.5323 (0.000)*** |
0.443 (0.000)*** |
0.4853 (0.000)*** |
0.311 (0.000)*** |
| α21 | 0.4658 (0.007)*** |
-0.457 (0.000)*** |
0.4399 (0.002)*** |
0.1988 (0.224) |
0.2706 (0.129) |
| α12 | 0.0644 (0.057)* |
-0.0845 (0.062)* |
0.0965 (0.019)** |
-0.0210 (0.699) |
-0.319 (0.00)*** |
| α22 | 0.3980 (0.000)*** |
-0.0570 (0.716) |
-0.307 (0.000)*** |
0.4225 (0.000)*** |
1.259 (0.000)*** |
| b11 | -0.1547 (0.543) |
0.7641 (0.000)*** |
0.5417 (0.000)*** |
0.4421 (0.0411)** |
-0.845 (0.00)*** |
| b21 | -0.103 (0.710) |
0.1209 (0.454) |
-0.1845 (0.382) |
-0.2459 (0.100) |
0.157 (0.128) |
| b12 | -0.1179 (0.162) |
0.1903 (0.003)*** |
0.0982 (0.035)** |
-0.2445 (0.000)*** |
-0.2027 (0.240) |
| b22 | 0.9057 (0.000)*** |
0.7144 (0.000)*** |
0.9104 (0.000)*** |
0.7698 (0.000)*** |
-0.2542 (0.062)* |
| Q1(12) | 26.145 (0.052)* |
26.547 (0.071)* |
27.365 (0.052)* |
25.364 (0.047)** |
26.374 (0.062)* |
| Q2(12) | 22.674 (0.061)* |
25.674 (0.048)** |
26.541 (0.052)* |
23.175 (0.071)* |
24.388 (0.062)* |
|
25.168 (0.056)* |
23.478 (23.47 ) |
26.108 (0.053)* |
24.365 (0.042)** |
25.347 (0.042)** |
|
24.358 (0.041)** |
24.365 (0.054)* |
27.485 (0.045)** |
26.541 (0.041)** |
24.58 (0.041)** |
and are Ljung-Box tests for autocorrelations of order 12 applied to squared standardized residuals. S&P 500, Nikkei 225, CAC 40, DAX and FTSE MIB indicate the stock market index of USA, Japan, France, Germany and Italy respectively.
Figure 2 Types of Transmissions of the Volatility in Emerging Countries
Conclusion and Policy Implications
In this paper, we investigated the transmission of volatility and shocks between oil price and the stock market index in three emerging countries (Argentina, Thailand and Brazil) and five developed countries (the USA, Germany, France, Italy and Japan). The data used in this paper are monthly time series data from M1 1998 to M12 2015. To meet this ambitious objective, we used a BEKK representation of a bivariate GARCH model that significantly reduces the number of variables to estimate and guarantee the positive definiteness of the covariance matrix under very weak conditions.
The results of the estimation of MGARCH (BEKK) model for the emerging countries showed a positive and unidirectional transmission of the stock market index to oil prices, with the exception of Thailand. The absence of bidirectional transmission of volatility during the period for two emerging countries (Argentina and Brazil) can be explained by the absence of oil companies. Indeed, these markets are largely dominated by the banking, industries and service sectors. On the other hand, the bidirectional transmission in Thailand is consistent with the studies in the literature review, for example, Liu et al. (2013), Aloui et al. (2008) for Canada and Malik and Ewing (2009) for the financial sector, the consumer sector, and the industrial sector.
Regarding the question of the transmission of the volatility between oil prices and stock markets of the developed countries, two main conclusions can be drawn.
First, a unidirectional and positive transmission of volatility from oil price to the stock market index in Germany and Japan and a negative transmission in France. Indeed, these results are consistent with the study concluded by Shaharudin et al. (2009) on stock prices of oil and gas companies in the United States, India, and the UK. However, this result is incompatible with those of many researchers, such as Chkili et al. (2012) and Caporale et al. (2013) who showed a two-way bidirectional transmission.
Second, the results of the estimation of GARCH-BEKK model (1.1) showed no significant sensitivity of the stock market in the USA and Italy to the volatility of oil prices. This suggests that other hidden variables drive the stock market volatility across industries as indicated by Kilian (2010). This writer attempted to identify the causes of equity volatility by observable factors, such as oil supply and demand and unobservable factors that are not captured by the published statistics, such as, the speculative demand shocks. The absence of the transmission in the US and Italy is in agreement with the findings of Oskooe (2011) who showed that the variance of oil price fluctuations is caused by the variance of Iran stock market returns.
At the end of this empirical analysis, I think we can say that the transmission of volatility between oil prices and financial markets are more important for the developed countries than for the emerging ones. This result is due to the lack of similarities between the emerging and developed countries in terms of oil imports and macroeconomic conditions. These results confirm the starting assumption that the volatility of oil prices exerts a significant transmission on the volatility of the stock markets of the developed countries more than in the emerging countries.
The findings in this study have three limitations related mainly to the used data and the estimated model.
First, the lack of the availability of data over a quite long period makes modeling difficult. Moreover, the use of monthly instead of weekly data represents a limitation in our study. In most studies, weekly data represent the dynamics of the stock and oil markets, which is not the case for the monthly data. According to the study of Arouri & Rault (2012), weekly data may adequately capture the interaction between oil and stock prices in the region.
Second, it is important to note that all the data analyzed in this study relate to a period of the turbulence in the financial markets under the effects of the subprime financial crisis in 2008, the economic uncertainty and the drop in oil prices at the beginning of 2014. It would therefore be valuable that these systematic factors have significantly biased the results.
Thirdly, the transmission of oil price volatility and stock returns in the emerging and developed countries may be varied in differing time horizons, given that investors in the stock market and the oil market must be conscious that the relationship between oil and stock market may vary at different time scales and in different market circumstances. In this sense, and according to the study of Rania & Reboredo (2016), the dependency structure between oil and stock returns for different time scales is realized by “Wavelet Estimation of Copulas for Time Series". This version will be a possible line of research in the future.
Thereafter, since there are many transmission relationships for two categories of countries, it seems appropriate to analyze, in the future research, the impact of the underlying causes the real changes in oil prices and their mechanism transmission on the stock markets of the emerging and developed countries.
References
- Akomolafe, K.J., & Jonathan, D.D. (2014). Oil price dynamics and the Nigerian stock market: An industry level analysis. International Journal, 3(6).
- Aloui, C., Jammazy, R., & Dhakhlaoui, I. (2008). Crude oil volatility shocks and stock market returns. The Journal of Energy Markets, 1(3), 69-97.
- Arouri, M.E.H., & Nguyen, D.K. (2010). Oil prices, stock markets and portfolio investment: Evidence from sector analysis in Europe over the last decade. Energy Policy, 38(8), 4528-4539.
- Arouri, M.E.H., Jouini, J., & Nguyen, D.K. (2011). Volatility spillovers between oil prices and stock sector returns: Implications for portfolio management. Journal of International Money and Finance, 30(7), 1387-1405.
- Arouri, M.E.H., Rault, C. (2012). Oil prices and stock markets in GCC countries: Empirical evidence from panel analysis. International Journal of Finance and Economics, in press.
- Asteriou, D., & Bashmakova, Y. (2013). Assessing the impact of oil returns on emerging stock markets: A panel data approach for ten Central and Eastern European Countries. Energy Economics, 38, 204-211.
- Awartani, B., & Maghyereh, A.I. (2013). Dynamic spillovers between oil and stock markets in the Gulf Cooperation Council Countries. Energy Economics, 36, 28-42.
- Baba, Y., Engle, R.F., Kraft, D., Kroner, K.F., (1990). Multivariate Simultaneous Generalized ARCH. Department of Economics, University of California, San Diego, Mimeo.
- Bollerslev, T., (1990). Modelling the coherence in short-run nominal exchange rates: a multivariate generalized ARCH approach. Rev. Econ. Stat. 72, 498-505.
- Caporale, G.M., Ciferri, D., Girardi. A., (2014). Time-varying spot and futures oil prices dynamics. Scottish Journal of Political Economy 61(1): 78-97.
- Chaibi, A., Gomes, M., (2013). Volatility spillovers between oil prices and stock returns: a focus on frontiermarkets. Working paper.
- Chkili, W., Aloui, C., Nguyen, D.K., (2012). Asymmetric effects and long memory in dynamic volatility relationships between stock returns and exchange rates. Journal of International Financial Markets, Institutions and Money, 22, 738-757.
- Conrad, C., Loch, K., Rittler, D., (2014). On the macroeconomic determinants of longterm volatilities and correlations in US stock and crude oil markets. J. Empir. Financ. 29, 26-40.
- Cunado, J., Gracia, F. P., (2005). Oil Prices, Economic Activity and Inflation: Evidence for Some Asian Countries. The Quarterly Review of Economics and Finance, 45, 65-83.
- Elder, J., Serletis, A., (2008). Long memory in energy futures prices. Rev. Financ. Econ. 17, 146-155.
- Gisser, M., Goodwin T.H., (1986). Crude Oil and the Macroeconomy: Tests of Some Popular Notions. Journal of Money Credit and Banking, vol. 18(1), 95-103.
- Hamilton, J.D., (1996). This is what happened to the oil price-macro economy relationship. Journal of Monetary Economics 38 (2), 221–222.
- Hassan, H., Malik, F., (2007). Multivariate GARCH model of sector volatility transmission. Quarterly Review of Economics and Finance, 47, 470-480.
- Jimenez-Rodriguez, R., Sanchez, M., (2005). Oil price Shocks and Real GDP Growth: Empirical Evidence for Some OECD Countries. Appl. Econ. 37, 201-228.
- Jones, C.M., Kaul, G., (1996). Oil and the stock markets. J. Financ. 51, 463-491.
- Kilian, L., Park, C., (2009). The impact of oil price shocks on the U.S. stock market. Int. Econ. Rev. 50, 1267-1287.
- Kilian, L., (2010). Oil price shocks, monetary policy and stagflation, in: Fry, R., Jones, C., and C. Kent (eds), Inflation in an Era of Relative Price Shocks, Sydney.
- Maghyereh, A.I., Awartani, B., Bouri, E., (2016). The directional volatility connectedness between crude oil and equity markets: new evidence from implied volatility indexes. Energy Econ. 57, 78-93.
- major developed countries. Research in Finance, 24, 287-299.
- Malik, F., & Ewing, B. T., (2009). Volatility transmission between oil prices and equity sector returns. International Review of Financial Analysis, 18(3), 95-100.
- Miller, J.I., Ratti, R.A., (2009). Crude oil and stock markets: stability, instability, and bubbles. Energy Econ. 31, 559–568.
- O'Neill, J.T., Penm, J., Terrell, D.R., (2008). The role of higher oil prices: a case of
- Oskooe, S.A.P. 2011. Oil Price Shock and Stock Market in An Oil-Exporting Country Evidence From Causality In Mean And Variance Test. In International Conference on Applied Economics–ICOAE.
- Park, J., Ratti, R.A., (2008). Oil Price Shocks and Stock Markets in the U.S. and 13 European Countries. Energy Economics, 30, 2587-608.
- Rania J. R., & Reboredo, J.C., (2016). Dependence and risk management in oil and stock markets. A wavelet-copula analysis. Energy 107.
- Reboredo, J.C., Rivera-Castro, M.A., (2013). A wavelet decomposition approach to crude oil price and exchange rate dependence. Economic Modelling 32, 42-57.
- Sadorsky, P., (2006). Modeling and Forecasting Petroleum Futures Volatility. Energy Economics. 28, 467-488.
- Sadorsky, P., (1999). Oil price shocks and stock market activity. Energy Economics, 2, 449-469.
- Sadorsky, P., (2001). Risk factors in stock returns of Canadian oil and gas companies. Energy Economics, 23, 17-28.
- Shaharudin, et al., (2009). Factors effecting customer satisfaction in after sales service of Malaysian electronic business market. Canadian Social Science 5(6), 10-18.
- Yang, L., Zhua, Y., Wang, Y., Wang, Y., (2016). Multifractal detrended crosscorrelations between crude oil market and Chinese ten sector stock markets. Physica A: Statistical Mechanics and Its Applications, 462, 255e265.