Research Article: 2018 Vol: 17 Issue: 5
The Nexus between Foreign Portfolio Investment and Financial Market Development: Evidence from Mauritius
Patricia Lindelwa Makoni, University of South Africa
Godfrey Marozva, University of South Africa
Abstract
We examine the relationship between Foreign Portfolio Investment (FPI) and Financial Market Development (FMD), as a macro-economic strategy by Mauritius during the period 1989 to 2016. We employed ARDL, VECM and granger causality to assess these relationships. The results show cointegrating relationships between FPI and Foreign Direct Investment (FDI), FMD and real economic growth (RGDPG). The vector error correction model further confirmed the existence of long run relationships between the variables under observation. Short run causality was found to emanate from FPI, FDI and RGDPG to FMD. Granger-causality results confirmed that FMD causes both FPI and FDI, while FPI causes FDI. Moreover, jointly FDI, FMD and GDP growth collectively cause FPI. We however find no causality running from FPI, FDI and RGDPG to FMD, implying that financial market development in Mauritius is internally catalysed. Findings are consistent with underlying economic theories and earlier empirical studies. This paper contributes to the global debate of whether foreign investments drive financial market development in a developing country; or it is financial market development that drives foreign investment. A further significant contribution of this paper is that this study applied a PCA-constructed composite index to proxy financial market development in Mauritius. The empirical findings provide useful information for strategy formulation of economic policy makers in Mauritius, and other emerging markets.
Keywords
FPI, Financial Market Development, GMM, VECM, ARDL, Granger Causality.
Introduction
Foreign Portfolio Investment (FPI) is stock (share) and/or bond purchases that do not create a lasting interest in or effective management over an enterprise (World Bank, 2014). In their study on FPI determinants in Nigeria, Ekeocha et al. (2012) defined FPI as a component of international capital flows, which involved the transfer of financial assets such as cash, stock or bonds across international boundaries in search of profit. FPI can thus be described as all inward foreign financial investment flows which are primarily targeted at financial assets available in the local financial markets, and yet do not necessarily culminate in permanent investments. FPI, although temporary in nature, is considered to assist in the availing of additional, alternative financial capital resources for the further investment in the physical, human and social capital of an economy. According to Kovalenko et al. (2017), as a result of globalisation, individual country economic efficiency and competitiveness is growingly becoming dependent on regional cluster economic development. Multi-National Corporations (MNCs) are forced to re-evaluate their international portfolios in response to host country dynamics (Hong, 2017). Mikhailovich et al., 2017 asserted that economic activity was increasing due to improvements in information and knowledge management, as well as other factors of production, including capital. Ablaev (2018) added weight to this argument by stating that economic clusters are now one of the most effective forms of financial and knowledge-based capital integration, providing necessary competitive advantages for countries in their quest to attract large inward flows on investment capital. Abdimomynova (2018) further identified several direct and indirect factors of international market regional attraction. These factors included geographical location of the country, financial market development, trade and capital openness, government investment and fiscal policies, as well as institutional quality. In summary, all the aforementioned scholars agree that global integration of countries is dependent on a range of country-specific characteristics such as economic activities, policies and financial capital market development, which are central themes to our study.
According to the African Development Bank (2016), foreign capital flows into Africa have remained relatively stable despite weak economic conditions in other parts of the world. An estimated USD 208.3 billion of external finance in the form of foreign investment, trade, aid, remittances and other sources was attracted by African countries in 2015, an amount 1.8% less than that of the previous year. It is noted that FPI and commercial bank credit flows shrunk, reflecting the tightening global liquidity and risk averse market sentiment. Despite this, African governments acknowledge the need to stabilise financial inflows in the short term and use them for sustained economic diversification for the longer term (African Development Bank, 2016). Compared with foreign direct investment inflows which grew steadily between 2007 and 2013, foreign portfolio investment flows fell from USD 23 billion in 2014 to USD 13 billion in 2015; while bond flows remained relatively stable (African Development Bank, 2016).
Using country-level data for Mauritius for the period 1989 to 2016, the main objective of this paper was to explore factors that give rise to inward FPI flows to the country, looking specifically at the role played by financial market development. The period is justified by the fact the Mauritian Stock Exchange was only established in 1989. We examined the long run relationships between FPI and financial market development using the VECM and ARDL methodologies. The results indicate that there is a cointegrating relationship between FPI and the independent variables that includes; FDI, GDP and Financial Market Development (FMD). Further, in this article we investigated the direction of causality between the variables employing the Granger causality method. Using a PCA-constructed composite index of financial market development, the outcome of this analysis shows that FMD causes FPI, FPI causes FDI. Moreover, jointly FDI, FMD and GDP growth collectively granger causes FPI, while FPI, FMD and GDP growth collectively granger causes FDI. We however find no causality running from FPI, FDI and GDP to FMD.
Literature Review
Mauritian Financial Market Development
African financial markets are growing in recognition as a result of international market integration. These emerging stock markets remained largely unscathed following the 2007/2008 global financial crisis that shook international investor confidence.
According to Makoni (2016), there are 29 national stock exchanges in Africa, including two regional bourses, one of which represents the Francophone countries. Like in other emerging market countries, African stock markets have continuously proven their ability and efficiency in savings mobilisation, resource allocation, liquidity, and risk sharing and portfolio diversification.
The economic relevance of stock markets is assessed, based on size (proxied by stock market capitalisation to GDP), efficiency (liquidity which is measured by the value of traded shares scaled by stock market capitalisation), supply of equity capital (based on number of listed counters) and infrastructural adequacy (dependent on the trading or settlement system). Table 1 below illustrates the main stock market development indicators for selected African stock exchanges, against which the performance of the Mauritius Stock Exchange is made. It can be deduced that Mauritius is a leading stock market contender, behind South Africa and Egypt, respectively.
| Table 1 Stock Market Development Indicators |
|||||||||
| Region/ Country | Stock market capitalisation % of GDP 2005 2014 |
Total value traded % of GDP 2005 2014 |
Turnover ratio 2005 2014 | Domestic listed firms 2005 2014 | Infrastructure (trading system) |
||||
| East Africa Kenya |
34.1 | 29.4 | 2.7 | 3.3 | 9.8 | 8.1 | 47 | 65 | Electronic |
| North Africa Egypt Morocco Tunisia |
88.8 45.7 8.9 |
22.1 54.9 21.1 |
28.3 7 1.4 |
8.8 2.8 1.8 |
43 15.9 16.5 |
37.8 6.2 7.1 |
744 56 50 |
246 74 77 |
Electronic Electronic Electronic |
| Southern Africa Botswana Mauritius South Africa |
24.5 41.7 228.9 |
31.6 62 160.1 |
0.5 2.4 81.2 |
0.8 3.7 70.2 |
1.8 6 39.3 |
2.6 4 54.9 |
18 42 388 |
24 66 322 |
Manual Electronic Electronic |
| West Africa Cote d’Ivoire Nigeria |
13.6 17.2 |
28.9 12.2 |
0.2 1.7 |
1.2 0.9 |
1.4 11.5 |
2.6 8.8 |
39 214 |
38 188 |
Electronic Electronic |
| Sub-Saharan Africa | 128.2 | 67 | 43.2 | 29.2 | 37.3 | 47.2 | 911 | 923 | n/a |
| World | 93.7 | 74.2 | 102.8 | 69.4 | 116.5 | 99.8 | 50,936 | 47,520 | Electronic |
Source: Makoni (2016)
The Stock Exchange of Mauritius Ltd (SEM) was incorporated in Mauritius in 1989 under the Stock Exchange Act of 1988, as a private limited company responsible for the operation and promotion of an efficient and regulated securities market in Mauritius. The SEM started its operations with only five listed companies on the Official Market, with a market capitalisation of nearly USD 92 million. The size of the market has grown from a market capitalisation to GDP ratio of less than 4% in 1989, to its current stock market capitalisation ratio exceeding 75%. SEM operates two markets: the Official Market, as well as the Development and Enterprise Market (DEM). The latter (DEM) was set up in 2006, specifically for Small and Medium-sized Enterprises (SMEs) and start-up companies which possess a sound business plan and demonstrate a good growth potential. It targets companies wishing to avail themselves of the advantages and facilities provided by an organised and regulated market to raise capital to fund their future growth, improve liquidity in their shares, obtain an objective market valuation of their shares and enhance their overall corporate image (Stock Exchange of Mauritius).
As on 30 June 2016, there were 51 companies listed on the Official Market, with a market capitalisation of nearly US $5.5 billion, while the DEM has listed companies, with a market capitalisation of nearly US $1.2 billion (Stock Exchange of Mauritius). Local investors are active participants on the SEM, accounting for about 60% of the daily trading activities, while foreign investors account for the remaining 40%. Institutional investors such as mutual funds, pension funds and insurance companies contribute 75% of the local trading volumes.
In terms of foreign participation, SEM has rules for remote membership in place, with the objective of encouraging membership from foreign brokers and foreign participants. The stock market was opened to foreign investors following the lifting of exchange controls in 1994. Foreign investors do not need approval to trade shares, except for the holding of more than 15% in a sugar company. Foreign investors benefit from numerous incentives such as revenue on sale of shares being freely repatriated and there being no withholding taxes on dividends and no taxes on capital gains, implying capital openness in Mauritius. SEM is also the only African bourse that lists, trades and settles equity and debt products in currencies such as the United States Dollar (USD), Euros (EUR), British Pounds (GBP), and South African Rands (ZAR), in addition to the local Mauritian Rupee currency (MUR) (Stock Exchange of Mauritius). This reinforces the attractiveness of SEM as a listing and capital-raising platform for African and emerging market issuers, and for harnessing inward foreign investment from the world over.
According to the African Development Bank (2016), banks are the predominant intermediaries in the financial sector, with assets worth one trillion rupees in December 2013. The banking sector is highly concentrated with the four largest banks holding 56.5% of the sector’s assets as at September 2015. The next section presents the literature review of the study.
Theoretical and Empirical Literature
Ohlin (1933), Iversen (1936) and Kemp & Jones (1962) assumed that in the presence of perfect markets, financial capital goes to host countries which present the highest returns. However, others such as French & Poterba (1991) and Gokkent (1997) found that investors hold a large proportion of domestic assets in their portfolio (home bias). The theory of FPI is premised on macroeconomic variables, such as interest rate differentials and exchange rate fluctuations (Dunning & Dilyard, 1999). According to them, money seeks higher interest rates and higher profits, as underlying motives of any investment decision. This being the case, the emergent theory that can be used to explain foreign portfolio investment is Sharpe’s (1964) and Lintner’s (1965) International Capital Asset Pricing Model (ICAPM). According to Bartram & Dufey (2001), the ICAPM builds in a risk premium on the global market portfolio and the relevant currencies. Unfortunately, the ICAPM assumes that a real risk-free rate of return but this is not so because of exchange rate risk resulting from deviations from the purchasing power parity.
We make reference to the Harrod-Domar model, a neo-classical growth theory wherein the savings-investment relationship strives to double the long-term growth of a developing country; which was however criticised for being too optimistic. The work of Agbloyor et al., 2014 suggested that international capital flows enhanced domestic investment of host countries by adding to its domestic savings. The accumulated savings would then be transformed by the local financial markets, coupled with sound government investment policies and institutions into investment, translating into higher levels of productivity. The end result would be that this acts as a stimulus to economic growth for the country. This conceptualisation explains how international capital inflows interact with the domestic financial markets, and make a positive contribution to the overall performance of the domestic economy.
Locational aspects which are taken into consideration when examining drivers of FPI include the host nation’s political stability, currency risk, and government macro and micro economic policies (Bartram & Dufey, 2001). They further add that by being players in other countries’ markets, foreign investors contribute to such countries’ economic growth, while at the same time hedging their own portfolios against exchange risk and achieving portfolio diversification.
Several empirical studies confirm that FPI is influenced by interest rates, foreign exchange rates, economic growth, political risk, transaction costs and rates of return. Portes & Rey (2005) found that market size, efficiency of technology and distance are important determinants of cross-border equity flows (FPI). Agarwal (1997) using the economies of six Asian countries, found that inflation, real exchange rate, economic activity index and share of domestic capital market in the world stock market capitalisation were all statistically significant FPI determinants; while FDI, foreign trade and current account deficit were insignificant. Roque & Cortez (2014) also found that familiarity, corporate governance, host country market size and level of development matter for FPI. More recently, using ARDL, Haider et al., 2017 found that stock market performance had a significant positive impact on FPI on their study of quarterly time series Chinese data between 2007 and 2015. Adopting GMM using panel data for 19 developed and developing countries between 2004 and 2013, Singhania & Saini (2018) concluded that the interest rate differential, trade openness and host country stock market performance were major drivers of inward FPI flows. With regard to financial market development specifically, Al-Smadi (2018) found that foreign investors are attracted to those capital markets which offer them portfolio and risk diversification opportunities, based on his examination of FPI determinants in Jordan between 2000 and 2016.
From the foregoing discussions, it has been ascertained that FPI contributes to the economy of many developing countries. However, the various channels through which investors enter host countries is largely dependent on location-specific characteristics, which are often at the control of the host governments and policy-makers. With this in mind, we seek to identify and confirm the determinants of FPI and the specific role of the domestic financial markets in the host country of Mauritius. The next section considers the data and variables of our study.
Methodology
Data and variables
This study employed annual financial, economic and institutional quality data drawn from the World Bank’s Development Indicators (2014) databases. Table 2 below summarises the variables used in this study, and where they were also applied in similar studies.
| Table 2 Indicators of FDI, FPI and FMD variables |
||
| Variable | Indicator | Similar Studies (Sources) |
| FDI and FPI inflow variables | ||
| FDIGDP | Ratio of net FDI inflows to GDP | Alfaro et al. (2004); Asiedu (2006); Otchere, Soumaré and Yourougou (2015) |
| FPIGDP | Ratio of net FPI inflows to GDP | Agbloyor et al. (2014); Otchere et al. (2015) |
| Financial market development variables | ||
| SMCAP | Stock market capitalisation of listed companies as % of GDP | Demirguc-Kunt and Levine (1996); Chinn and Ito (2006); Agbloyor et al. (2013) |
| SMTVT | Stock market value traded (total value as % of GDP) | Demirguc-Kunt and Levine (1996); Chinn and Ito (2006); Soumaré and Tchana (2015) |
| PCRED | Domestic credit to the private sector by deposit banks as a share of GDP | Demirguc-Kunt and Levine (1996); Agbloyor et al. (2014); Soumaré and Tchana (2015) |
| LIQLI | Liquid liabilities of the financial system (M3) divided by GDP | Demirguc-Kunt and Levine (1996); Alfaro et al. (2004); Soumaré and Tchana (2015) |
| CCBA | The ratio of commercial bank assets to commercial bank and central bank assets | Demirguc-Kunt and Levine (1996); Alfaro et al. (2004); Soumaré and Tchana (2015) |
| Economic and other control variables | ||
| RGDPG | Real GDP growth rate | Ekeocha, Ekeocha, Victor and Oduh (2012); Otchere et al. (2015) |
The population used included a set of variables indicated in Table 2 for Mauritius. Purposive sampling was utilised as a time series data for Mauritius covering the period 1989 to 2016 was chosen for our econometric analyses. The series only commences in 1989 because that is when the Stock Exchange of Mauritius commenced trading. This study was limited to Mauritius as a case study due to its emergence and recent performance as a frontrunner in harnessing foreign portfolio capital flows amongst African countries.
Using various time series techniques, we set out to identify and examine the short run and long run dynamics of FPI, focusing mainly on the role of Financial Market Development (FMD) and FDI. Precisely, the study seeks to investigate the long run and short run relationship between FPI, FDI and FMD. To determine whether there is cointegrating relationship amongst the selected variables, we utilised the ARDL model given that the time series data is only limited to 28 years. The ARDL co-integration technique is one preferable approach when dealing with variables from a small sample size (Nkoro & Uko, 2016). Moreover, the ARDL model is efficient and robust in analysing variables that are integrated at level [I (0)] and order one [I (1)] or a combination of both. Pesaran et al. (1999) argue that the ARDL approach is able to identify the cointegrating vectors in the environment where there are more than one cointegrating vectors.
The next section presents the results of the econometric analysis and a discussion of the empirical findings.
Analysis Of Findings And Discussion
Stationarity tests were conducted to determine the order of integration of our variables, for the purposes co-integration tests and regression analyses. The unit root tests provided guidance as to whether ARDL was appropriate or not, since the ARDL methodology is only applicable for the analysis of variables that are integrated of order zero [I (0)] or order one [I (1)] (Nyasha & Odhiambo, 2015). So, unit root tests and ARDL were complementary to each other. The four variables, namely Foreign Portfolio Investment (FPI), Foreign Direct Investment (FDI), Gross Domestic Product (GDP) and Financial Market Development (FMD) composite FMD index) were tested for stationarity using the Augmented Dickey-Fuller (ADF), and Phillips-Perron (PP) tests prior to testing for co-integration using the ARDL bounds approach and the VECM. The null hypothesis under all the tests was that each series in the panel contained a unit root. The results of the stationarity tests are presented in Table 3.
| Table 3 Stationarity Test - Augmented Dickey Fuller (Adf) Results And Phillips-Perron (Pp) |
|||
| Variable | No trend | Trend | Intercept |
| Stationary tests of variables on first difference – Augmented Dickey Fuller (ADF) test | |||
| FPI | -5.484458*** | -4.120904** | -5.360238*** |
| FDI | -1.939189** | -2.040797 | -1.969454* |
| FMD | -5.326439*** | -5.816774*** | -5.815270*** |
| GDP | -6.786609*** | -6.651938*** | -6.835165*** |
| Stationary tests of variables on first difference – Phillips – Perron (PP) test | |||
| FPI | -10.50011*** | --10.10341*** | -10.57934*** |
| FDI | -1.939189** | -0.185744 | -1.256625* |
| FMD | -4.810089*** | -8.895046*** | -7.954904*** |
| GDP | -22.68268*** | -24.61753*** | -25.48371*** |
***, **,* Denotes 1%, 5% and 10% level of significance respectively.
Source: Authors’ computations
The lag structure was determined using the automatic Akaike Information Criterion (AIC). The optimal lag length was determined to be 4.
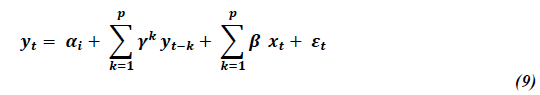
In order to investigate the relationships between FPI, FDI and FMD variables, respectively, the models below were specified and estimated using the ARDL bounds testing approach. The ARDL methodology, which is based on the estimation of an Unrestricted Error Correction Model (UECM), use both lagged (to estimate the long run model) and differenced (used to estimate the short run model) variables. On the other hand, the VECM (modelled in the next section) assumes that all variables in the model are endogenous, uses Vector Auto Regression (VAR), and is applicable in situations where there is more than one cointegrating relationship in the model. The VECM can be considered to be a restricted VAR model (Pesaran et al., 2001). Models using the ARDL Bounds Testing approach, consisting of an Unrestricted Error Correction Model (UECM) are specified as follows:
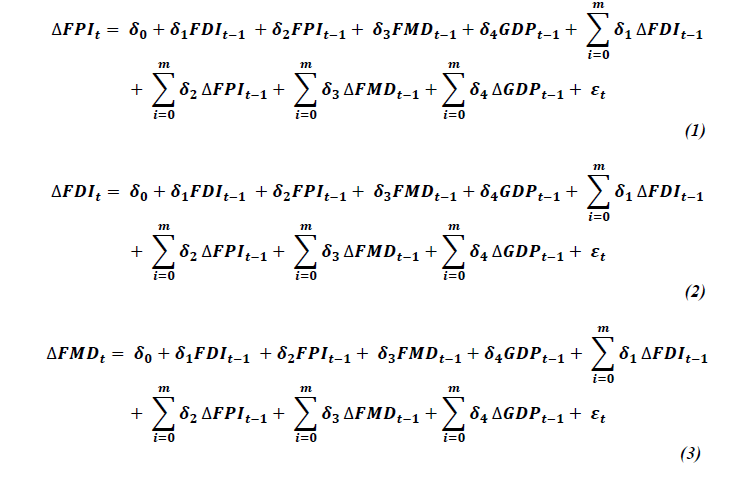
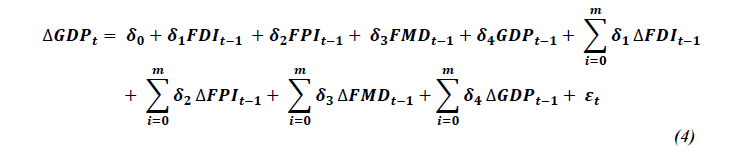
Where, Δ represents the first difference operator. 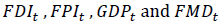 respective dependent variables (FDI = inflow of foreign direct investment as percentage of GDP; FPI=Foreign Portfolio Investment inflows as a percentage of GDP, GDP=Gross Domestic Product growth rate) for Mauritius at time t.
  is proxied by a composite index of financial market development constructed using SMCAP, SMTVT, CCBA, LIQLI, PCRED.
 is a random error term.
When comparing the estimated F-statistics from the Wald tests to the asymptotic critical value bounds from Pesaran et al. (2001), if the computed f-statistic fell below the lower bound, if the variables are [I (0)], so no cointegration exists. However, if the f-statistic exceeded the upper bound [I (1)], then a cointegrating/long-run relationship existed. If the F-statistic was between the lower and upper bound values, then the test of level relationship was inconclusive. The values of our F-statistics are captured in Table 4.
| Table 4 Bounds Test Results |
|||||
| Pesaran/Shin/Smith (2001) ARDL Bounds Test | |||||
| H0: No levels of relationship | F=2.5e +04 | ||||
| T= -4.992 | |||||
| Critical Values (0.1-0.01), F-statistic, Case 3 | |||||
| [I_0] [I_1] L_1 L_1 |
[I_0] [I_1] L_05 L_05 |
[I_0] [I_1] L_025 L_025 |
[I_0] [I_1] L_01 L_01 |
||
| K_3 | 2.72 3.77 | 3.23 4.35 | 3.69 4.89 | 4.29 5.61 | |
| Accept if F< critical value for I(0) regressors | |||||
| Accept if F> critical value for I(1) regressors | |||||
The results from Table 4 below show that there is cointegrating relationship between FPI and the dependent variables (FDI, FMD, and GDP). This shows that these variables move together in the long-run. However, a mere understanding that there is a long-run relationship is not sufficient for policy influence therefore; we need to test further what variable causes which variable. Granger causality will be tested later in this paper. In a bid to understand the short-run dynamics, we further tested the relationship between variables through the vector error correction model.
Vector Error Correction Model (VECM)
Similar to Hajilee & Al Nasser’s (2015) study, we advanced the argument that both the banking sector and the stock market might have long-run and short-run effects on FDI and FPI in Mauritius. As a way of validating the ARDL model both the long-run and short-run effects had to be rerun empirically using the VECM. The VECM is employed in this case because the ARDL model has already confirmed that the is a cointegrating relationship amongst these variables. We further test the association as testing only the long-run relationship would may be misleading.
As such, both the short-run and long run dynamics were further analysed by estimating vector error correction models specified as:
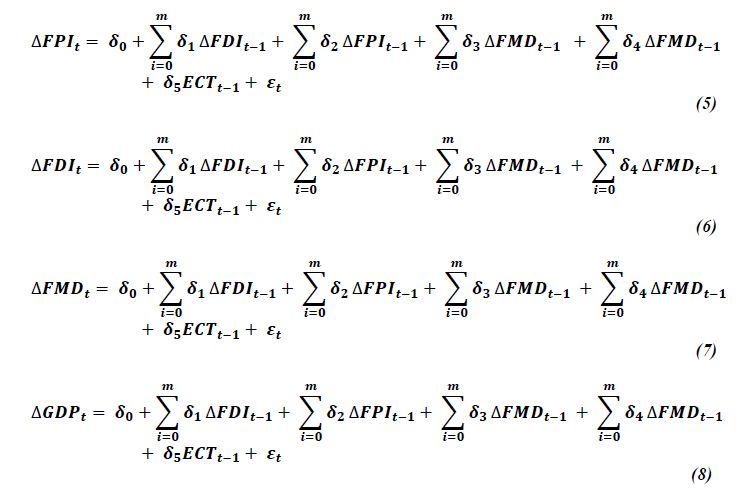
Where, ECT is the error correction term obtained from the co-integration relationships, while its coefficients  represent the speed of adjustment to long-run equilibrium.
 is the white noise error term and all the other variables are as previously defined. According to Gujarati & Porter (2009), Engle and Granger’s error correction mechanism is a means of reconciling the short-run behaviour of an economic variable with its long-term trends. Theoretically, the Error Correction Term (ECT) should fall between 0 and -1. A positive sign of the ECT indicates the presence of autocorrelation, and also that due to any structural changes in the variables under study, the time series will diverge from equilibrium (instead of converging). None of the variables in this particular study gave a positive resultant ECT.
The results from Table 5 confirm the ARDL estimation results that indeed there is a long run association between FPI and the independent variables. The FPI’s interaction with the independent variables resulted in an error correction terms of -0.6614. This demonstrates that approximately 66.14% of the disequilibrium in the series was corrected within a year. However, the error correction term is not negative and is not significant for the other dependent variables showing a non-cointegrating relationship amongst the variables.
| Table 5 Cointegration Relationships |
|||
| Dependent variable | Error correction term (ECM) | Probability | Conclusion |
| FPI | -0.6614 | 0.0030 | There is a long run relationship |
| FDI | 0.4057 | 0.4570 | There is no long run relationship |
| FMD | 0.0033 | 0.4520 | There is no long run relationship |
| GDP | 0.0549 | 0.0100 | There is no long run relationship |
Table 6 results showed a short-run causality that runs from the three independent variables to FMD. This implies that Mauritius can put in place polices to attract FDI and FPI as these are good for the development of their financial markets in the short run. Likewise, policies that enhance economic growth are good for the country. To further our understanding on the long run causality, the variables were tested using the Granger causality estimation technique.
| Table 6 Short Run Causality |
|||
| Dependent variable | Chi-square | Probability | Conclusion |
| FPI | 9.76 | 0.1350 | There is no short run causality |
| FDI | 7.10 | 0.3120 | There is no short run causality |
| FMD | 18.32 | 0.0026 | There is short run causality |
| GDP | 14.35 | 0.0135 | There is short run causality |
Granger Causality Testing Between FDI, FPI Z and FMD
In order to empirically test for causality in this paper, we employed the Granger causality test. Granger causality is the presumption that knowledge of past values of one variable (X) help to improve the forecasts of another variable (Y). Hence, if variable X (Granger) causes variable Y, then changes in X should precede changes in Y. Past events (X) cannot be influenced by future events (Y) (Kar et al., 2011).
Having obtained results of the unit root and co-integration tests, we proceeded to run the actual Granger causality tests between the FDI, FPI and FMD variables using the optimal lag lengths. We considered the following standard specification for testing Granger causality between the variables, observed on T years and on one country (Gujarati & Porter, 2009; Hurlin, 2004).
Where, x and y are two stationary variables, k is the time lag, parameter are i.i.d (0, σε2), P is the number of lags and  The basic assumption is that the relationship between x and y holds for at least one subset of variables in the sample. Consistent with Hurlin & Venet (2008) and β is the regression coefficients for the independent variables.
More specifically, we also considered the following models for testing Granger causality between the FDI, FPI, FMD and GDP variables:
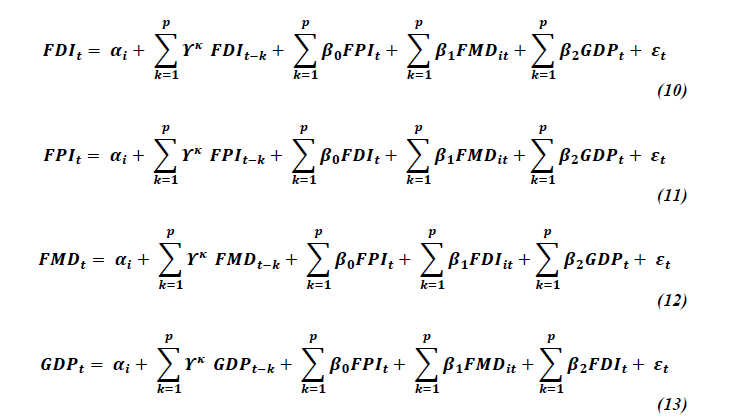
The results of the Granger causality tests are presented in Table 7. A rejection of the null hypothesis implied a causal relationship between the pairwise variables being examined.
| Table 7 Granger Causality Wald Tests |
|||||
| Equation | Excluded | F | df | df_r | Prob>F |
| FPIGDP FPIGDP FPIGDP FPIGDP |
FDIGDP FMD RGDPG ALL |
1.3279 6.7864 1.8469 4.3728 |
4 4 4 12 |
6 6 6 6 |
0.3595 0.0205 0.2390 0.0407 |
| FDIGDP FDIGDP FDIGDP FDIGDP |
FPIGDP FMD RGDPG ALL |
5957.3 3.2283 1.1591 2458.1 |
4 4 4 12 |
6 6 6 6 |
0.0000 0.0973 0.4142 0.0000 |
| FMD FMD FMD FMD |
FPIGDP FDIGDP RGDPG ALL |
.55994 .45871 3.1606 1.2907 |
4 4 4 12 |
6 6 6 6 |
0.7010 0.7647 0.1012 0.3953 |
| RGDPG RGDPG RGDPG RGDPG |
FPIGDP FDIGDP FMD ALL |
.27677 .96784 .40709 .50681 |
4 4 4 12 |
6 6 6 6 |
0.8829 0.4889 0.7982 0.8510 |
The results from the granger causality estimations are reported in Table 7 above. As expected, results show that FMD causes FPI, FPI causes FDI, and at the 90% confidence level FMD causes FDI. Moreover, jointly FDI, FMD and GDP growth granger causes FPI; while on the other hand, we find that FPI, FMD and GDP growth collectively granger causes FDI. These estimation results mean that Mauritius should develop its financial markets in all aspects of liquidity, volume traded, market capitalisation and other related elements so as to attract foreign portfolio investment and foreign direct investment. Thus Mauritius is not structurally different from other developing countries as results confirm what Agarwal (1997), Alfaro et al. (2004) and Anyanwu & Yameogo (2015) found. This current situation will however be further advantaged by an economy with high growth prospects, in line with Asiedu (2006) and Agbloyor et al. (2013).
We however find no causality that runs from FPI, FDI and GDP to FMD meaning that financial market development is internally catalysed. This is in stark contrast to the findings of Otchere et al. (2015) that there is a bi-directional causality between the variables. In fact, our results reveal that Mauritius should develop its financial system to attract both FDI and FPI and not the other way round. Contrary to the modernisation neo-classical theories’ perspective, dependency theorists argue that reliance on foreign investment is expected to have a negative effect on growth and the distribution of income. According to Amin (1974), the multiplier effect by which demand in one sector of the country creates demand in another is weak, and thereby leads to stagnant growth in developing countries. In line with this, our results also show that FPI, FDI and FMD individually, and jointly, do not cause real GDP.
Conclusions And Recommendations
The aim of this paper was to identify the key role of financial markets in attracting FPI inflows to Mauritius, a developing country in Africa. Gauging FPI against a Principal Component Analysis (PCA) constructed composite index of financial market development, the study confirmed that there was a cointegrating (long run) relationship between FPI and the three independent variables (FDI, FMD and GDP), and short run causality from the three independent variables to financial market development. In terms of granger causality, we found that FMD causes both FPI and FDI, while FPI causes FDI. Lusinyan (2002) presented evidence that the share of FPI inflows in total capital flows increases with financial market development. These findings are also in line with earlier assumptions that in order for any form of foreign investment to occur, there has to be some level of financial market development that is both markets to participate in and instruments to invest in.
Further to this, foreign direct investors use FPI to test the waters in unknown host countries prior to making more permanent investments, hence the direction of causality between FPI and FDI. Law & Habibullah (2009) affirmed that well-functioning financial markets and financial institutions should be a policy priority for governments. In line with this, the Mauritian government is implored to continue harnessing foreign capital flows by ensuring the sustained improvement of its domestic financial and trade offerings, supported by investor-friendly policies as a macroeconomic government strategy.
The collective influence of FDI, FPI and GDP growth on FMD provides a substantial argument for domestic savings to be increased, which would have the spill over effect of improving local financial markets, thereby providing foreigners with an inlet into the Mauritius economy. Domestic financial development would in this way complement the efforts of other industrial sectors such as ICT, tourism and manufacturing to ensure continual economic growth, in line with the neo-classical growth theories.
References
- Abdimomynova, A. (2018). Development factors of export potential of the region: capabilities in minerals and infrastructure sector. Academy of strategic management journal, 17(3), available online from https://www.abacademies.org/articles/development-factors-of-export-potential-of-the-region-capabilities-in-minerals-and-infrastructure-sector-7258.html
- Ablaev, I. (2018). Innovation clusters and regional development. Academy of strategic management journal, 17(3), available from https://www.abacademies.org/articles/innovation-clusters-and-regional-development-7259.html
- African Development Bank (AfDB) (2016). African economic outlook 2015, African Development Bank.
- Agarwal, R. (1997). Foreign portfolio investment in some developing countries: A study of determinants and macroeconomic impact. Indian Economic Review, 32(2), 217-229. Available from http://www.jstor.org/stable/29794138
- Agbloyor, E. K., Abor, J. Y., Adjasi, C. K. D., & Yawson, A. (2014). Private capital flows and economic growth in Africa: The role of domestic financial markets. Journal of international financial markets, institutions and money, 30,137-152. http://dx.doi.org/10.1016/j.intfin.2014.02.003
- Agbloyor, E. K., Abor, J., Adjasi, C. K. D., & Yawson, A. (2011). Financial markets and cross border mergers and acquisitions in Africa. http://dx.doi.org/10.2139/ssrn.1914478
- Agbloyor, E. K., Abor, J., Adjasi, C. K. D., & Yawson, A. (2013). Exploring the causality links between financial markets and foreign direct investment in Africa. Research in international business and finance, 28, 118-134. http://dx.doi.org/10.1016/j.ribaf.2012.11.001
- Aggarwal, R., Klapper, L., & Wysocki, P. D. (2005). Portfolio preferences of foreign institutional investors. Journal of banking and finance, 29(12), 2919-2946. http://dx.doi.org/10.1016/j.jbankfin.2004.09.008
- Alfaro, L., Chanda, A., Kalemli-Ozcan, S., & Sayek, S. (2004). FDI and economic growth: The role of local financial markets. Journal of international economics, 64(1), 89-112.
- Al-Smadi, M. O. (2018). Determinants of foreign portfolio investment: the case of Jordan. Investment management and financial innovations, 15(1), 328-336.
- Amin, S. (1974). Accumulation and development: a theoretical model. Review of african political economy, 1(1), 9-26.
- Anyanwu, J. C., & Yameogo, N. D. (2015). What drives foreign direct investments into West Africa? An empirical investigation. African development review, 27(3), 199-215. http://dx.doi.org/10.1111/1467-8268.12141
- Asiedu, E. (2006). Foreign direct investment in Africa: The role of natural resources, market size, government policy, institutions and political instability. The World Economy, 29(1), 63-77. http://dx.doi.org/10.1111/j.1467-9701.2006.00758.x
- Asiedu, E. (2013). Foreign direct investment, natural resources and institutions. International Growth Centre Working Paper. Available from http://www.theigc.org/wp-content/uploads/2014/09/Asiedu-2013-Working-Paper.pdf
- Bartram, S. M., & Dufey, G. (2001). International portfolio investment: Theory, evidence, and institutional framework. Financial markets, institutions and instruments, 10(3), 85-155. http://dx.doi.org/10.1111/1468-0416.00043
- Dunning, J. H., & Dilyard, J. R. (1999). Towards a general paradigm of foreign direct and foreign portfolio investment. Editorial statement, 8(1), 1.
- Ekeocha, P. C., Ekeocha, C. S., Victor, M., & Oduh, M. O. (2012). Modelling the long run determinants of foreign portfolio investment in Nigeria. Journal of economics and sustainable development, 3(8), 194-205.
- Eun, C. S., & Janakiramanan, S. (1986). A model of international asset pricing with a constraint on the foreign equity ownership. The journal of finance, 41(4), 897-914.http://dx.org.doi/10.1111/j.1540-6261.1986.tb04555.x
- French, K. R., & Poterba, J. M. (1991). Were Japanese stock prices too high?. Journal of financial economics, 29(2), 337-363. http://dx.doi.org/10.1016/0304-405X(91)90006-6
- Gokkent, G. M. (1997). Theory of foreign portfolio investment. Unpublished PhD thesis. Available from Proquest ETD collection for FIU.
- Gujarati, D. N., & Porter, D. C. (2009). Causality in economics: The Granger causality test. Basic Econometrics, New York: McGraw-Hill, 652.
- Haider, M. A., Khan, M. A., Saddique, S., & Hashmi, S. H. (2017). The Impact of Stock Market Performance on Foreign Portfolio Investment in China. International journal of economics and financial issues, 7(2), 460-468.
- Hajilee, M., & Al Nasser, O. M. (2015). The relationship between financial market development and foreign direct investment in Latin American countries. Journal of developing areas, 49(2), 227-245.
- Hong, S. J. (2017). Investment escalation in foreign subsidiaries: expatriate managers' career concern and negative framing. Academy of Strategic Management Journal, 16(2), available from https://www.abacademies.org/articles/investment-escalation-in-foreign-subsidiaries-expatriate-managers-career-concern-and-negative-framing-6695.html
- Hurlin, C. (2004). Testing Granger causality in heterogeneous panel data models with fixed coefficients. Document de recherche LEO, 5.
- Hurlin, C., & Venet, B. (2008). Financial development and growth: a re-examination using a panel Granger causality test.
- International Monetary Fund (IMF). (1993). In IMF (Ed.), Balance of payments manual (5th ed.) IMF.
- Iversen, C. (1936). Aspects of the theory of international capital movements. Taylor and Francis.
- Kar, M., Nazl?o?lu, ?., & A??r, H. (2011). Financial development and economic growth nexus in the MENA countries: Bootstrap panel granger causality analysis. Economic modelling, 28 (1–2), 685-693. http://dx.doi.org/10.1016/j.econmod.2010.05.015
- Kemp, M. C., & Jones, R. W. (1962). Variable labour supply and the theory of international trade. Journal of political economy, 70(1), 30-36.
- Kovalenko, E.G., Polushkina, T.M. & Yakimova, O.Y. (2017). State regulations for the development of organic culture by adapting European practices to the Russian living style. Academy of strategic management journal, 16, 1-15.
- Kuncic, A. (2014). Institutional Quality Dataset. Journal of Institutional Economics, 10(1), 135-161.
- Law, S. H., & Habibullah, M. S. (2009). The determinants of financial development: Institutions, openness and financial liberalisation. South African journal of economics, 77(1), 45-58.
- Levine, R., & Zervos, S. (1996). Stock market development and long-run growth. The world bank economic review, 10(2), 323-339.
- Lusinyan, L. (2002). International capital flows, economic growth and financial market efficiency.
- Makoni, P. L. R. (2016). The role of financial market development in foreign direct investment and foreign portfolio investment in selected African economies (Doctoral dissertation).
- Mikhailovich, N. R., Dmitrievich, S. V., Evgenevna, G. A., & Pavlovna, G. N. (2017). Features of Innovation Management Strategies in the Post-Industrial Economy. Academy of strategic management journal, 16(2), available from https://www.abacademies.org/articles/features-of-innovation-management-strategies-in-the-postindustrial-economy-6857.html
- Nkoro, E., & Uko, A. K. (2016). Autoregressive Distributed Lag (ARDL) cointegration technique: application and interpretation. Journal of Statistical and Econometric Methods, 5(4), 63-91. Available from http://www.scienpress.com/Upload/JSEM/Vol%205_4_3.pdf
- Nyasha, S., & Odhiambo, N. M. (2015). Are banks and stock markets complements or substitutes? empirical evidence from three countries. (Working Paper). Pretoria: University of South Africa (UNISA).
- Ohlin, B. (1933). International and interregional trade. Harvard Economic Studies, Cambridge, MA,
- Otchere, I., Soumaré, I., & Yourougou, P. (2015). FDI and financial market development in Africa. The world economy, 1-28. http://dx.doi.org/10.1111/twec.12277
- Pesaran, M. H., Shin, Y., & Smith, R. J. (2001). Bounds testing approaches to the analysis of level relationships. Journal of applied econometrics, 16(3), 289-326. http://dx.doi.org/10.1002/jae.616
- Pesaran, M. H., Shin, Y., & Smith, R. P. (1999). Pooled mean group estimation of dynamic heterogeneous panels. Journal of the american statistical association, 94(446), 621-634.
- Portes, R., & Rey, H. (2005). The determinants of cross-border equity flows. Journal of International Economics, 65(2), 269-296.
- Roque, V., & Cortez, M. C. (2014). The determinants of international equity investment: Do they differ between institutional and non-institutional investors?. Journal of banking and finance, 49, 469-482. http://dx.doi.org/10.1016/j.jbankfin.2014.06.015
- Singhania, M., & Saini, N. (2018). Determinants of FPI in Developed and Developing Countries. Global Business Review, 19(1), 187-213.
- World Bank Group. (2014). World development indicators (WDI) 2014. World Bank Publications.